Proof of Concept: How to verify that ML implementation is worth the candle
Recently, the date of Satanists raised the question of how to properly “sell” internal machine learning projects in a cozy chatika. It turned out that many of us are very squeamish about the economic justification of their activities. Meanwhile, in order to make a minimum assessment of the profitability of the project, no MBA is needed - in a small article (10 pages of text, ke-ke-ke) I will tell you what ROI is, how to evaluate it for an internal project, what role does Proof of Concept, and why things can go wrong in real life. We will do all this around a fictional project to automate the creation of schedules for a call center. Welcome under the cut!

Our fictional project
The call center employs 100 operators. They work on a floating schedule, going to work in shifts of 8 or 12 hours. Shifts begin at different times and are arranged so as to ensure the duty of many people at peak hours and a small number of people during cold hours at night and on weekends. The schedule is scheduled by the call center supervisor on dark Friday nights, by eye, planning the workload for the next week.
One 8-hour day of work of the call center operator costs the company 2.000 rubles. If we assume that there are 250 working days in a year, then the call center costs the company in 100 х 2.000 х 250 = 50 млн рубa year. If we automate scheduling, we will be able to predict the hourly load and arrange shifts to vary the number of operators on duty depending on the forecast load. If our prediction and shift placement turns out to be at least 10% better than the forecast and placement of the supervisor, we’ll get savings of as much as 5 million rubles. in year. If we really manage to squeeze a 10% improvement, the project will definitely pay off. Or not? .. Let's think about how to make such decisions.
What is ROI
Before starting a large project, it would be nice to evaluate its economic feasibility. A textbook way to do this is to calculate return on investment, ROI.
ROI (Return on Investment) is a measure of the profitability of the project, equal to the ratio of income to investment spent. ROI <100% means that the project does not pay off.
The first project costs occur immediately, at the start - for the purchase of hardware and licenses, system development and its implementation. This is called capital expenditure. In the course of the project’s life, it also has to incur costs - for renting the same hardware and licenses, maintaining the system and, sometimes, working the operators. This is called operating expenses.
ML projects, as a rule, have no "instant income". The project has only operating income, i.e. in time. For example, in the case of our call center, revenue is generated as cost savings for operators. If the operating costs of the project exceed revenues, the project will never pay off.
Due to the "instant" capital expenditure at the start of the project, the ROI will depend on the time at which we estimate the profitability. Usually, either the year, or the planning horizon, or the lifetime of the system is used to calculate ROI. With the year everything is clear - this is an easy way to understand whether the project will pay off in a year or not. The planning horizon is the time interval for which the company's strategy is planned and budgets are drawn up. In small and dynamic companies, the horizon rarely exceeds a year, in large and stable it can be from three to ten years.
On the far horizon of planning, you can recoup any trash, but the lifetime of the system rises to the custody of common sense. Typically, the system in a few years ceases to meet the requirements of the business, and it is either replaced with a new one, or thrown out, or (most often) is left to rot on the eternal support. With the rapid growth of business, the system can not always live for six months, in a stable market the system without modifications becomes obsolete for 3-5 years, and more than 10 can only live in a very conservative box in a very conservative environment. Discount rates, depreciation and other accounting magic will be left to professional financiers.
Thus, the calculation of ROI is done according to the following formula:
R O I = O n e p and q and a n n s e D of x of d s × C p on to F and of n andK and n and m and n s n s e F and with X of d s + O n e p and q and a n n s e F and with X of d s × C p on to F and of n and
Proof Of Concept
How do we even know that a new implementation will increase the rate by 10%?
First, we can choose this number at random, shake it out of the nearest August. This often works, but just as often leads to disaster. Such a vanguing is not publicly encouraged, however, the aksakals recognize that many successful decisions were, in fact, made "according to a chuya."
Secondly, we can rely on the experience of past implementations. For example, we are introducing automation into the fifth call center in a row, before that we have seen results at 7-10%, we know and are able to solve all typical problems, and it seems that nothing should let us down. The more implementations we have carried out, the more accurate our forecast, and the better we understand the effect of various deviations from the ideal on the result.
Even on the experience of a single implementation, you can make a much more meaningful prediction than on the "chuik". A bold consequence of this - it seems that even the only incomplete implementation will give us a huge head start in front of the "chuykoy". So we come to the idea of Proof of Concept, or PoC.
PoC is needed in order to confirm or disprove the performance of the hypothesis, as well as to evaluate its effectiveness. PoC does not imply a complete implementation, which means that it can be done quickly and cheaply. What are the ways to accelerate in Data Science projects?
- Get data manually, dirty, directly from those places where they are the easiest to analyze. Even if this source is not acceptable for production, it does not matter.
- Use the dumbest heuristics as baseline. For example, the baseline for forecasting the load for the next day is the load for today. Even cooler - the average load for the last 5-7-30 days. You will be surprised, but such a heuristic does not always succeed in surpassing.
- Assess the quality of back-testing - do not conduct new long-running experiments. All data is already in history, we estimate the effect on them.
- Do not try to make reused code. All code after PoC will be thrown into the bucket. We repeat this every morning before sitting down to code.
- Do not try to make a cool model. Put yourself tight deadlines - one to three to five days per model. For such periods it will not be possible to “dig in” into a complex implementation, but it will turn out to sort out a lot of simple options. For these options, you get a reliable lower estimate.
- Aggressively look for a rake, attack all ridiculous places, test dangerous ideas. The more rake we collect at the PoC stage, the less risk there will be during production.
PoC Stages
The duration of a PoC'a usually varies from a week to a couple of months. The task will be worked by one person leading the date of the Satanist. Holding a PoC also requires a lot of attention from a business customer — to talking at the beginning of PoC and to understanding the results at the end. In total, PoC will cost us up to two months of work for the lead DS and a few days of business customers. This is the first indicator - if the customer did not find time for PoC, then the result of a large project will not be truly in demand.
So the stages.
- Go from hotelok and buzzwords to specific business requirements. This is the traditional task of a business analyst, but it is highly desirable for DS to conduct it himself. So he can more accurately understand the needs of the customer and perform the second stage ...
- Formulate an experiment. The correct wording is the key to the success of the project. The DS must determine where in the business process an automated decision is made, what information is available at the entrance, what is expected at the output, what machine learning task it can be reduced to, what data will be needed during training and production, what technical and business metrics to use for evaluation of success.
- Deal with the data. DS must understand what data is generally available to us. Assess their attributive composition, completeness, depth of history, consistency. Quickly assemble a manual dataset sufficient for building a model and testing a hypothesis. It would be nice to immediately realize whether the data in the production will differ from what is available in the train, and what we have collected here.
- Engineer features and build a model. Young Satanists from their early fingernails think only of models (EUROCHYA), so comments are superfluous.
- Rate the quality of the model. Correctly cross-validate, calculate technical and business metrics, as well as assess the limits in which they can fluctuate in production. This is also what DS should do.
- Estimate the resulting ROI - for the sake of it all and is being started. For evaluation, you can involve representatives of the customer and someone who knows how to fin. models.
Let's do a fictional PoC based on our fictional project.
Stage 1. Translation "hotelok" in the task
Here's the wording "Wishlist":
It seems that if we automate the scheduling, we will not only save time on planning, but also learn how to vary the number of shifts depending on the load.
What does this really mean?
It is necessary to make a system that, according to the history of shifts and appeals, will predict the load for the next period, as well as arrange shifts so that the load can be disposed of effectively.
Metrics of load forecast efficiency - an error in the number of hits per time quantum.
Metric utilization efficiency utilization - 95th percentile of waiting time.
Economic metric - the number of shifts for the accounting period.
The task fell apart into two - how to predict the load, and how to arrange shifts.
First, we want to predict the number of calls for two weeks ahead so that the forecast does not turn out to be lower than the real values by more than a certain percentage.
Secondly, we want to minimize the number of shifts per period so as to keep the 95th percentile of the waiting time within acceptable limits, despite the fact that the load will be as predicted.
Stage 2. Experimental wording
Task 1. Load prediction
On Friday of week 1, we want to predict the number of hits in each hour of week 3. The result of the forecast will be 168 numbers — one number for each hour of the next week.
The weekly interval will have to be done so that the operators have time to adjust to the schedule.
We will make a forecast on Friday afternoon - on the one hand, it is as close as possible to the target dates, on the other hand, there is still a half day to settle the schedule manually. We will have access to historical data on appeals in the entire history, as well as a calendar. We will build many features from this. It would be nice to tie the load to our releases, but we will not have such data at the PoC stage.
We reduce the problem to regression. For each hour in history, we will build a feature vector and forecast the load at that hour. Let the success metric be MAPE (or WAPE, let's figure it out). Cross-validation "in the forehead" on the time data can not be - we will look into the future. The usual way out is to split the story into intersecting folds with a weekly shift (four weeks?), And take control over the last week. Success criteria - if our WAPE (or who else is there?) Can be kept within reasonable limits. Over reasonable boundaries, again, we will think in the course of the experiment.
Task 2. Shifts
According to the predicted load, we want to cover it with shifts so that the number of shifts is minimal and the quality indicators remain at an acceptable level.
At the moment we do not arrange the operators on the calendar, we only determine how many shifts on which day to put and with which overlap.
The calculation will be performed immediately after the completion of the load forecast. It turns out that all the same data is available, plus another forecast for the load.
It seems that the task can be reduced to the inverse problem of the backpack, the so-called. Bin Packing Problem . This is an NP-complete problem, but there are algorithms for its suboptimal solution. The task of the experiment will be to confirm or deny their applicability. The target metric will be the number of shifts in combination, the boundary conditions will be the average or maximum length of waiting (or some percentile). We will have to simulate the waiting duration as a function of the number of calls and the number of operators in the work.
Step 3. Examine the available data.
We go to the administrators of our CRM. We pop them a little, and they will upload us a list of all calls to the call center over the past few years. Actually, we are interested, first of all, in the fact of appeal and the time of admission. If we are lucky, we will be able to collect data on the duration of the call, identifiers of operators and customers. In more advanced call centers, there may even be some sort of classification of appeals by topic and results, but we will not need this yet.
Now we go to the call center supervisor and ask to raise all the schedules of operators for several years. The supervisor asks us a couple of times, turns pale, drinks a validolichik - and in a couple of days we will send hundreds of letters with attached echelcians to our mailbox. We'll have to spend three more days to bring it all into one big table with shifts. For the shift, we will know the date, start time, duration, and operator ID.
At once we will think that, probably, the more clients we have - the more they call us. Historical information on the number of customers or the volume of output will be useful - so we can take into account macro trends. We’ll go back to the CRM or ERP administrators and ask them for unloading in terms of sales, number of customers or something like that. Suppose you managed to get data about subscriptions. Now we can build a table, where for each date you can see the number of active clients.
Total, we have three entities, conveniently laid out in three labels:
- Call center call - number, date and time, duration, customer and operator identifiers.
- Operator shift - number, date, start time, duration, operator ID.
- Macro load trend - date, number of active clients
Step 4. Generate the signs and train the model.
As you remember, the task after decomposition fell into two. The second part, about the arrangement of shifts, we will not touch now - there is no need for machine learning. Let's talk about the first part - load prediction.
We formulated the experiment as a regression task - “for each hour in history we will build a feature vector and predict the load at this hour on it”. Let's collect the training sample. The row in the sample will be the calendar hour. Each hour corresponds to the target - the number of hits for this hour.
Now let's think about the signs we can use.
- To begin with, we will use the calendar nature of our data. Add the signs of the day of the week, hour, day of the month. They can be closed into rings .
- Add the number of hits per hour on such days and at such hours. You can take the number of hits in the last week, as well as the average for the month and for the year.
- Add the same number of hits at the exact same hour and day of the week.
- Take the aggregation window wider - add the average number of hits on that day of the week and at such time of the day.
- We will immediately try to normalize the number of hits on the load trend. We test both on normalized and raw values.
- Add seasonality - the number of hits per month last year, normalized to the load trend.
- Just in case, let's also add raw load trend data. And we will take both the value at the current moment, and the “shifted” values - a week ago, a month ago.
Let's try not only the "usual" error function RMSE, but also WAPE - it is more suitable for the purpose of the problem. For validation, we will not be able to use the usual K-fold cross-validation - there will be a chance to look into the future. Therefore, we will use the Nested Folds split, and fix the size of the test fold equal to, say, 4 weeks exactly. And the borders of the folds will be set exactly at midnight on Monday.
For PoC, we will try two models - linear with L1 regularization and the most favorite piece of wood. For the linear model, we will not forget to standardize (and logarithm, where necessary) the signs, and for the wooden model, to unscrew the regularization parameters more aggressively.
Stages 5 and 6. Estimate the quality of the model and the economic effect
So, all the preparations have been completed, and we can finally move on to the most interesting part of PoC, the analysis of the results and decision making.
Unfortunately, the whole example was speculative, without real data, so that the results will be sucked from the finger. So that it was not so embarrassing, I took the numbers in order from the book “Call Center Optimization” written by Ger Koole (I accidentally found it while writing this article ¯\_(ツ)_/¯). The picture from the same place - on it is an example of load forecast.
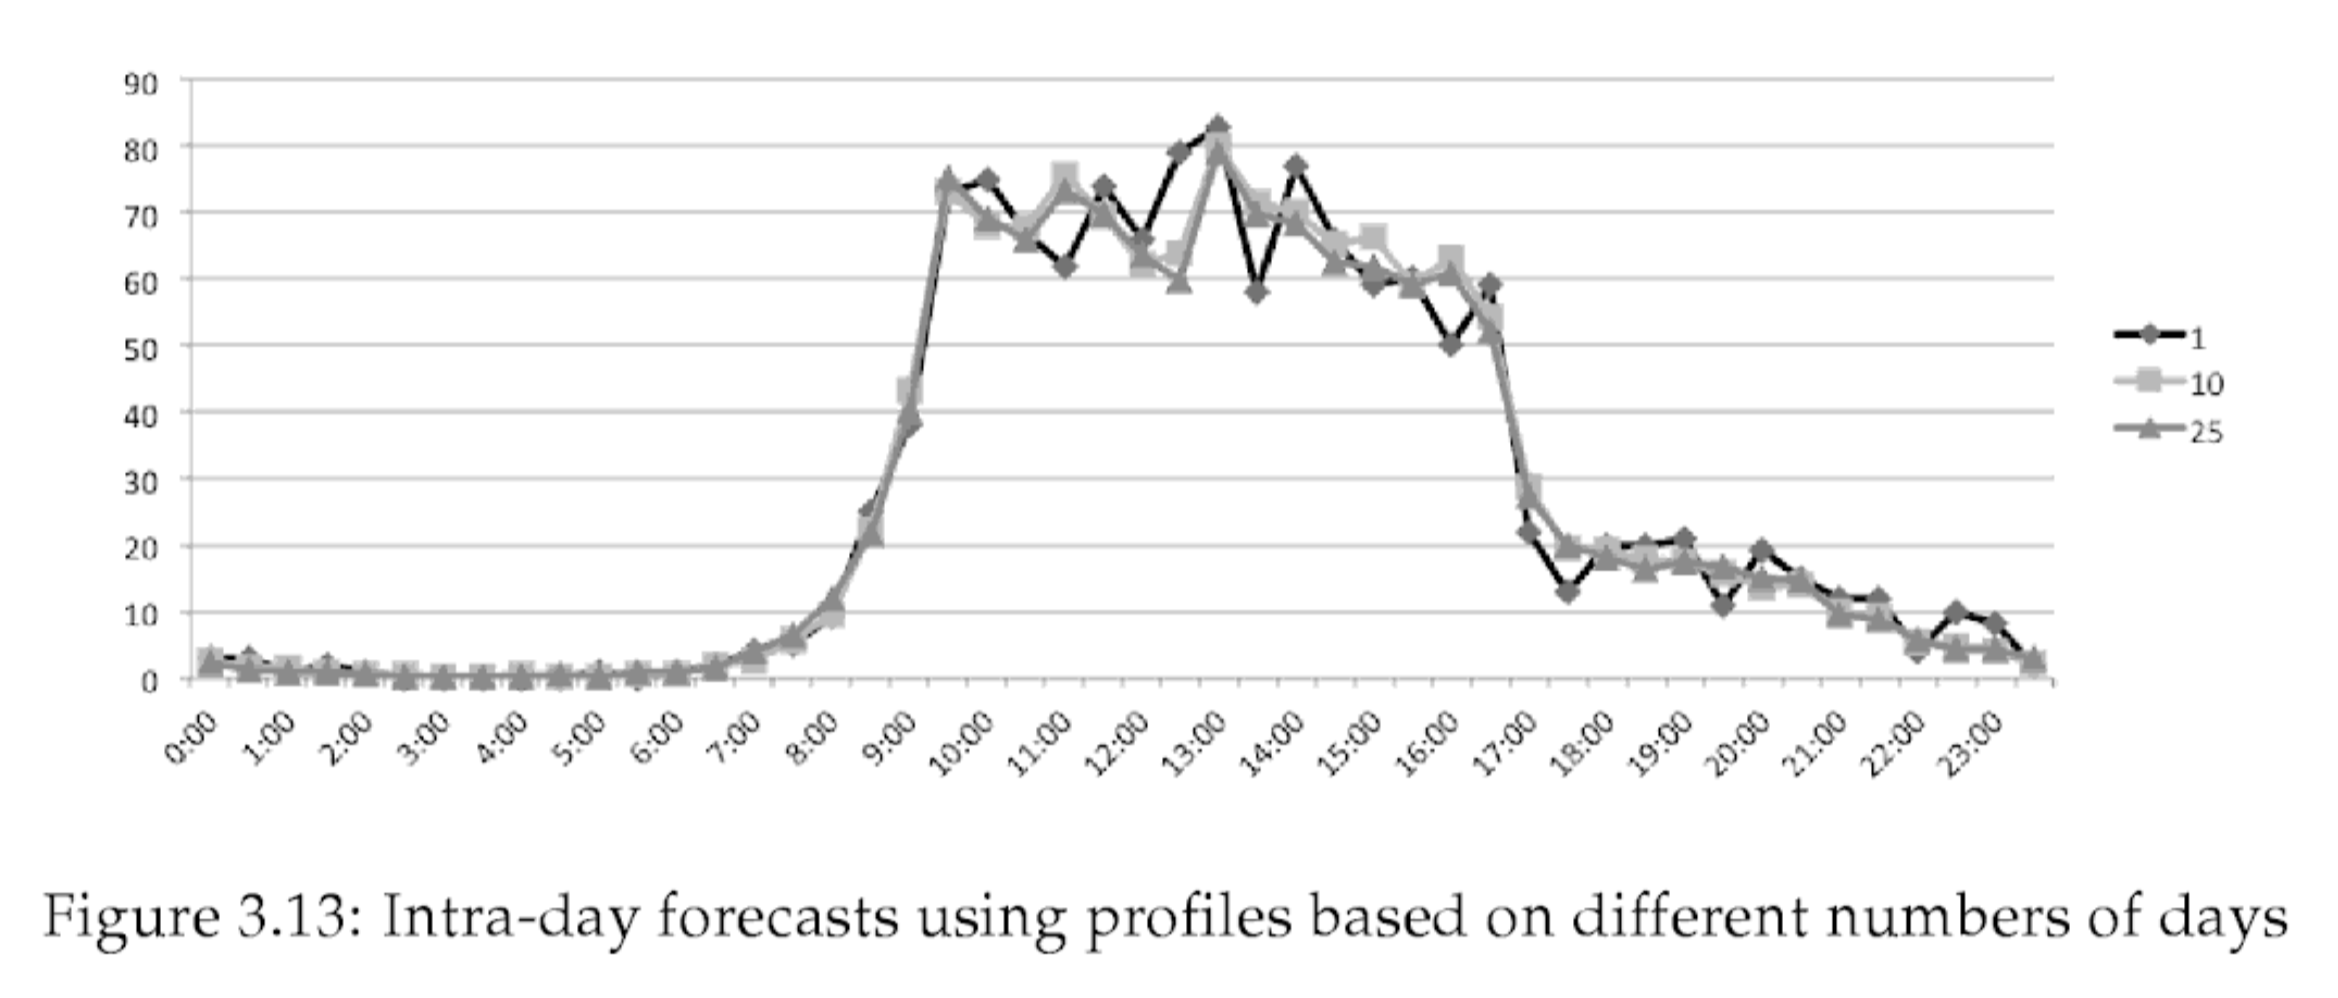
To begin with, we were able to predict the hourly load with WAPE = 14%. It was possible to reach an error of less than 10% by 43% of hours, less than 20% by 70% of hours.
In general, this is very good - we quite accurately catch both daily fluctuations, and weekly cycles, and medium-term trends. We burn only on random fluctuations, and, most likely, they cannot be avoided.
By load, we can easily calculate the number of operators that should be in a shift at a given hour. We wrote a greedy non-optimal shift planner algorithm and calculated that we were able to save 10% of shifts on the predicted load. It turned out that if we add 8-hour shifts in addition to the 12-hour shifts and cleverly arrange them by day, we can save another 5%.
We translate indicators into money. The current cost of the annual maintenance of the call center is 50 million rubles a year. Our experiment showed that we can reduce this amount by 15%, which will lead to savings of up to 7.5 million rubles a year, and for the entire lifetime, up to 22.5 million rubles.
This is a very good effect, and one would like to recognize PoC as successful. Let us, however, linger and analyze what could go wrong.
Risks affecting the economic effect
We received a positive effect by reducing the number of employees. We were able to reduce the number of employees by reducing the number of shifts. We were able to reduce the number of shifts due to their redistribution according to the predicted load. We were able to predict the load using modeling based on historical data.
First, if the patterns of using the products that our call center serves, change, the historical data will lose relevance. The chance that the patterns will not change over the next three years is quite small. It is necessary to lay the cost of additional training and correction of the model in the course of her life.
Secondly, we predicted the load fairly accurately, but, nevertheless, in 30% of cases we make more mistakes than by 20%. It may be that such an error during rush hours leads to an unacceptable increase in the waiting time. Supervisors will decide to create backup shifts to cover risks.
Thirdly, during PoC we only operated on shifts, but in reality it turns out that quite specific people work on shifts. For some reason, people cannot be simply dismissed and immediately recruited, and shifts for an employee need to be made taking into account the work schedule, the Labor Code and the personal wishes of the employee. Because of these factors will have to keep the staff a little more than the car wants.
In total, we need to lay backup shifts at peak times and maintain a bit of “ballast” during quiet weeks. And besides, we will need to lay the costs of maintaining the model.
It is time to talk about the costs and risks associated with them.
Development and maintenance, their cost and risks
In the course of the PoC, it became clear to us what needs to be done for the industrial implementation of the solution.
First, you need to build a stable data collection process. It turned out that we can quite easily get data from CRM. However, we had to collect data on the operators' schedule, bit by bit. So, we will first have to make an automated system for monitoring operator schedules. It’s a nice coincidence that we will also upload the results of the planning to this system. We estimated that it would take us a week or two to develop the unloading of CRM. Developing a system for managing a schedule will take about two months, and there is a risk that we were wrong in our assessment at times.
Secondly, we need to code the service that uses the model to predict the load, and then code the algorithm that makes up the schedule for this load. We have already taught the model itself how to apply it, approximately clearly - we will be able to pack it into service in about a week, maximum two. With the scheduling algorithm, it is more difficult, moreover, we can get bogged down in the implementation of constraints or not be able to bypass the combinatorial complexity. The development of the algorithm will take us from a couple of weeks to two to three months - the uncertainty is high.
Thirdly, all of this will require infrastructure - application servers, databases, balancers and monitoring. It is good that we are not doing this for the first time, and we know that it will take about a week. If nakosyachim with equipment, then two. Maintenance of the infrastructure will take from us one or two man-days a month, pffff! .. But in three years it will take up to a couple of full months, oh. In addition, it is necessary to lay out additional training and re-laying the model every six months - a total of 2-5 times, each time for 3-5 days.
Let us sum up the costs in optimistic, realistic and pessimistic variants.
Let the average developer cost the company 20 thousand rubles. in a day.
Optimistic - 5 days for CRM, 40 days for a schedule management system, 5 days for forecasting, 10 days for scheduling, 5 days for infrastructure, 3x12x0.5 days for its support, and 2x3 days for rare additional training of the model. Total 65 working days for development, 24 days for support. The total cost of the solution is 1.3 million rubles for development + 0.48 million rubles for support over 3 years.
Realistic - 10 + 60 + 10 + 20 + 10 + 3х12х1 + 5х3 = 110 developments and 51 supports, 2.2 + 1.02 million rubles.
Pessimistic is when things went wrong. 20 + 80 + 20 + 40 + 10 + 3х12х2 + 5х5 = 170 development and 97 support, 3.4 + 1,94 million rubles.
Note that about 40% of the cost goes to support, whatever one may say.
Assessment of ROI and project feasibility
With an optimistic estimate, we received 15% savings on labor, which led us to a savings of 22.5 million rubles for the life of the project, of which 7.5 million rubles fell on us in the first year. An optimistic estimate of expenses showed only 1.3 + 0.48 million rubles, which gives +6.2 million (+ 377% ROI) in the first year and +21 million rubles (+ 1160% ROI) during the lifetime. Divinely.
However, if at least some of the risks are realized, the situation will change. If it turns out that 50% of shifts fall on peak hours, and we want to maintain a 10% reserve, we will immediately lose 5% of the effect. Another 2.5% of the cost of inelasticity of the state - and now we have lost a total of 7.5% of the 15% effect. We receive only 3.75 million rubles of income per year, 11.25 million over the life span. This is a realistic income estimate.
We subtract from this a realistic estimate of expenditures - 2.2 million for development and 1.02 for support. We get + 55% ROI in the first year, + 252% for the life span. The result is still worthy, but the conclusion on implementation looks no longer so straightforward.
Now let's be safe and add a 20% reserve at peak hours. We lost another 5% of the effect, leaving only 2.5% of the cost reduction, or 1.25 million per year, 3.75 million over the life span. This is a pessimistic estimate of the effect, but the effect is still at least there. Now, with a realistic estimate of costs, the project does not pay off in the first year, and only on the horizon in 3 years a little goes to + 17% ROI. It seems to put money on deposit looks safer. Thus, with a realistic assessment of income and expenses, we can no longer afford a 20% reinsurance.
When implementing a pessimistic development scenario, the costs will amount to 3.4 million rubles in the first year. Acceptable ROI + 121% we get only in the rainbow event. On the horizon, 3 years will also pay off with a + 108% ROI "average" income scenario.
Thus, it is clear that it is realistic to expect from the ROI + 55% project in the first year and + 252% for the entire lifetime, however, we will have to severely limit ourselves in reserves. And if we are not confident in the competencies of our own development, then the project is better not to start at all.
| Revenue scenario | Expense scenario | Income | Dev | Support | ROI 1g | ROI 3g |
|---|---|---|---|---|---|---|
| Optim | Optim | 7.5 | 1,3 | 0.5 | + 4x | + 11x |
| Optim | Real | 7.5 | 2.2 | 1.0 | + 2x | + 6x |
| Optim | Pessim | 7.5 | 3.4 | 1.9 | + 85% | + 3x |
| Real | Optim | 3.75 | 1,3 | 0.5 | + 155% | + 5x |
| Real | Real | 3.75 | 2.2 | 1.0 | + 48% | + 2.5x |
| Real | Pessim | 3.75 | 3.4 | 1.9 | -7% | + 112% |
| Pessim | Optim | 1.25 | 1,3 | 0.5 | -14% | + 108% |
| Pessim | Real | 1.25 | 2.2 | 1.0 | -50% | + 17% |
| Pessim | Pessim | 1.25 | 3.4 | 1.9 | -69% | -29% |
PS Make your own or buy ready
A live manager would have studied alternative solutions before introducing PoC, but we have a speculative project, right? In addition, you cannot write an article about third-party closed solutions ...
There are dozens of solutions for call center management, they consist of a heap of modules, and many of them contain a WFM module, WorkForce Management. He does just what we have described - he makes a schedule, and sometimes even predict. Typically, a solution for a call center is sold all at once, both software and hardware. The entire workplace costs from $ 1000 to $ 2500. WFM modules are installed either immediately to the heap, or afterwards. Thus, in real life, the manager would follow the WFM solution to his call center vendor. Let's speculate a little, but is there any point in making a custom solution?
To begin with, there is a very important stop factor - what the outcome of the development will be, strongly depends on the competencies of the company. If the company is not confident in its developers and DS'ah, the probability of a pessimistic outcome is too great. In this case, you need to uniquely use the solution from the vendor. Just on the basis of this consideration, it’s just that all non-technological companies go along this path. Technology companies differ in that the strength of their team gives chances for an optimistic outcome. This is where the math begins.
Solutions from vendors are based on the cost of renting a workplace. According to our "realistic" estimate of income of 7.5%, we save 37.5 thousand rubles per year at one workplace. This is the maximum cost of the solution. If the solution is cheaper, it will bring positive ROI. With own development everything is more difficult - the payback depends on the number of operators. During the first year, a positive ROI is possible with the cost of operators at 26.66 million per year, which is achieved with 53 operators. Over three years, positive ROI starts from 27 operators.
When choosing a third-party solution, in addition to simple mathematics, two more factors should be taken into account.
First of all, these are risks. When you buy a solution, you will get something more or less working. When implementing the solution on your own, you still have a significant chance of failure.
Secondly, it is an asset. At the end of development, you get an asset that you can develop and refine. When renting or buying a license of your own asset, you do not receive.
What is important from this is up to you.
findings
- Ready WFM is already in any decent call center provider. Most likely, you collected a call center from scratch. To get the WFM module from your vendor is the best solution.
- If you do not have a proven development team and the date of Satanists - do not make your decision.
- If you are strong both there and here, then
Why do you even read this article?anyway, do not rush to rush into battle, but first check the viability of the idea with the help of PoC. - Add to the results of PoC'a more hopelessness and pessimism and honestly count, but is it worth it?
- If this did not stop you, wait for the continuation of the story on the author's telegram channel .