Mobile engagement analysis
On October 22, the American analytic company Flurry released another report on the study of user engagement. A naked translation of the article was already flickering on Habré , but we at the company decided to analyze it and in this post we will share the results.
According to the data obtained during the study of more than 230,000 applications registered in the system, an “involvement matrix” was built: all applications are divided into categories and rotated depending on the frequency of use per week and% of users who continue to use the application after 90 days.
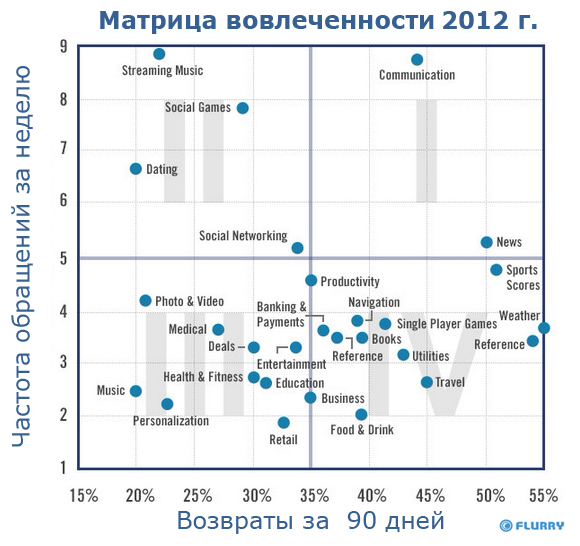
As can be seen from the table, the applications with the social component (social networks and multiplayer games, dating and various im-services) have the best indicators of engagement, which is not surprising. Depending on the type of application, American analysts even recommend the optimal type of monetization. So for applications with a high frequency of use, but with a small percentage of returns (quadrants II and III), these are paid applications and in-app purchases , and for applications with a high percentage of returns (I and IV) - an advertising model .
But even more interesting, in our opinion, is not these data themselves, but their comparison with the similar company report for 2009.
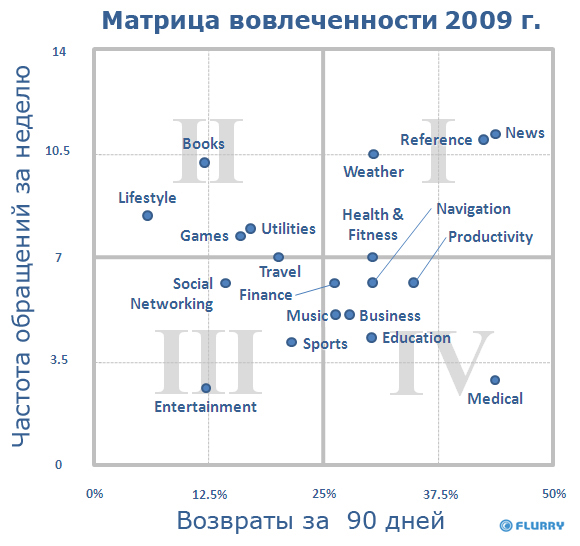
The first and main trend- This is a decrease in the frequency of use for almost all categories of applications. At the same time, users began to return to the application more often after a long period. So the number of users using applications from the Weather category for more than 2 months has increased 2 times, while the frequency of using the application for 1 week has decreased 3 times.
These data indicate an increase in the number of applications on the user's phone, as well as the departure of a large number of functions that were previously provided by individual applications inside social networks: this category of applications shows a large increase in the number of regular users who use the application almost daily. So according to recent information voiced by Mark Zuckerberg, 40% of Facebook users who access the site from a desktop computer return within a day. For users with mobile devices, this figure is already 70% .
Trend number two- An increase in the loyal audience of applications related to streaming data. So applications that provide access to streaming video or music show impressive results in frequency of use during the week. These results are due to an increase in the speed and availability of mobile Internet compared to 2009.
In conclusion, we can say that in the face of fierce competition and a constant increase in the number of applications on the market, the main emphasis should be on building a strategy to increase the loyalty of an existing audience and retaining the user.
Prepared according to: blog.flurry.com/bid/90743/App-Engagement-The-Matrix-Reloaded
According to the data obtained during the study of more than 230,000 applications registered in the system, an “involvement matrix” was built: all applications are divided into categories and rotated depending on the frequency of use per week and% of users who continue to use the application after 90 days.
As can be seen from the table, the applications with the social component (social networks and multiplayer games, dating and various im-services) have the best indicators of engagement, which is not surprising. Depending on the type of application, American analysts even recommend the optimal type of monetization. So for applications with a high frequency of use, but with a small percentage of returns (quadrants II and III), these are paid applications and in-app purchases , and for applications with a high percentage of returns (I and IV) - an advertising model .
But even more interesting, in our opinion, is not these data themselves, but their comparison with the similar company report for 2009.
The first and main trend- This is a decrease in the frequency of use for almost all categories of applications. At the same time, users began to return to the application more often after a long period. So the number of users using applications from the Weather category for more than 2 months has increased 2 times, while the frequency of using the application for 1 week has decreased 3 times.
These data indicate an increase in the number of applications on the user's phone, as well as the departure of a large number of functions that were previously provided by individual applications inside social networks: this category of applications shows a large increase in the number of regular users who use the application almost daily. So according to recent information voiced by Mark Zuckerberg, 40% of Facebook users who access the site from a desktop computer return within a day. For users with mobile devices, this figure is already 70% .
Trend number two- An increase in the loyal audience of applications related to streaming data. So applications that provide access to streaming video or music show impressive results in frequency of use during the week. These results are due to an increase in the speed and availability of mobile Internet compared to 2009.
In conclusion, we can say that in the face of fierce competition and a constant increase in the number of applications on the market, the main emphasis should be on building a strategy to increase the loyalty of an existing audience and retaining the user.
Prepared according to: blog.flurry.com/bid/90743/App-Engagement-The-Matrix-Reloaded