Zabbix as a security scanner
Hello! We all know and love products for the vulnerability assessment processes like Nessus , Qualys , Max Patrol and all other OpenVAS . One of the main tasks that they solve is to ensure control of versioned vulnerabilities.
This is a fairly simple process of comparing installed software versions to a range of “no known vulnerabilities”. Well, then the guys responsible for information security, together with the development and administrators decide what risks can be taken and what needs to be patched right today.
There are a lot of various tools to solve this problem, but all of them, from our point of view, have one common problem - they require a separate troublesome deployment and generate another tool with a root account in your infrastructure. But after all, for such a simple action as collecting information about installed packages of root is not needed! Yes, and usually in the infrastructure there are already deployed systems with the possibility of data consolidation, collaboration and remote execution of commands on servers. Therefore, we decided to make a tool that would allow, in a couple of clicks, deploy a Linux vulnerability monitoring system in our environment with minimal production changes.
What is deployed in most grocery systems? Of course, monitoring. And quite often it is Zabbix . So let's get to it and screw!
In one hand Zabbix
Everything is simple: a distributed agent system, dashboards for visualization, a multi-user access system, and the execution of actions according to specified criteria have already been done without us. We do not need to reinvent the wheel and do it all from scratch.
Zabbix has enough rights to get information about packages, where to put them too. It remains to combine them and send them to the Vulners API for analysis . And then process the resulting knowledge about vulnerabilities.
But let's start with a little introduction, what Zabbix can do and what we need to do.
Zabbix agents are installed on servers and allow:
- get a wide range of operating system metrics;
- run scripts and programs and get the result of their execution;
- execute any commands in a separate process (fork), independent of Zabbix agent processes;
- work with several Zabbix-servers at once;
- work behind the firewall, initiating a connection to the server or vice versa, waiting for incoming connections.
Zabbix server receives monitoring metrics as input and writes them into the database and performs further processing.
Analyzing the data and based on a fairly flexible logic, it can perform various actions:
- Send alerts through various channels (mail, sms, messengers, etc.);
- Connect to servers via SSH or IPMI and execute various commands on them;
- Or execute various corrective commands on servers using Zabbix agent connections to them;
The web interface is written in PHP and will allow you to display metrics collected by Zabbix, graphs, triggered alerts about problems, and commands and actions executed by the monitoring system.
Also through the web interface is administered Zabbix.
Zabbix API is a web based API and comes as part of a web interface. It uses the JSON-RPC protocol.
- Allows you to receive, create, configure and delete any objects in the monitoring system.
- Using the API, you can easily integrate the monitoring system with various external systems.
However, Zabbix knows nothing about vulnerabilities! But knows about them Vulners :)
In the other hand Vulners
- Vulnerability data aggregator from over 115 sources
- Convenient API for various scanning methods
- Displays data in a normalized, machine-readable form.
- It works very fast
- Allows you to correlate data from various sources.
We tried to integrate them with each other and this is what came out of it.
Zabbix Threat Control
This is an open source plugin for Zabbix, written in Python, which:
- Displays in the Zabbix web interface information about vulnerabilities found in your infrastructure.
- Shows the threat level of each CVSS vulnerability.
- And offers easily applicable ways to fix the found vulnerabilities.
CVSS is an open industry standard for assessing vulnerability criticality. In fact - 10 point scale.
The use of this technique allows to bring the vulnerabilities found in different systems and having different properties to a common denominator, which simplifies the prioritization of the problems found.
We told about this plugin at Zabbix Moscow Meetup . For those who do not like to read, but loves to watch - there is a video report.
Consolidate Vulnerability Information
The result of the plug-in in Zabbix is as follows:
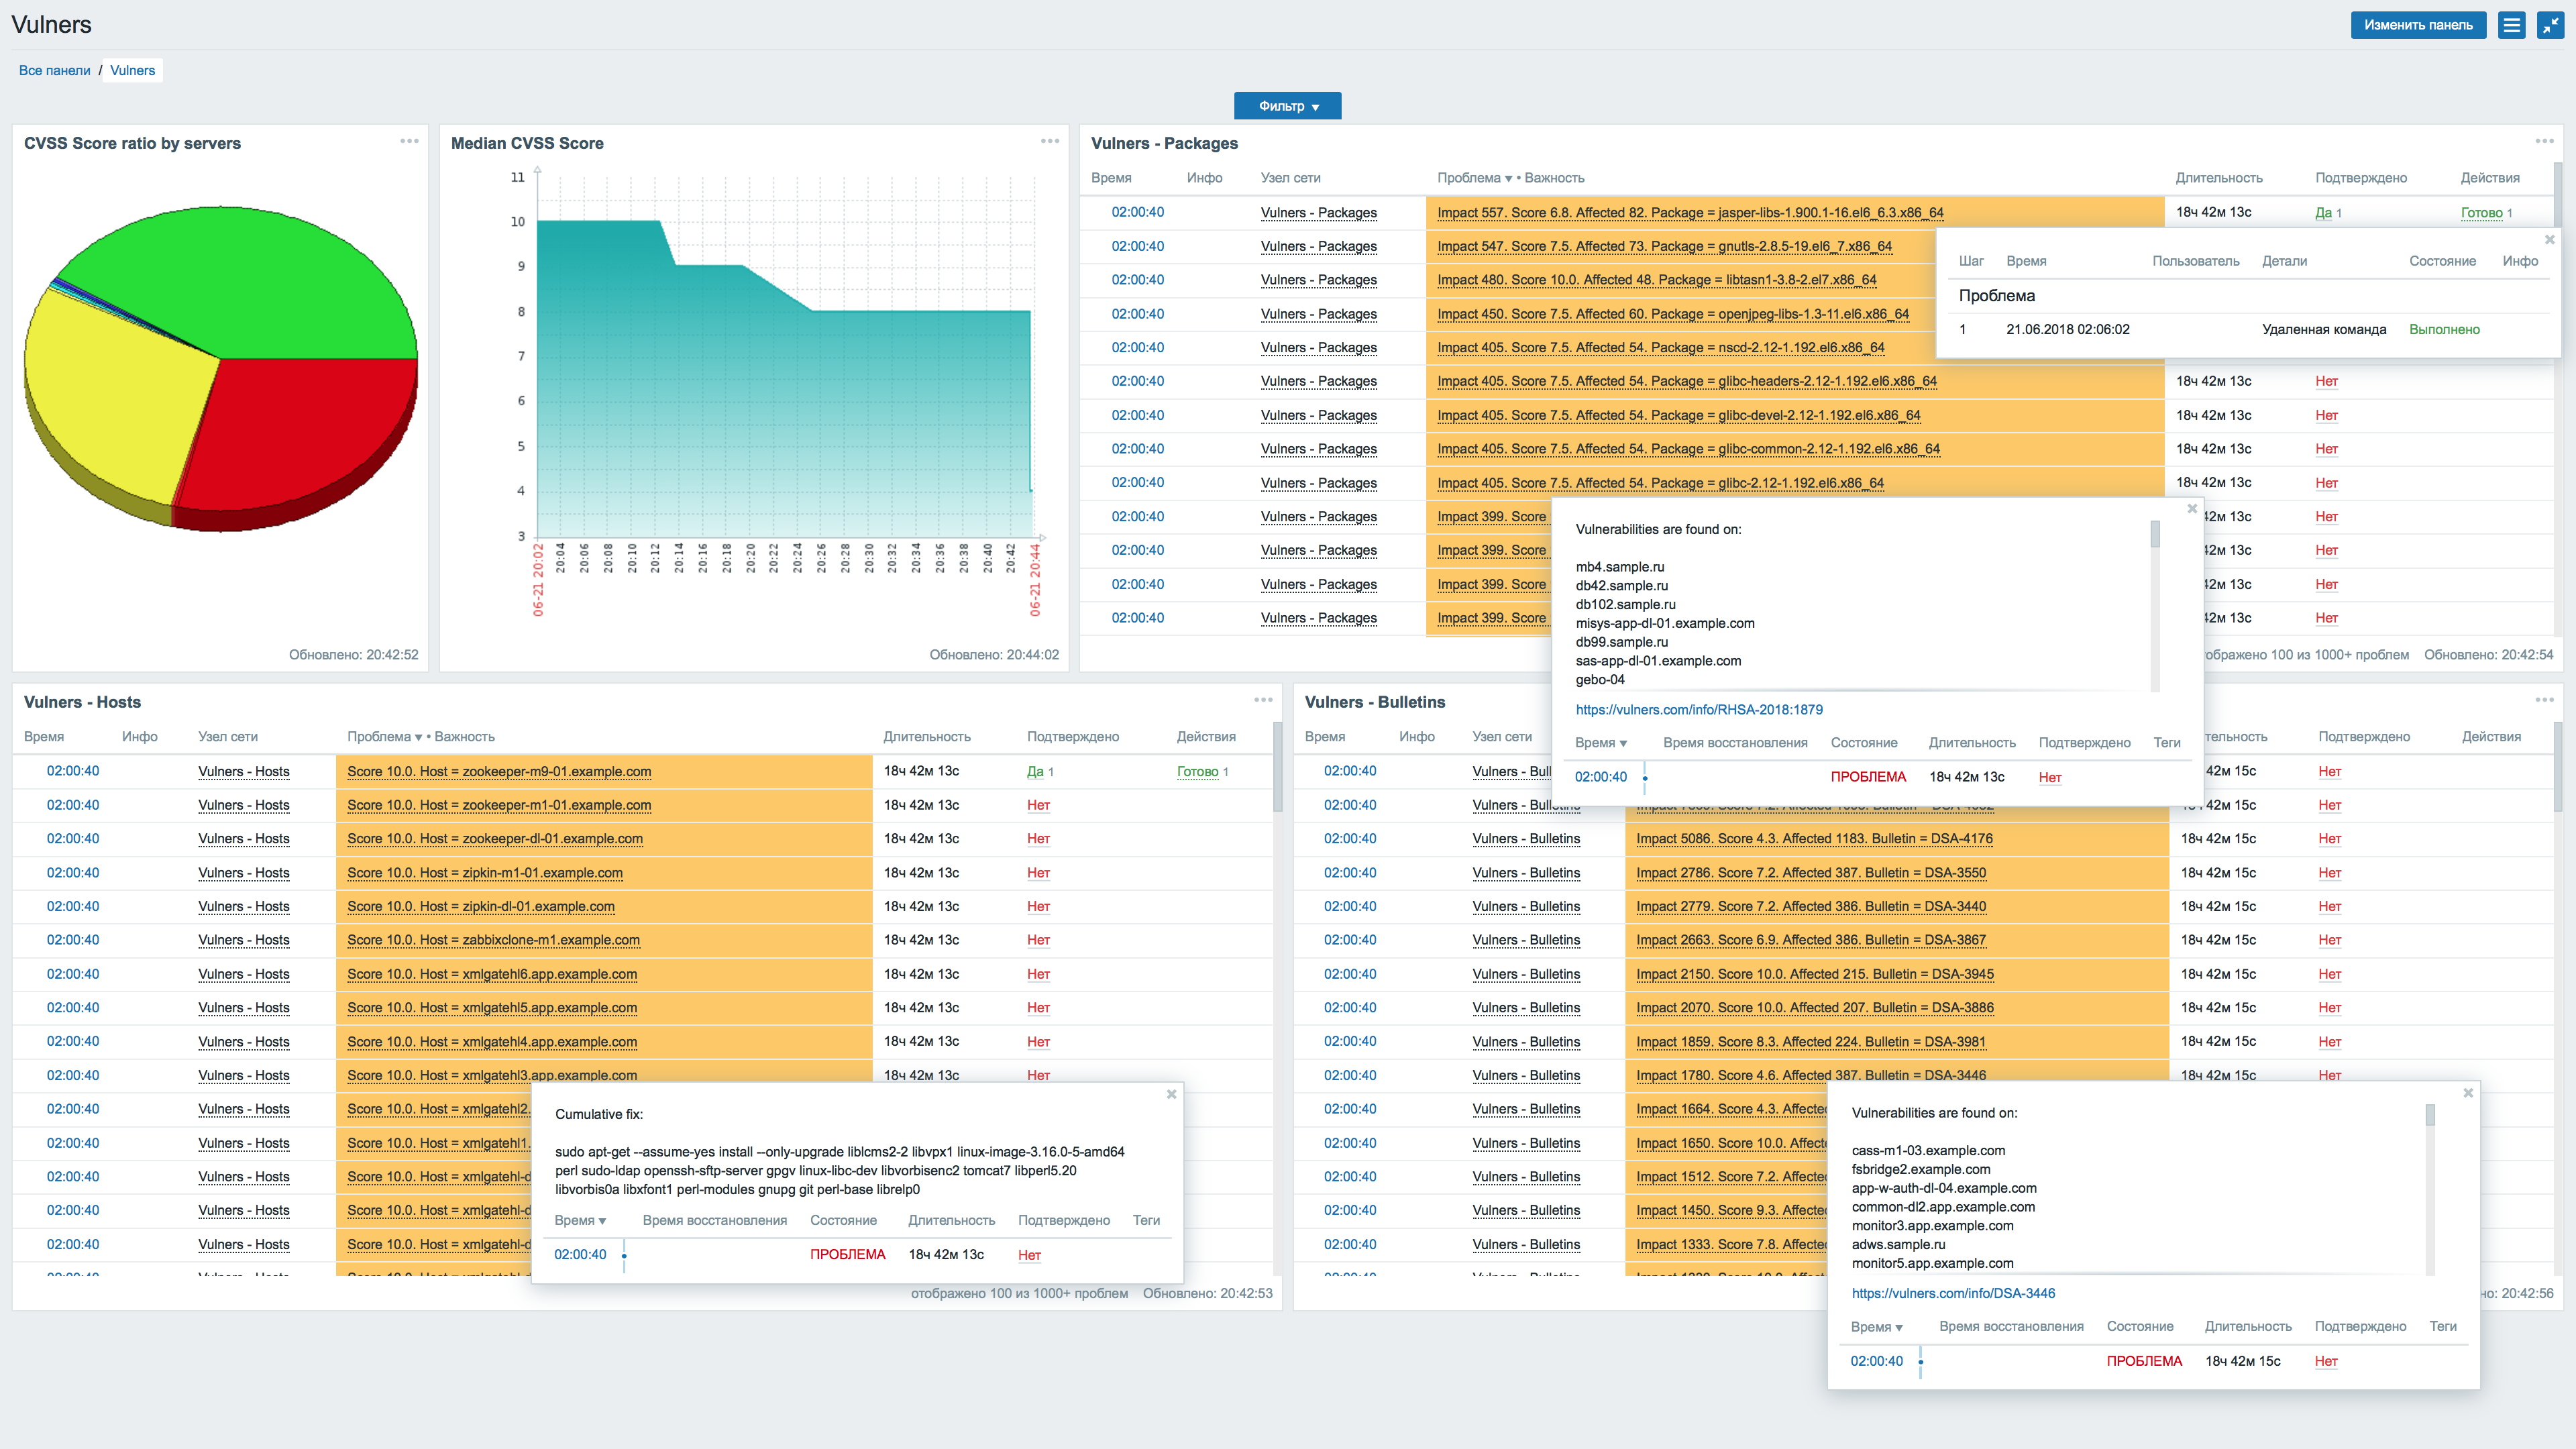
This is a dashboard in Zabbix. On which, from left to right, the following information is displayed:
- The distribution of CVSS-score servers. The pie chart shows the relationship - how many servers we have with critical vulnerabilities, how many have non-critical vulnerabilities, or do not have known vulnerabilities at all.
- The median CVSS score for the entire infrastructure. It is displayed as a graph, which allows you to observe the dynamics of its change.
- List of vulnerable packages with an index of the impact of vulnerability on the infrastructure.
- A complete list of vulnerable servers with a threat level for each of them.
- List of security bulletins that were “found” in the infrastructure.
Below is more detailed about the most interesting:
Information about vulnerable servers:
The panel displays a list of all servers with a vulnerability level above critical. The minimum acceptable severity level, after which the server begins to appear as vulnerable, is set in the plugin settings.
The following information is available for each server:
- Actually the name of the vulnerable server.
- Maximum CVSS server score. Displays the highest score of all found vulnerabilities for this server.
- The command to eliminate all detected vulnerabilities on this server. Having executed that, we will receive a server on which there are no known versioned vulnerabilities.
Data are sorted by CVSS, from maximum to minimum. This allows you to keep the server that requires the most attention, always at the top of the list, before your eyes.
The following panel shows vulnerable packages:
Here, for each vulnerable package in our infrastructure, we have a brief summary:
- The name of the vulnerable package.
- Vulnerable version of the package.
- The number of servers on which the vulnerable version of the package is installed.
- CVSS score for this version of the package.
- The index of the impact of this vulnerability on the infrastructure.
- A list of all servers on which the vulnerable version of the package has been found.
- Link to security bulletin. Allows you to read and understand how this vulnerability is critical in our situation.
- The team fixes the vulnerability in this package.
The data are sorted by impact index , from maximum to minimum.
Impact Index is the number of affected servers affected by the multiplied by the CVSS score of the vulnerability. It often happens that vulnerability with a not very high ball is much more common in the infrastructure, and therefore potentially more dangerous.
Choose vulnerability strategies
However, it is impossible to simply take and upgrade all packages on all servers to the latest version, which eliminates existing vulnerabilities.
In any infrastructure consisting of more than several servers, there are many limitations: the dependence of one software on the version of another, the risks of a violation of functionality, and so on.
Therefore, there is always a choice - which packages we can safely upgrade. Which packages need a separate work plan for the implementation of compensating measures. And for what we can take risks.
The approach proposed in the plugin allows you to choose the appropriate vulnerability elimination strategy:
- One vulnerability across the entire infrastructure: if any particular vulnerability is critical for you - the plug-in gives you information where in your infrastructure this vulnerability exists, and how it can be fixed immediately in the entire infrastructure.
- All vulnerabilities on a specific server: if you need to have a completely secure server, for example, located in the DMZ or outside the company's perimeter, using the plugin you will receive information on how to fix all the vulnerabilities found on it.
Fix found vulnerabilities
But it is not enough to know what vulnerabilities we have and determine how and which of them can be eliminated. It is also necessary to do it!
Such systems as Puppet or Ansible are widely used for centralized configuration management and software updates. You can use the fix-command that eliminates the vulnerability, and centrally execute it using such systems.
If your infrastructure does not use such systems, Zabbix Threat Control allows you to eliminate vulnerabilities directly from the Zabbix web interface.
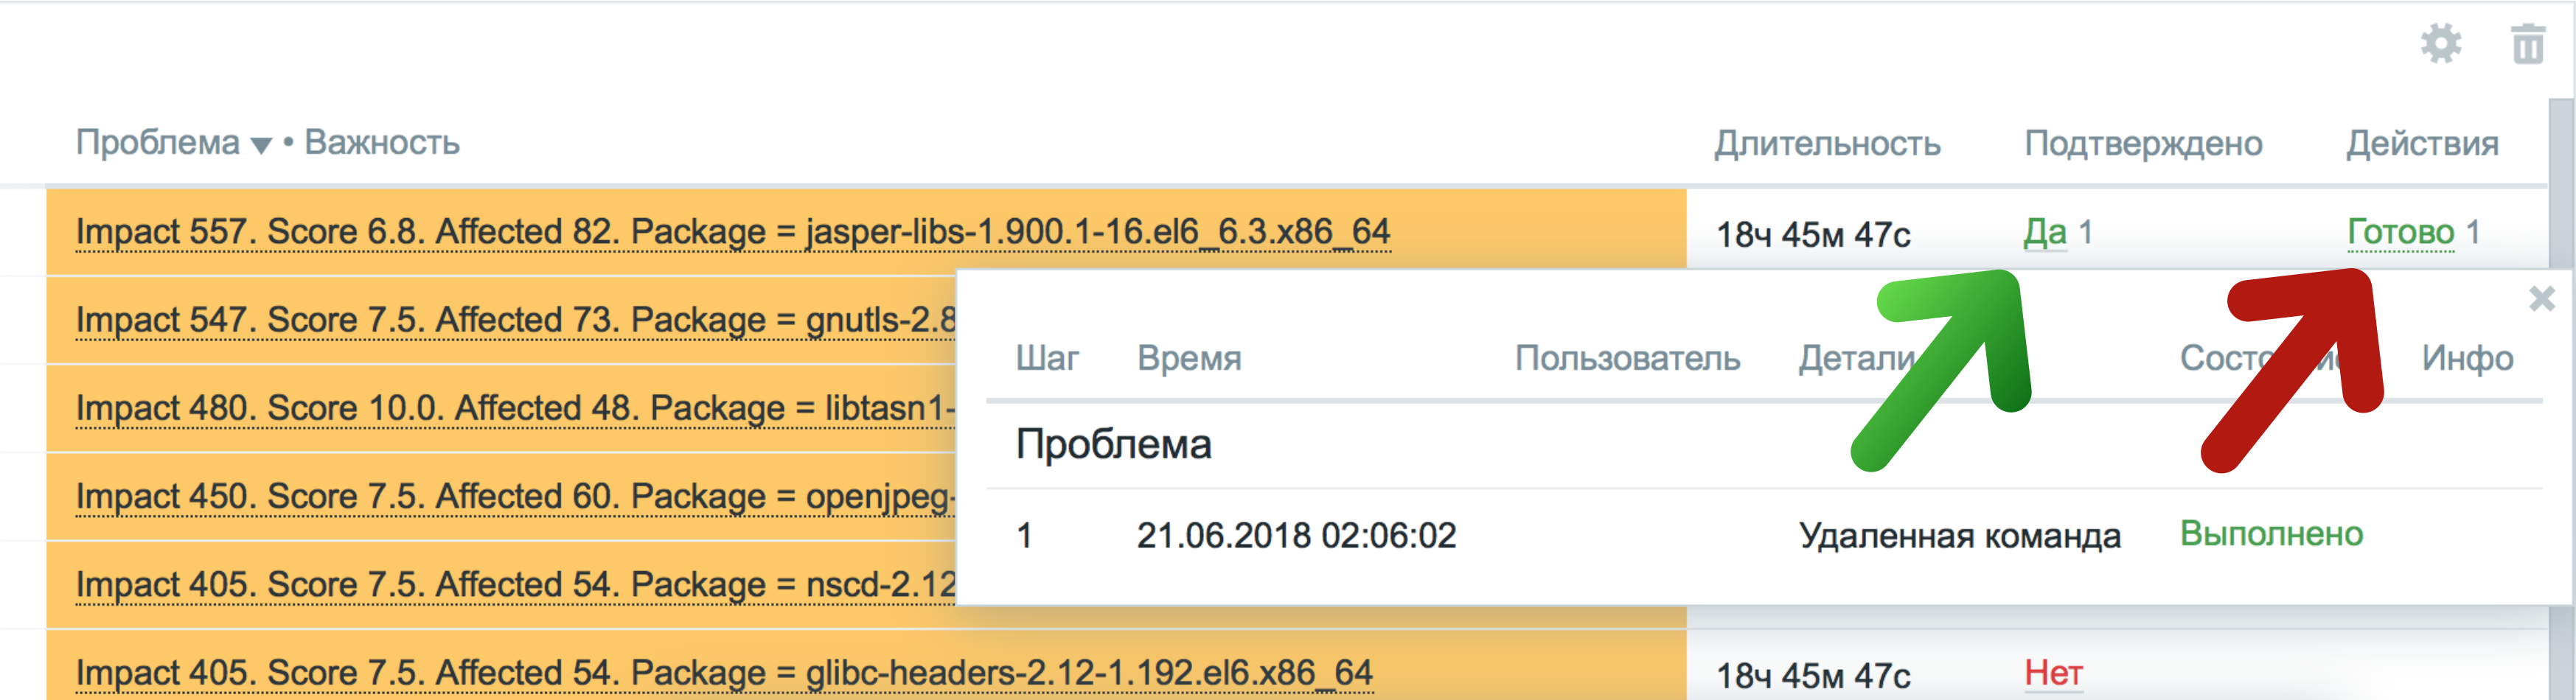
For this, the plugin uses standard Zabbix functionality: confirmation of events and execution of remote commands:
- As soon as the problem is confirmed via a web interface, an authorized user;
- A remote command will be launched that will execute the fix-command to fix the vulnerability on the target server or server list.
How it works
- Zabbix server receives through zabbix agents information about packages and the operating system of all servers in the infrastructure.
- The plugin (using the Zabbix API) receives the OS report previously collected by the Zabbix server. The plugin receives nothing directly from the servers. And at this stage there is no direct contact with them.
- After processing the information received from Zabbix, the plugin sends it to Vulners. From which, in response, receives a list of found vulnerabilities, their criticality and the way to eliminate
- The plugin processes the received data, aggregates it to generate statistics, and generates data packets for transmission to Zabbix.
- The plugin pushes data in Zabbix in the required monitoring system format. He does this with the zabbix-sender utility. After that, you already have in monitoring everything about the found vulnerabilities that are displayed on the previously shown dashboard.
- After confirming the problem, a remote command is executed, which transmits to the plugin:
- The name of the one who initiated it
- Fix-fix vulnerability
- Server list
- Having received all this Zabbix Threat Control:
- Verifies that the patch command is initiated by who you want. From the one who is not needed - he does not accept the command :)
- Executes the command transferred to it on the necessary number of servers.
By default, the plugin sends a fix command to vulnerable servers using the zabbix-get utility, accessing the Zabbix agent on the target server with the parameter nowait. This connection method allows the package update process to run in the background and not be tied to the zabbix agent processes. It is also possible to execute a command on the target server through a simple SSH connection. The way of execution of fix-commands is chosen by the option in the plugin configuration file.
And as a result of the work - the lack of vulnerable servers, your peaceful sleep and good mood :)
Installation
We told what Zabbix Threat Control is , why it is needed and how it works. Now we will tell you how to install and configure it!
Dependencies
To work, the plugin does not require anything supernatural. It is necessary that the Zabbix server , on which we set the plan, was the following:
- zabbix v3.4 for using custom dashboards (they appeared only in this version).
- zabbix-sender is needed to send vulnerability data to the monitoring system.
- zabbix-get to send fix-fixes for vulnerabilities to servers.
- python v3 with modules: pyzabbix, jpath, requests to run the main scripts of the plugin.
On all servers for which scanning for vulnerabilities is required, only:
- zabbix-agent to collect data and run scripts.
- python v2 to run the script that collects the OS report.
Installing a plugin from packages
First, we connect the repository with packages:
RPM distributions
rpm -Uhv https://repo.vulners.com/redhat/vulners-repo.rpmDEB distributions
    wget https://repo.vulners.com/debian/vulners-repo.deb
    dpkg -i vulners-repo.deb
After that, on the Zabbix server, we install the main package, which provides all the logic of the plug-in and the package that generates OS reporting:
RPM distributions
yum install zabbix-threat-control-main zabbix-threat-control-hostDEB distributions
apt-get update && apt-get install zabbix-threat-control-main zabbix-threat-control-hostAnd on all other servers that require scanning for vulnerabilities, we install a package that forms OS reporting:
RPM distributions
yum install zabbix-threat-control-hostDEB distributions
apt-get update && apt-get install zabbix-threat-control-hostInstallation from source
If you prefer to install from source, then this is also very simple:
On the Zabbix server, we install the main scripts that provide all the logic of the plug-in and the script that forms the OS reporting:
    git clone https://github.com/vulnersCom/zabbix-threat-control.git
    # main
    mkdir -p /opt/monitoring/zabbix-threat-control
    cp zabbix-threat-control/ztc* /opt/monitoring/zabbix-threat-control/
    chown -R zabbix:zabbix /opt/monitoring/zabbix-threat-control
    chmod 640 /opt/monitoring/zabbix-threat-control/ztc_config.py
    touch /var/log/zabbix-threat-control.log
    chown zabbix:zabbix /var/log/zabbix-threat-control.log
    chmod 664 /var/log/zabbix-threat-control.log
    # host
    cp -R zabbix-threat-control/os-report /opt/monitoring/
    chown -R zabbix:zabbix /opt/monitoring/os-report
On all other servers for which scanning for vulnerabilities is required, we put only a script that forms OS reporting:
    git clone https://github.com/vulnersCom/zabbix-threat-control.git
    # host
    mkdir -p /opt/monitoring/
    cp -R zabbix-threat-control/os-report /opt/monitoring/
    chown -R zabbix:zabbix /opt/monitoring/os-report
Customization
After installation, you must configure the plugin and prepare a monitoring system for its operation. Next step by step description of all necessary actions.
We configure the servers demanding scanning
You need to allow the Zabbix agent to execute remote commands. To do this, on all servers that require scanning, change the parameters in the zabbix-agent configuration file as shown below:
EnableRemoteCommands=1
LogRemoteCommands=1
The zabbix agent configuration file is usually located here: /etc/zabbix/zabbix_agentd.conf
If you want to use the functionality to fix the found vulnerabilities using Zabbix Threat Control , you need to allow the zabbix user to update packages (but not to install or remove them).
To do this, add the following line to the file
/etc/sudoers:For RPM distributions, the line looks like this:
zabbix ALL=(ALL) NOPASSWD: /usr/bin/yum -y update *For DEB distributions, a little bit different:
zabbix ALL=(ALL) NOPASSWD: /usr/bin/apt-get--assume-yes install --only-upgrade *Connect to Vulners
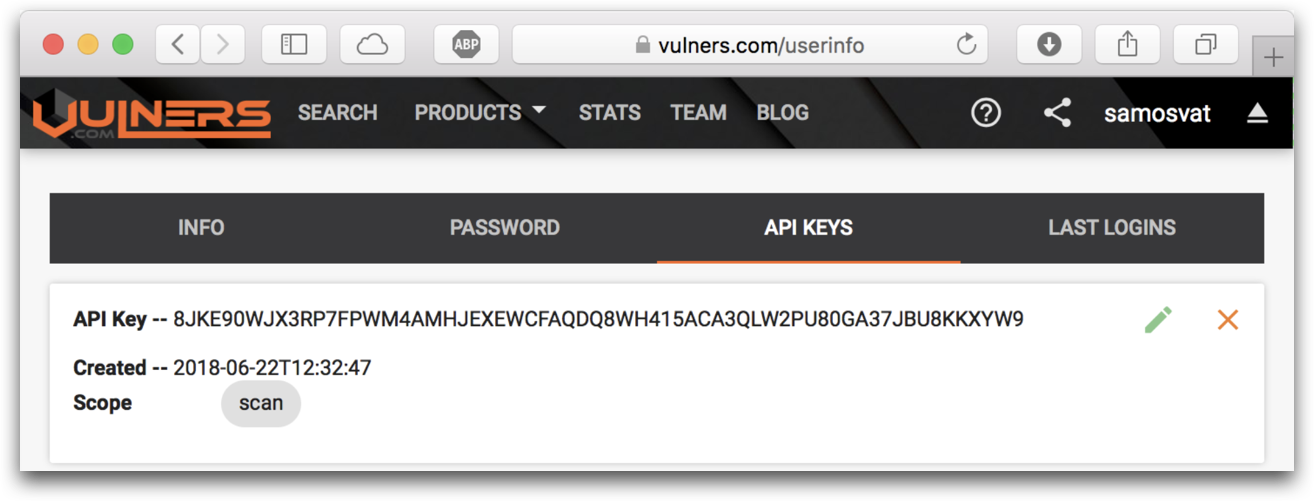
To use the Vulners API, you need an api-key. To get it:
- Sign up at vulners.com
- In your account, go to the API KEYS tab
- Select "Scan" in the Scope area and click "GENERATE NEW KEY".
You will receive an api-key that looks like this: RGB9YPJG7CFAXP35PMDVYFFJPGZ9ZIRO1VGO9K9269B0K86K6XQQQR32O6007NUK
Now you need to add the Vulners api-key to the plugin configuration file. /opt/monitoring/zabbix-threat-control/ztc_config.py
Example:
vuln_api_key = 'RGB9YPJG7CFAXP35PMDVYFFJPGZ9ZIRO1VGO9K9269B0K86K6XQQQR32O6007NUK'Connecting to Zabbix
In order for the plugin to connect to Zabbix, you need to specify the following data in the configuration file: /opt/monitoring/zabbix-threat-control/ztc_config.py
- Zabbix web interface address for working with Zabbix-API;
- Username and password of the user, under which we will connect to Zabbix API.
Zabbix server domain name and port for sending data using zabbix-sender utility.
Example:
zbx_pass = 'yourpassword'
zbx_user = 'yourlogin'
zbx_url = 'https://zabbixfront.yourdomain.com'
zbx_server_fqdn = 'zabbixserver.yourdomain.com'
zbx_server_port = '10051'
Preparing Zabbix
It is necessary to create objects in Zabbix that ensure the operation of the plugin. To do this, run the script /opt/monitoring/zabbix-threat-control/ztc_create.py. The script will verify that the plugin is configured correctly and using the API will create in Zabbix:
- The host group to which the hosts that map the vulnerabilities will be added.
- The template by which an OS report is collected from all servers.
- Hosts for displaying vulnerabilities for packages, servers, bulletins and general statistics.
- Action to execute remote vulnerability fix commands.
- Dashboards for easy display of all this information.
After creating all objects in Zabbix, the script will show:
- A link to a created dashboard in Zabbix, on which vulnerabilities will be displayed.
- The time when the infrastructure scan for vulnerabilities will be launched.
After all the necessary objects have been created in Zabbix, you need to go to the Zabbix web interface and link the "Vulners OS-Report" template just created by the script with all those servers that require scanning for vulnerabilities.

After that, it remains to wait for the plug-in to start at the time specified during the installation.
We scan!
The main data processing script ( ztc.py) is launched automatically, once a day, through the "Service Item ..." on the "Vulners - Statistics" host at the time specified by the script.
You can change the start time of the plug-in to whatever you like by changing the "Scheduling interval" in this data element. At the same time, it is necessary to correct the statistics collection time in the three data elements of the template "Vulners OS-Report" - metrics in the template should trigger 10 ... 15 minutes earlier than the main metric "Service Item ..." on the host "Vulners - Statistics".
The time during which all vulnerability data will be processed depends on the number of servers in the infrastructure and the number of packages installed on them. Approximately 30 minutes are spent for processing 1 thousand servers.
Plans
This is only the first version of the Zabbix Threat Control plugin. And we continue its development.
In the plans:
- Add to dashboard information found on the CVE infrastructure.
- Refuse to install any scripts on agents and collect all the necessary information about the OS and packages using the data item keys embedded in the Zabbix agent.
And since it opensource - join! Pull requests welcome :)