Do It Yourself Java Profiling
At the last Appication Developer Days conference , Roman Elizarov ( elizarov ) talked about how to profile, i.e. to investigate the performance of any Java-based applications, without the use of specialized tools, whether they are vendor-style or open-source, it turns out that you can use little-known features built into the JVM (threaddumps, java agents, bytecode manipulation), and quickly and efficiently implement profiling, which You can run it constantly even on the combat system. Here is the video report (here it is clumsy, but it is 1280x720, everything is perfectly readable):
But I also suggest that you take a look at the 70K text of the illustrated article-transcript under the cut, compiled by me from video and slides.
 Today I will have a report on "Do it yourself profiling in Java." Slides will be in English, I will do the report in Russian. There are very, very many slides, but not so much time, so I’ll skip some very quickly, and try to leave more time at the end for questions, and maybe even somewhere in the middle. In principle, do not be shy if you suddenly want to ask or clarify something, or even interrupt me. I’d better explain in more detail what you are interested in than simply telling what I wanted to tell.
The report is based on real experience. We have been working in the company for more than ten years to create complex, very high-loaded financial applications that work with large amounts of data, with millions of quotes per second, with tens of thousands of users online, and there, with such work, we always talk about profiling an application.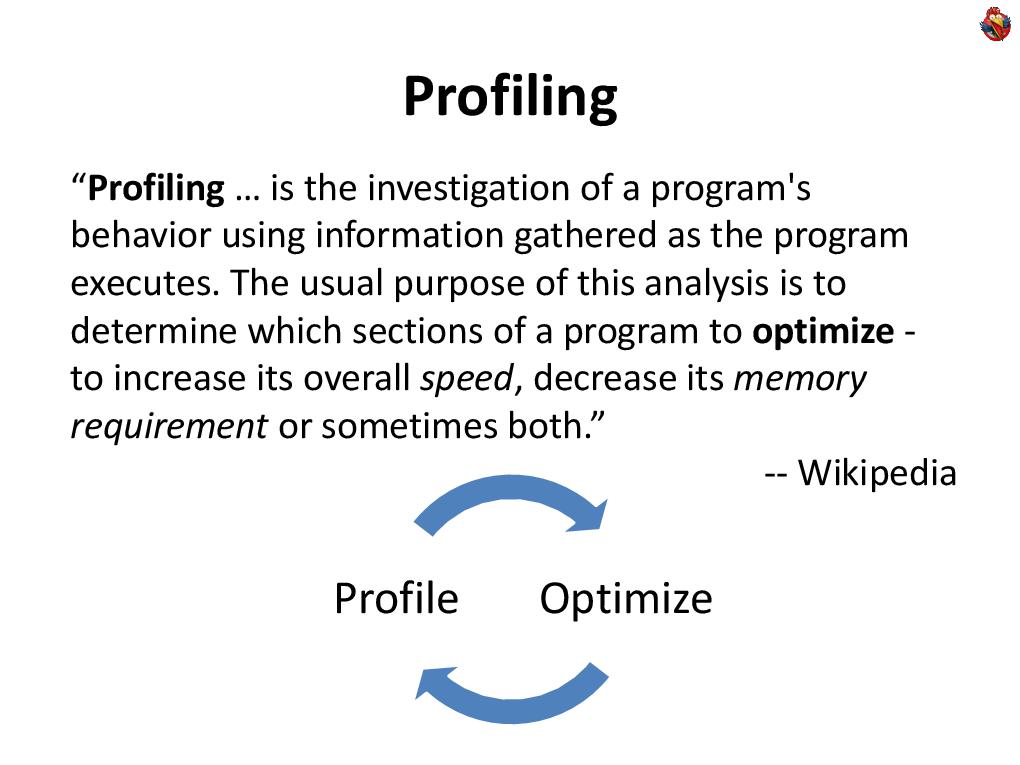 Application profiling is an inevitable component of any optimization; optimization without profiling is impossible. You profile, find bottlenecks, optimize-profile, this is a constant cycle.
 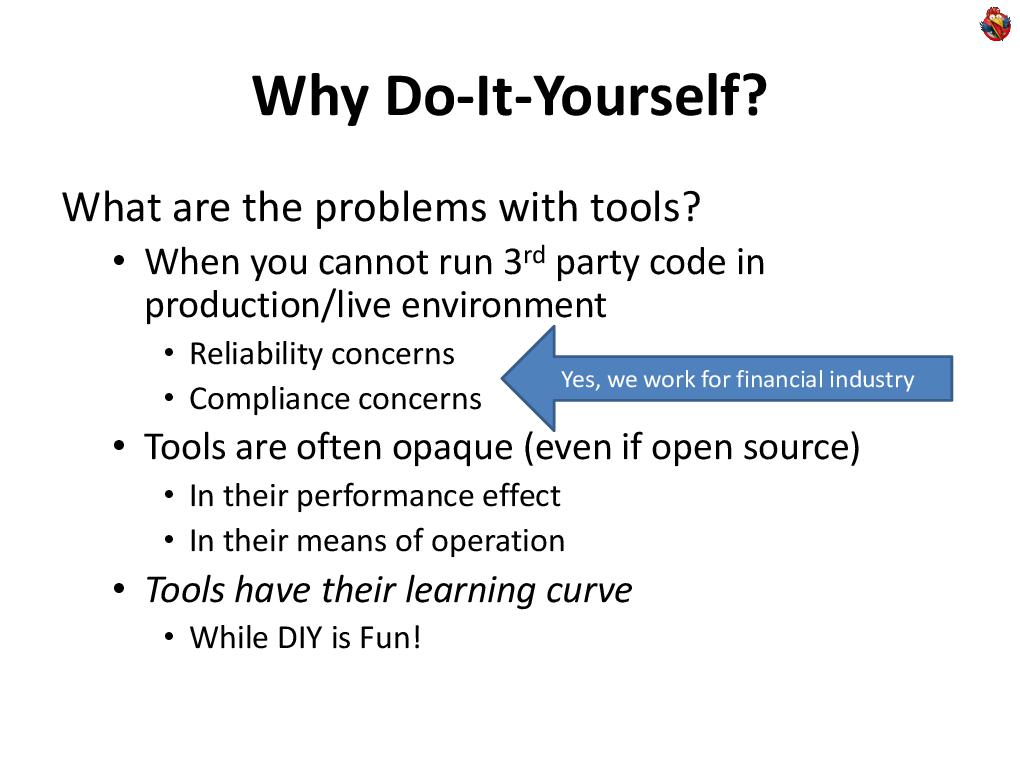 Why is the report called “Do It Yourself Java Profiler”, why do something yourself? There are a huge number of off-the-shelf tools that help to profile - actually profilers, and similar tools.
But the fact is that, firstly, there may be a problem with a third-party tool. You simply for some reason - reliability or security, may not be able to run a third-party tool on some kind of living environment. And unfortunately, it is often necessary to do profiling not only on a test platform, but also on a live platform, and not always for a highly loaded platform, you have the opportunity and resources to make an identical copy of the system and run under the same load. And many bottlenecks can be revealed only under heavy load, only under very specific conditions. You see that the system is not working properly, but you do not understand why. What kind of load pattern needs to be created for it so that the problem manifests itself - therefore, it is often necessary to profile a live system.
When we write financial applications, we still have a task to ensure the reliability of the system. And we do not do “banks”, where the main thing is not to lose your money, but which may not be available for hours. We make brokerage systems for online trading, where the availability of systems is always 24 × 7, this is one of their key qualities, they should never fall.
And I have already said that the entire industry is regulated, and sometimes we can’t use a third-party product on a real system.
But tools are often opaque. Yes, there is documentation that describes the “what”, but it does not describe how he gets these results, and it is not always possible to understand what he actually intended.
And even if the tool is open source, it does not change anything, because there is a lot of this code, you will kill a lot of time understanding it. Tools need to be learned, and to do something yourself, of course, is much more pleasant. What is the problem with learning? Naturally, if you use some kind of tool often, then it is worth learning it. If you program every day in some development environment you love, you know it far and wide, and this knowledge, of course, pays off a hundredfold.
And if you need to do something once a month, for example, once a month you need to do profiling for a performance bug, then it is not a fact that learning the appropriate tool will pay off. Of course, if there is no situation when the tool solves the problem many times faster.
Doing something with your own hands, you can reuse your knowledge. For example, you have knowledge of programming languages, your tools, you can deepen, expand, clarify them by studying the tools that you already have, rather than learning new ones.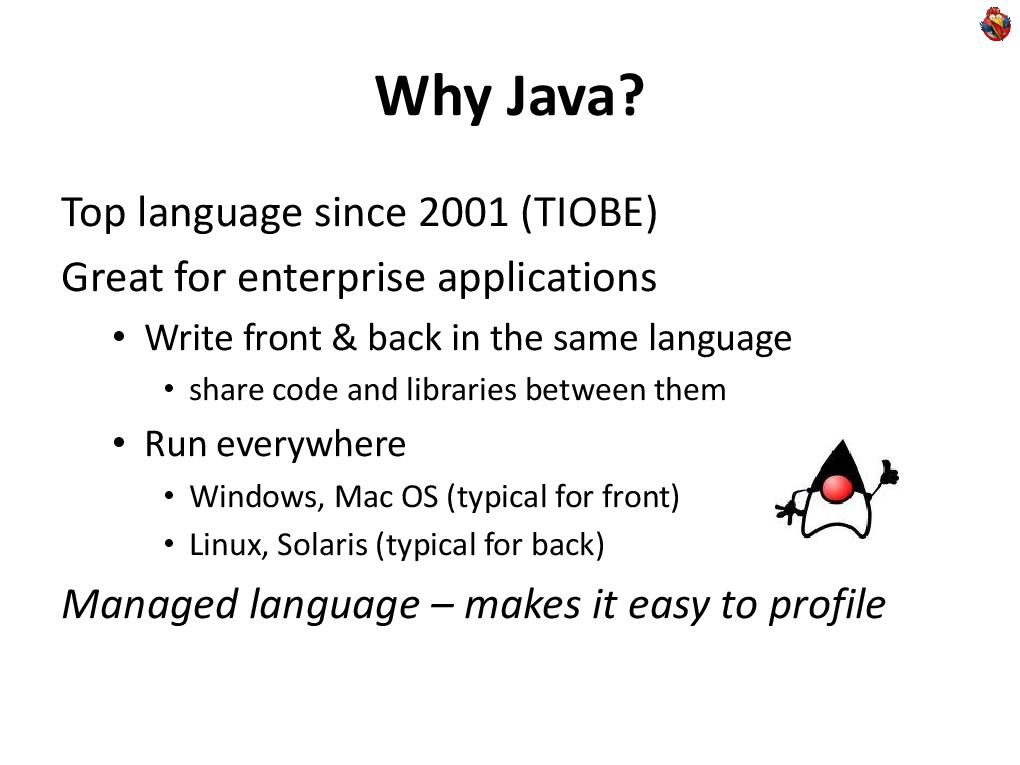 Why report on Java? Well, not only does our company program in Java, it is the leading language of the year 2001 by the TIOBE index, and is great for enterprise applications. And for this particular lecture, it’s generally wonderful - because Java is a managed language that works in a virtual machine, and profiling in Java is very easy.
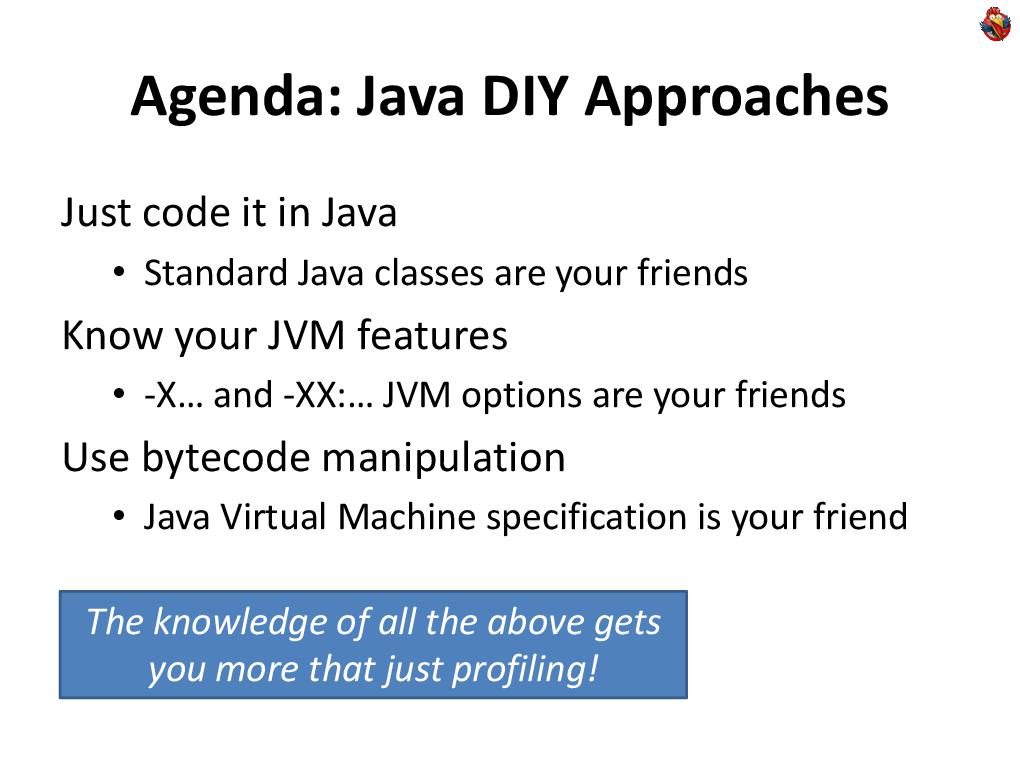 First of all, I will talk about how to solve many profiling problems by writing some code in Java. I’ll tell you about the capabilities of Java machines that you can use, and talk about a technique such as byte code manipulation.
 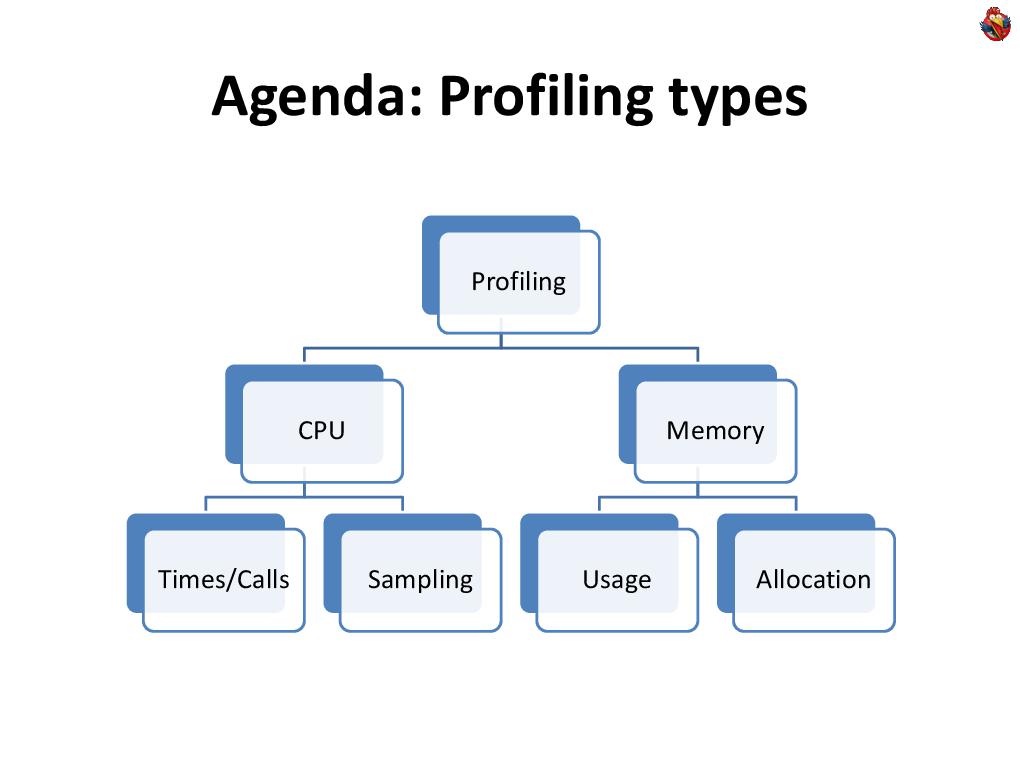 Today we look at the profiling of both the CPU and memory. I will talk about different techniques.
  CPU profiling. The easiest way is to simply take and program. If you need to figure out where, how much, what, in your program it takes time, and how many times it is called, then the easiest way is this: you do not need any tools, nothing - just write a few lines of code.
Java has a wonderful function called “currentTimeMillis” that returns the current time. You can measure it in one place, measure it in another, and then you can calculate how many times this is done, the total time, the minimum and maximum time, anything. The most such simple way. DIY at its maximum simplicity and primitivism.
Oddly enough, in practice, the method works great, it brings a bunch of benefits - because it is fast, convenient and efficient. When does this method work well? This works great for business methods - the business method is large, it is not called very often, and you need to measure something about it. Moreover, having written this code, since you wrote it - it becomes part of your application and part of the functionality. More or less, any modern large application contains management interfaces, some statistics, ... and in general, application performance is one of three things that you often want to see the application displaying about itself, simply as part of its functionality.
In this sense, programming an application to profile itself is a logical step. You increase the functionality of the application, profiling the application becomes part of its functionality. Especially, if in this way you place the definitions in your business methods that the end user calls, then this information will also be meaningful to the end user. How many times and what methods were called, how much time worked out, and so on. The information that you collect, in this case, with this approach, is completely under your control. You can measure the number of calls, minimum time, maximum time, average count, you can build histograms of the distribution of runtime, count medians and percentiles. You can track different execution paths in code differently, as in this example,This is possible if you write this code yourself, collect statistics, and embed yourself in your application. 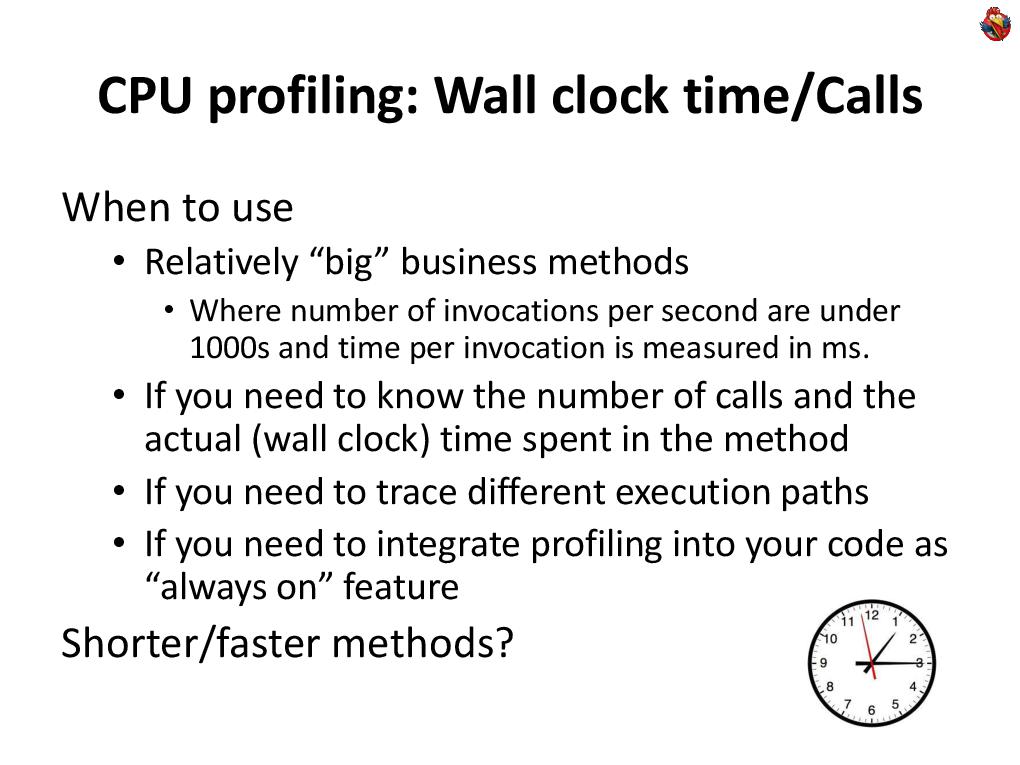 Moreover, to you, as a person who is involved in the profiling-optimization cycle, you then use this information - what happens in your application? This information is always inside your application, the code runs on a live system. You had some unlucky day, something the system didn’t work like that, you can look at the statistics in the logs, figure it out, and so on.
Wonderful technique, there are no third-party tools, just a little bit of code in Java.
What to do if the methods are shorter and are called more often?
The fact is that such a direct method is no longer suitable, because the "currentTimeMillis" method is not fast, and only measures in milliseconds.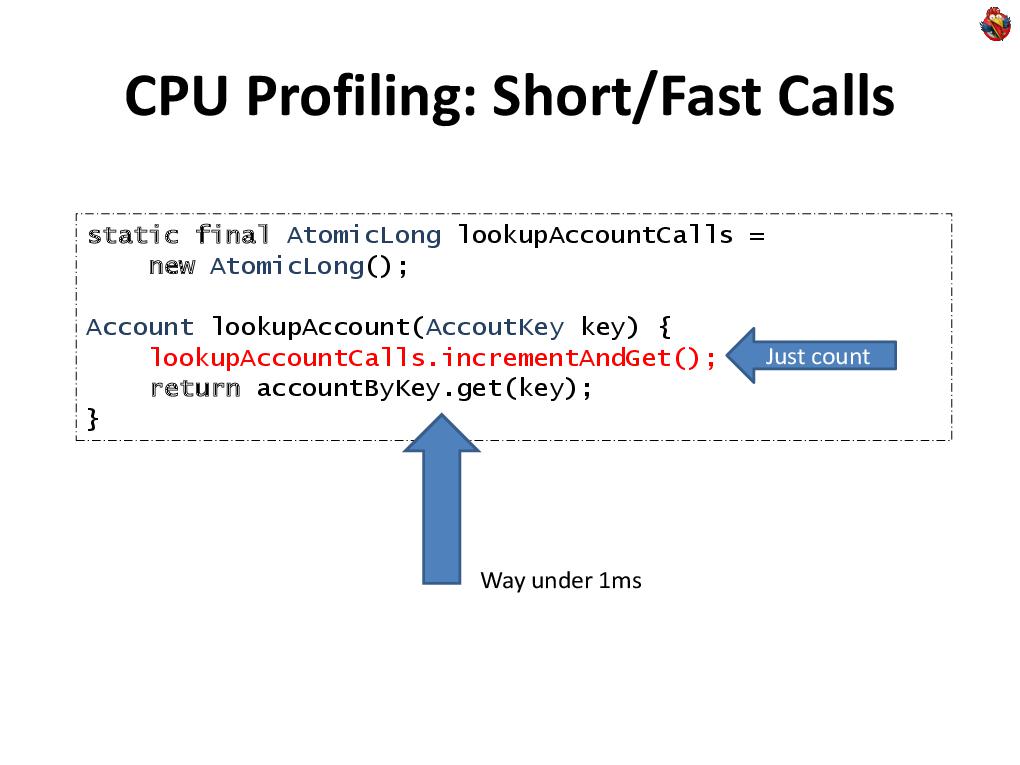 If you need to measure only the number of calls, then quickly enough you can do this using the Java class “AtomicLong”. With it, you can, by making a minimal contribution to performance, calculate the number of calls of any method that interests you. This will work up to tens of thousands of calls per second, without greatly distorting the operation of the application itself.
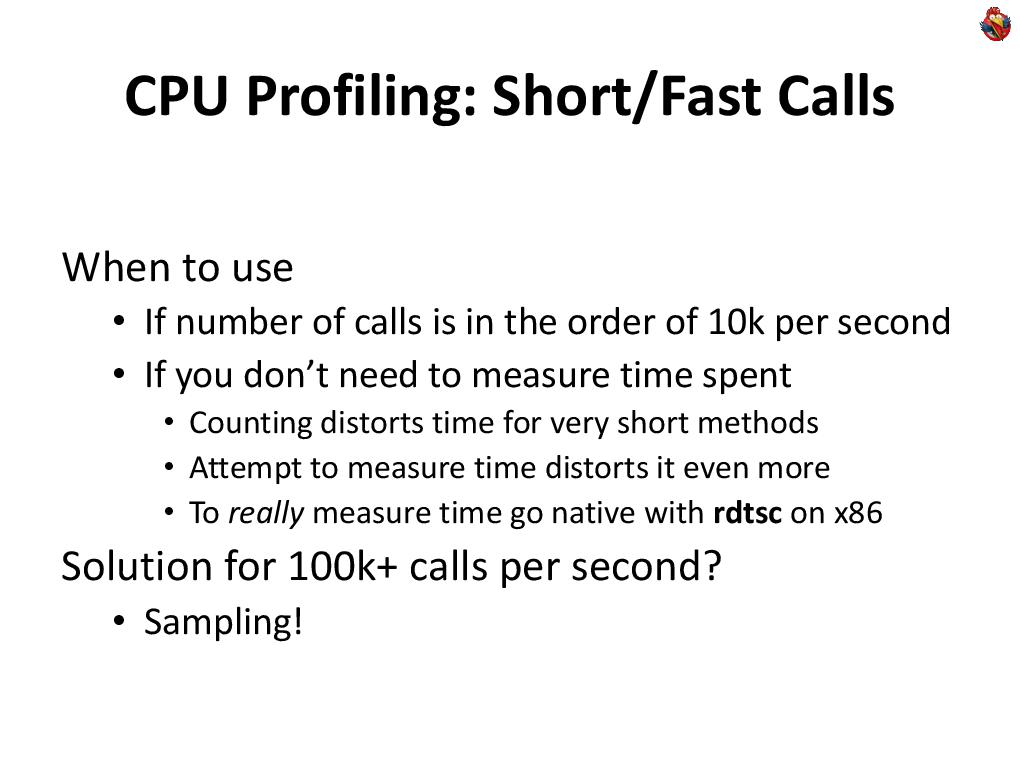 What if you still need to measure the runtime? Measuring the execution time of short methods is a very complex topic. It cannot be solved by standard methods, despite the fact that Java has the “systemNanoTime” method, it does not solve these problems, it is slow by itself, and it is difficult to measure something fast with it.
The only real solution is to use the native code, there is such a wonderful rdtsc instruction for the x86 processor, which returns the processor clock count. There is no direct access to it; you can write a single-line method in C that calls “rdtsc”, and then link it to Java code and call it from Java. This call will take you a hundred cycles, and if you need to measure a piece of code that takes a thousand or two cycles, then it makes sense if you are optimizing each machine cycle and you want to understand “plus or minus”, “faster-slower ", How do you work. This is a really rare case when you need to optimize every measure.
Most often, when it comes to some shorter pieces of code, and more often called, they use a different approach, which is called "sampling". Instead of accurately measuring how many times and what is called, you periodically analyze the program’s execution, see where it is executed, at arbitrary points in time, for example, once a second, or once every ten seconds.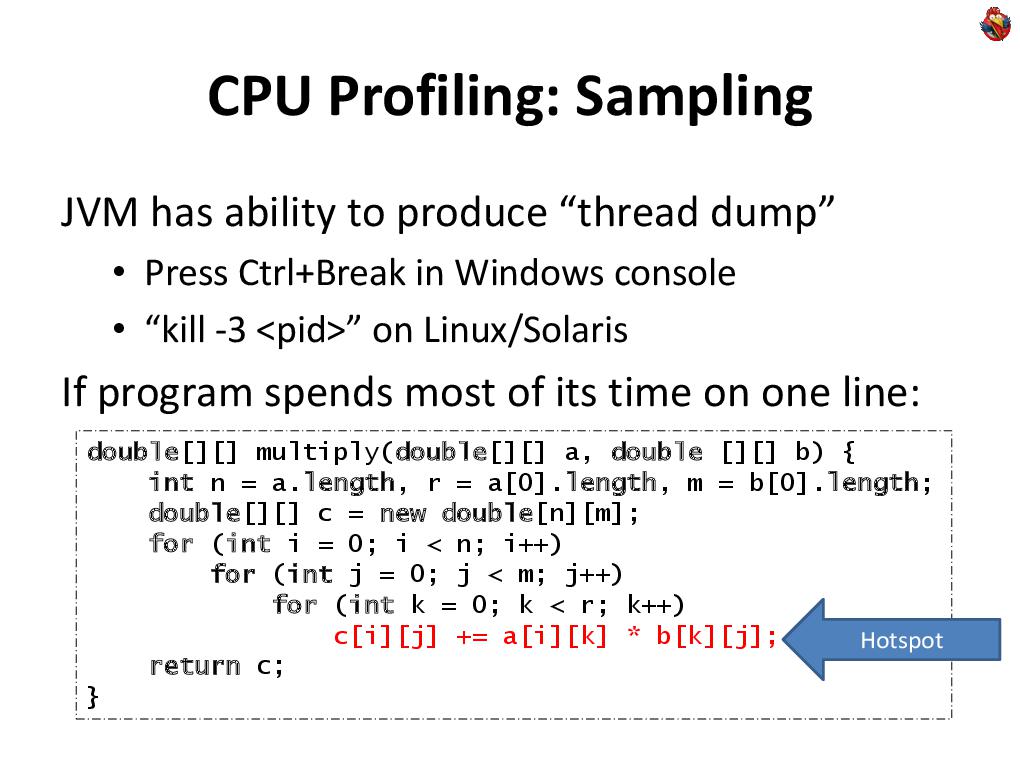 See where the execution takes place and see where you often find your program. If your program has a line in which it spends everything, or at least 90% of its time, for example, some cycle, and there, in the depths, some line, then most likely, when you stop execution, you in this line and catch.
Such a place in the program is called a “hot spot”. It is always a great candidate for optimization. Which is cool - there is a built-in function called “thread dump” to get a dump of all threads. On Windows, it is done by pressing CTRL-Break on the console, and on Linux and other Unixes this is done by sending a third signal, the “kill -3” command.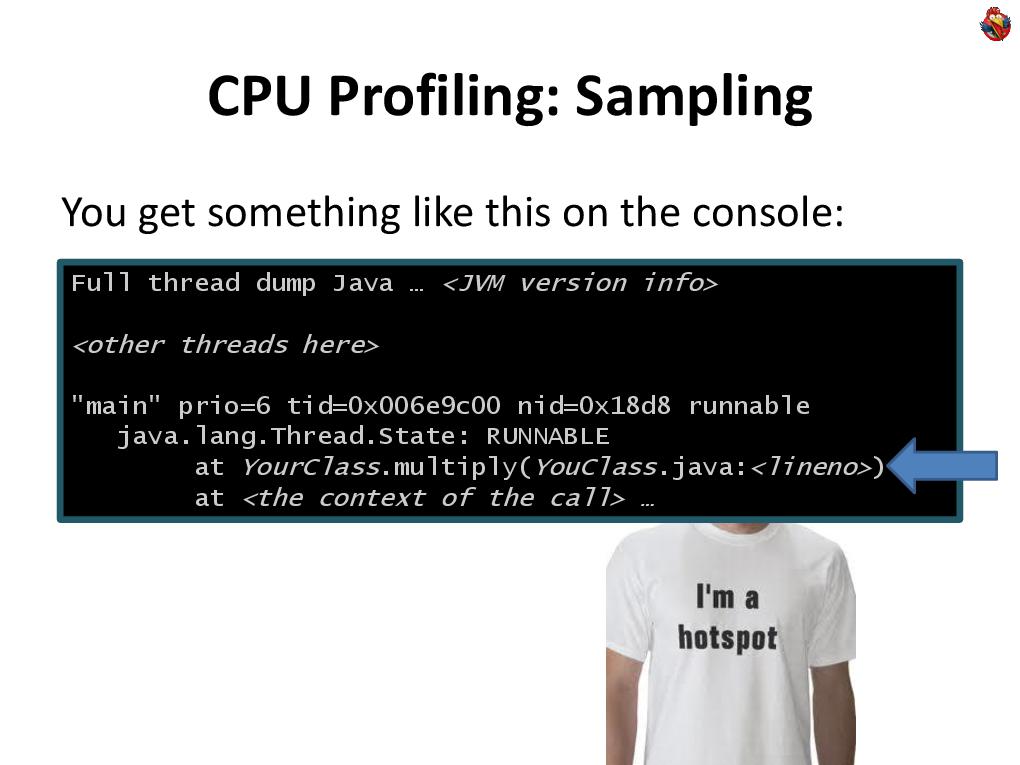 In this case, the Java machine displays a detailed description of the status of all threads on the console. And if you really have a hot spot in the code, then most likely you will find the program there. Therefore, again, when you have a performance problem with the code, you don’t have to run to the profiler, you don’t have to do anything. See that it slows down, make at least one thread dump, and look. If you have one hot spot in which the program spends all the time, you are in thread dump and you will see this line in your favorite development environment, without using any third-party, additional tools. Look at this code, study, optimize - either it is called too often, or it works slowly, then there is debriefing, optimization, or further profiling.
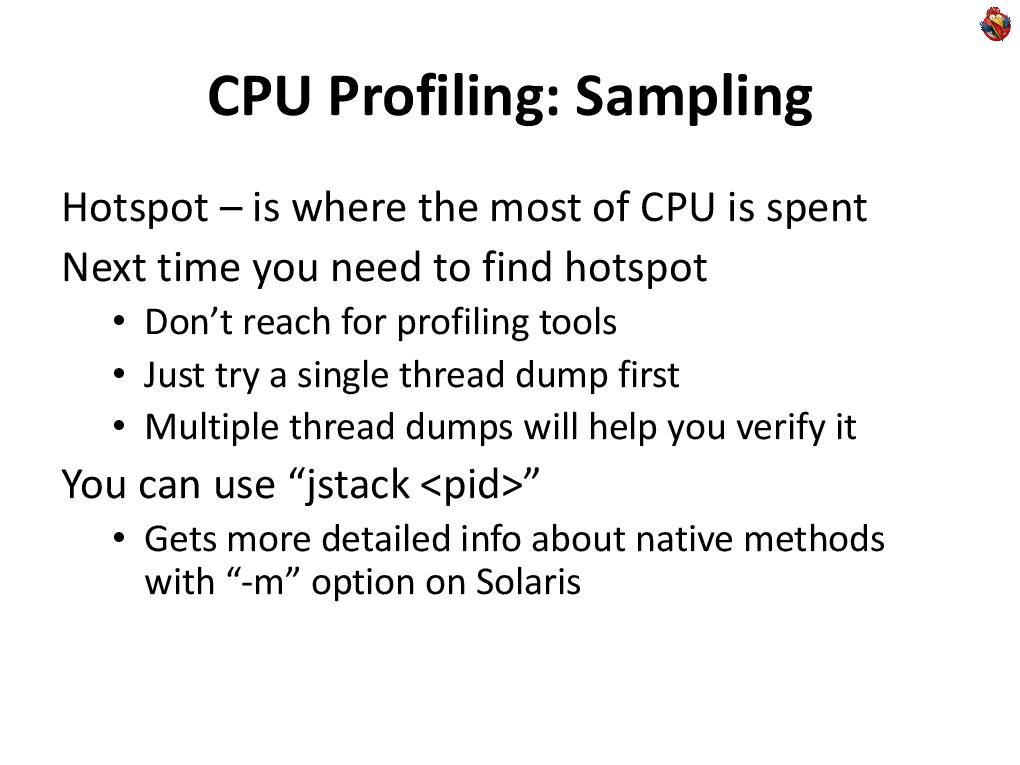 Also in modern Java-machines there is a wonderful utility “jstack”, you can pass it the process ID, and get a thread dump on the output.
Do more than one thread dump, do some thread dumps. If the first doesn’t catch anything, look at a couple more. Maybe the program spends not one hundred percent of the time in your hot spot, but 50%. Having made several thread dumps, you will obviously get at least one of these points out of your code from the hot spot, and look with your eyes at the places where you found your code.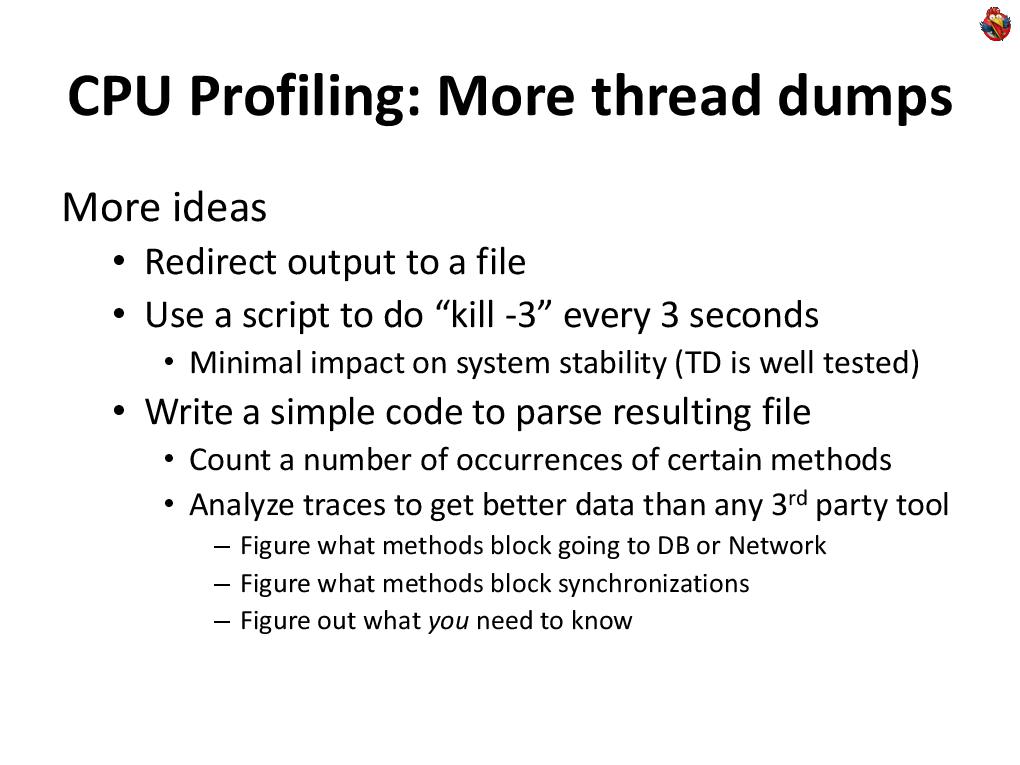 This idea can be developed further. You can, by starting a Java machine, redirect its output to a file, and run a script that does a thread dump every three seconds. This can be done quite calmly on a living system, without any risk to do something with it. Because the collection of thread dump itself is a fairly fast procedure, it takes 100 milliseconds, even with a very large number of threads.
And if you write in Java, then most likely your system is not hard real time, and nanoseconds are not important to you there, because you already periodically encounter garbage collection and so on. Those. you do not create an unnecessary falling asleep system for a hundred milliseconds of disaster.
And even in our financial field, most of the systems that we write, we write for people, people work with them, yes, there are millions of quotes per second, yes, there are robots (this is another story), but most often on These quotes are watched by a person who, plus or minus 100 milliseconds, will not notice in their eyes. A person will notice if there is braking for two hundred milliseconds, it will already be a noticeable delay for a person, but a hundred milliseconds will not.
Therefore, you can not worry about the extra hundred milliseconds, and once every three seconds to do thread dump, you can completely safely, even on a live system. At the same time, thread dump is part of the java machine, well tested - I have never seen in my entire experience that trying to do thread dump on a Java machine did something bad with it.
Those. It is a completely safe tool for profiling live and working systems. After that, having received the thread dump file, you can look at it with eyes, or you can write a simple piece of code that analyzes, considers some statistics → at least stupidly, see what methods have appeared and how many times, see what state the threads were in.Moreover, if the standard profiling tools really look at the state of the stream that the Java machine (“RUNNABLE”) displays, then in reality, your state does not mean anything, because if your program works a lot with the database and works a lot with some external ... network, then your code can expect to receive data over the network, while the java machine considers it “RUNNABLE”, and you can’t understand anything - what are your real methods and what are waiting for data from the network. On the other hand, if you analyze the stacks yourself, you can write, you know what your program does, that this is a call to the database, that this method on the stack means that you are logged into the database, you can count how much percent of the time you spend in the database, and so on and so forth. You may know that this method doesn’t actually eat the CPU, Moreover, thread dump can be integrated into applications, Java has a wonderful method
Thus, you can integrate profiling as a functional part of this application, and distribute the application to your customers, with already built-in profiling. Thus, you will have a constant flow of information that you can analyze to improve your application.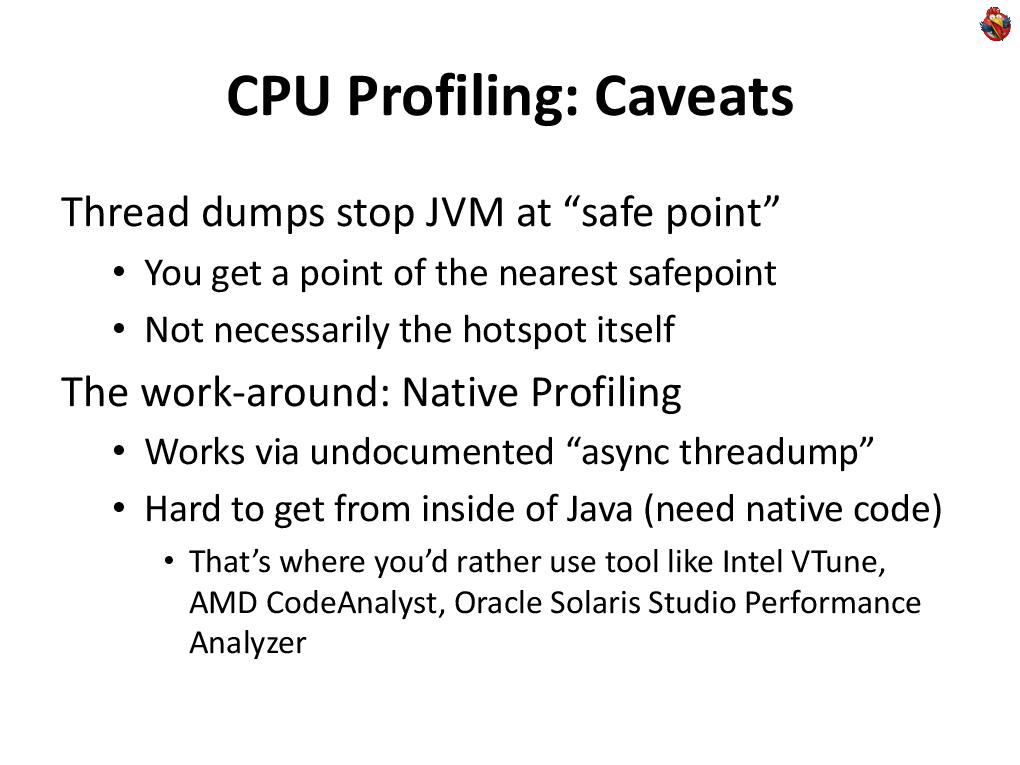 But there is a problem. The fact is that when you ask the Java machine to make thread-dump, it does not just stop the process and makes the stack, it includes a flag that the Java machine should stop in the next safe place. A “safe place” is special places that the compiler places according to the code, where the program has a certain state, where it is clear that it has registers, the execution point is clear, and so on. If you take a piece of sequential code, where there are no reverse transitions, no cycles, then the “safe point” may not be there at all. Moreover, it doesn’t matter that method calls can become hotspot inline, and there will be no savepoints either.
Therefore, if you see some line in the thread dumpe, this does not mean at all that this is the hot line of your code, it is simply the closest savepoint to the hot point. Because when you press “CTRL-BREAK”, Java streams all threads to “stop at the nearest savepoint”, and only when they stop does the Java machine analyze what state they are doing.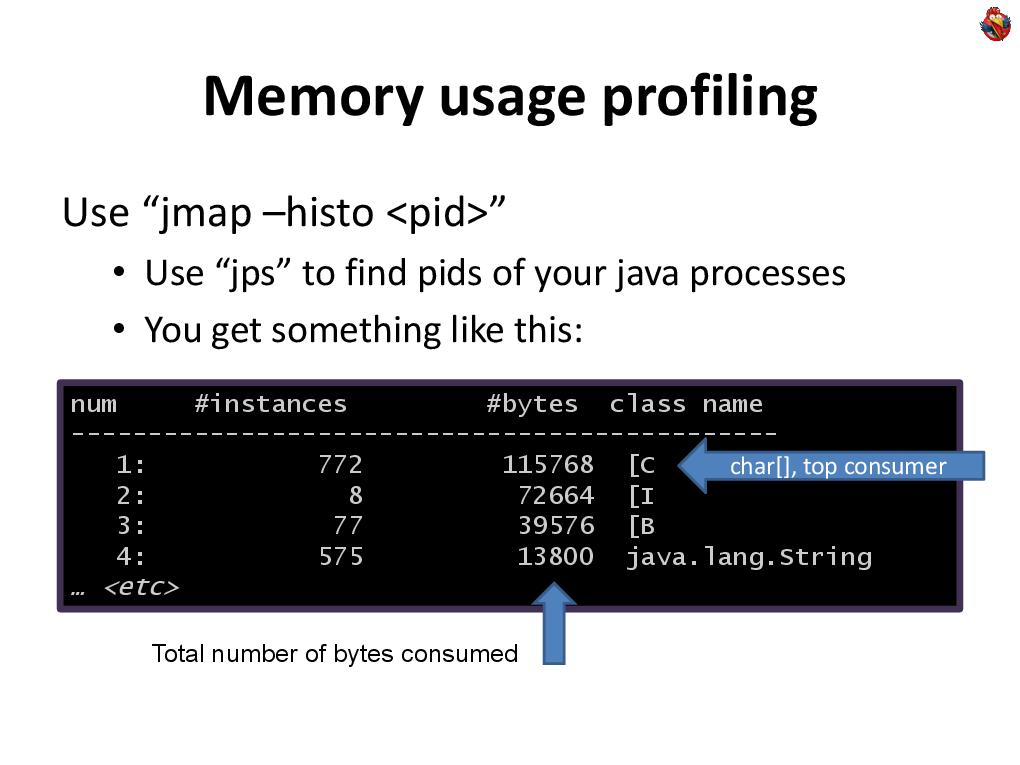 Now let's move on to profiling the memory of how this is done.
Firstly, there are wonderful, ready-made features of the Java machine. There is a great jmap tool that displays a histogram of what your memory is full of, what objects and how much memory they occupy. This is a great tool for a general overview of what is going on and how your memory is clogged.
Again, if you have never profiled the program, then most often you will immediately find problems, and you will have food to further optimize your memory usage. The problem is that in this way you get information about all objects, even those that are currently not in use, are in the trash.
Therefore, jmap has a special option “live”, which before making a histogram makes garbage collection, leaves only used objects, and only after that builds a histogram.
The problem is that already with this option, you cannot profile a large, live system working with many gigabytes of memory, because garbage collection of a system working with ten gigabytes of memory takes ten or two seconds, and this may be unacceptable ... on any system, if your the system works with finite people, a person to whom the system does not respond for more than three seconds, believes that it hangs. It is impossible to stop a living system working with a person for longer than a second, in fact. Even a second will already be noticeable to a person, but not a disaster yet, but if you connect some tool that stops for 10 seconds, it will be a disaster. Therefore, you often have to be content with the living systems of jmaps of those objects that are, and in general, it does not matter whether it is garbage or not.
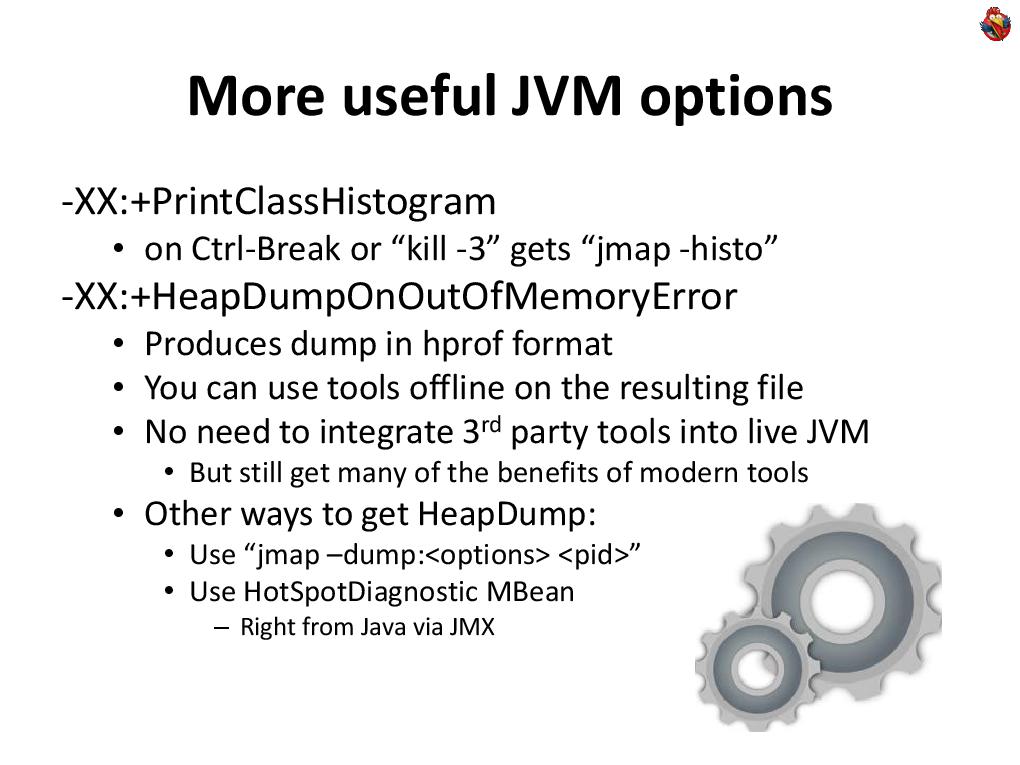 It is also useful to know additional options for Java machines. For example, Java machines may be asked to print a class histogram when you do a thread dump → “PrintClassHistogram”.
You can ask a Java machine to use its memory to write its state to disk. This is very useful, because usually, people begin to optimize memory consumption only when it ends for some reason. No one is engaged in profiling when everything is fine, but when the program starts to run out of memory, it crashes, they begin to think how to optimize like that. Therefore, it is useful to always have this option enabled. Then, in a bad case, the Java machine will write you a binary dump, which you can later analyze, not on a live system, using any tools. At the same time, this dump can be taken at any time from the Java machine, with the same jmap, with the “-dump” option, but this, again, stops the Java machine for a long time, you hardly go to the live system do.
A remark from the audience: There is a property that this "HeapDumpOutOfMemory" is optimized for those cases when the memory has already run out.
Yes of course. “HeapDumpOutOfMemory” is a very useful option, and although it is “-XX”, you should not be afraid of these options, although this “XX” emphasizes their megaspeciality, but these are not experimental options, these are normal production options for Java machines, they are stable, reliable, they can be used on a live, real system.
These are not experimental options! There is a clear division in the java machine, but the division into experimental and non-experimental options does not depend on the number of Xs.
Remark from the audience: Sometimes dumps do not postpone this option ...
Well, there are bugs in the java machine too, it all depends on ... there are various reasons for running out of memory, I won’t stop there, we have little time. I want to dwell on a very important point, in the remaining time, namely, on the profile of memory allocation.
It's one thing - what the memory is about, how you use it at all. If you somewhere in the code have excessive allocation of temporary memory, i.e. you isolate ... do something with it, this method and then forget it, it goes into the garbage, and the garbage collector then picks it up. And so you do it again and again, your program will run slower than it would work with this ... but you will not find this place of code in any CPU profiler, because the allocation operation in the Java memory machine works fantastically fast, faster, than in any non-managed language, C / C ++, because in Java, allocating memory is trivial to increment a single pointer. Everything. These are a few assembly instructions, everything happens very quickly. It has already been reset to zero, everything is already allocated and prepared. When analyzing the hot spots of your code, you will not find this time - it will never be displayed in you, in any thread dumpe, or in any profiler, that it is your hot spot. Although it’s all with you, it’s going to eat up your time, why your application? Because then, the garbage collector will spend time to collect this garbage. Therefore, look at how much percent of the time your application spends on garbage collection.
This is a useful option “-verbose: gc”, “+ PrintGC”, “+ PrintGCDetails”, which will allow you to figure out how long your application takes to garbage collection. If you see that a significant percentage of the time is spent on garbage collection, it means that somewhere in the program you allocate a lot of memory, you will not find this place, you need to look for who allocates the memory.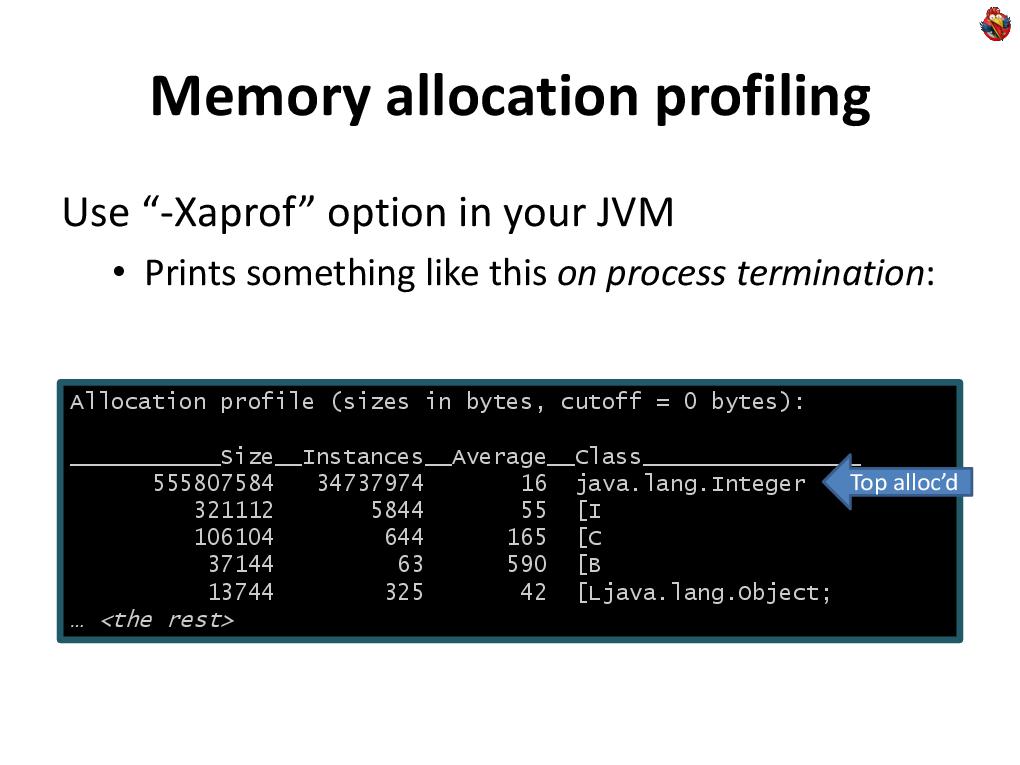 How to search? There is a method built into the Java machine, the “-Xaprof” key. Unfortunately, only at the end of the process does it display the so-called allocation profile, which does not speak about the contents of the memory, but about the statistics of allocated objects → which objects and how often were allocated.
If this really happens often for you, you will most likely see that somewhere there is some kind of temporary class that really stands out very often. Try to make aprof right away - maybe you will immediately find your problem. But not a fact. It may turn out that you will see a selection of a large number of character arrays, some strings, or something, and it is not clear where.
It is clear that you may have suspicions - where. Maybe some recent change, it could make. In the end, you can add in the place where memory is allocated too often, using the same technique of changing the code in atomis longs, count how many times the allocation takes place in this place - look at the statistics, you can initiate and find suspicious places yourself.
But what if you have no idea where this is happening? Well, you need to somehow add the collection of statistics everywhere, in all places where memory is allocated. Aspect-oriented programming, or the direct use of bytecode manipulation, is great for this kind of task.
Now, for the remaining time, I’ll try to focus on the bytecode manipulation technique, which is just right for solving problems such as “now I want to calculate how many times this happens in this place, in all my places code to find the very place where for some reason I allocate a lot of arrays of ints. ” Those. I see that a lot of them stand out, but I just want to find where.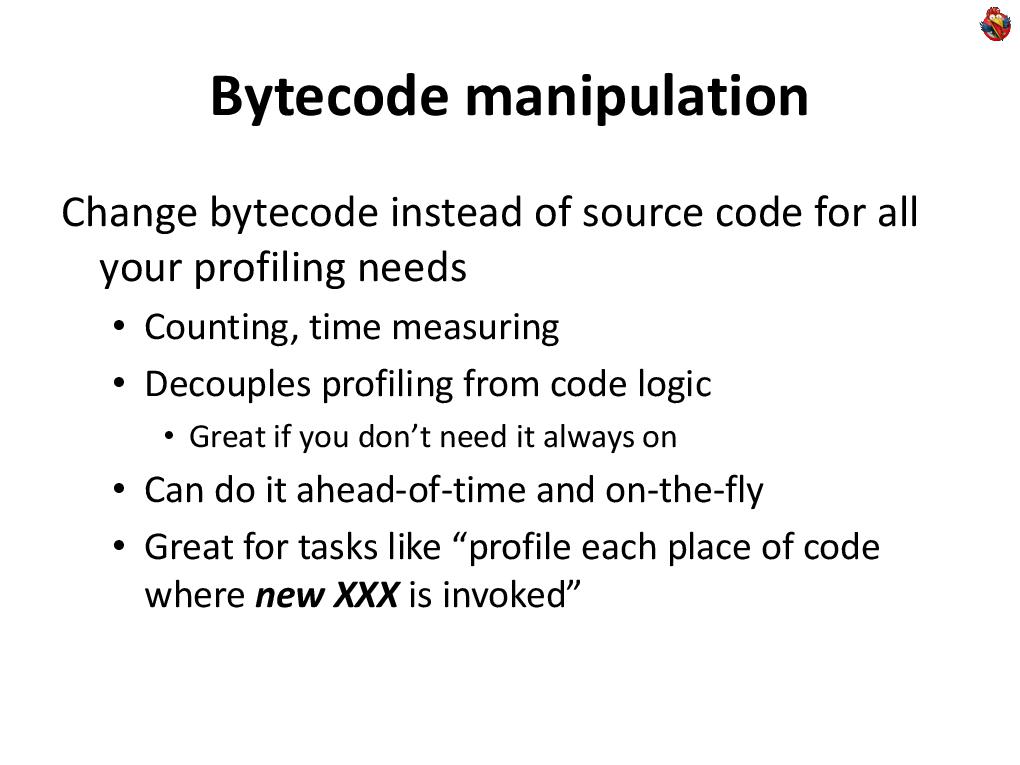 Bytecode manipulation allows not only to solve these problems, it allows you to make any changes, non-functional, to the code, after compiling it. Thus, this way of decomposing profiling from business logic. If at the beginning I said that often profiling can be a logical part of your functionality, then there are times when it is not necessary, when you need to find a problem, solve it, and leave no lines. In this case, a wonderful technique such as bytecode manipulation is suitable.
And this can be done both with post-compilation of the code layout, and on the fly, with the code.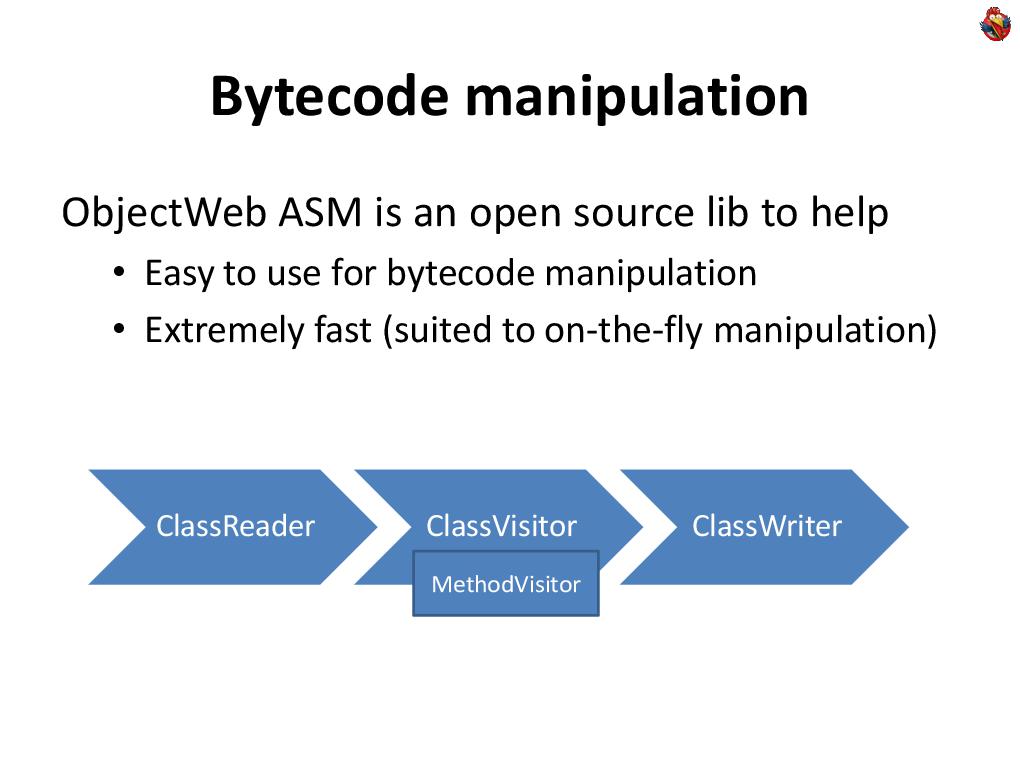 The best way I know is to use the ASM library, ObjectWeb. This is an open-source library that makes it very easy to manipulate bytecode, and it is fantastically fast - you can manipulate the code on the fly without slowing down the application loading time.
ASM is very simple. He has a class called class-reader that reads .class files and converts bytes using the Visitor template into a set of calls like “I see a method”, “I see a field with such fields in this class” and so on Further. When he sees a method, he starts using the MethodVisitor to report what kind of bytecode he sees there.
And then there is, on the other hand, such a thing as “ClassWriter”, which, on the contrary, turns the class into an array of bytes, which is needed by the Java machine. To, for example, with the help of ASM, to track all the allocation of arrays ... in general, this is done primitively. You just need to do a couple of classes. You need to define your adapter class, which, when it is told that the method is visible, overlaps, and returns its own visitor method in order to know what is going on in this method.
And when inside the method they tell him that there is an integer instruction with the bytecode of the array allocation ("NEWARRAY"), then at that moment, he has the opportunity ... to insert his own bytecodes into the upstream and that’s it. And you tracked all the places where arrays are allocated to you, and changed the corresponding bytecode.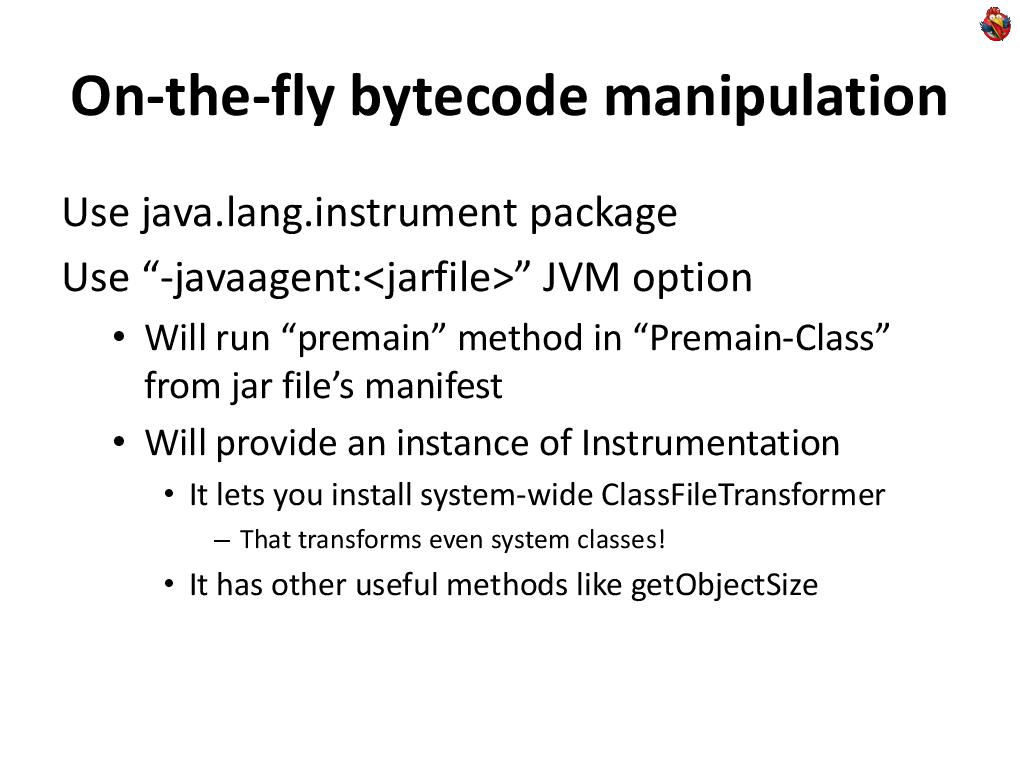 Further - what to do if you want to make these changes on the fly.
If you have a set of compiled classes, then it’s easy → you’ve sort of processed this tool, and that’s it.
If you need to do this on the fly, then there is a wonderful option in the java machine - javaagent. You make a special jar file, in which you indicate the option “Premain-Class” in the manifest, and specify the name of your class there. Then ... the “premain” method according to a specific template, and thus, even before you run the main code, with the main method, you get control and get a pointer to the interface instrumentation. This interface is wonderful, it allows you, on the fly, to change classes in a java machine. It allows you to put your own class-file transformer, which the Java machine will call for every attempt to load a class.
And you can replace classes. Those. load not only the classes that actually lie, but using the same ObjectWebASM, analyze something, change, and replace them on the fly ... you can find out the size of the selected object.
A wonderful tool for such profiling on the knee when you have a specific problem that needs to be solved.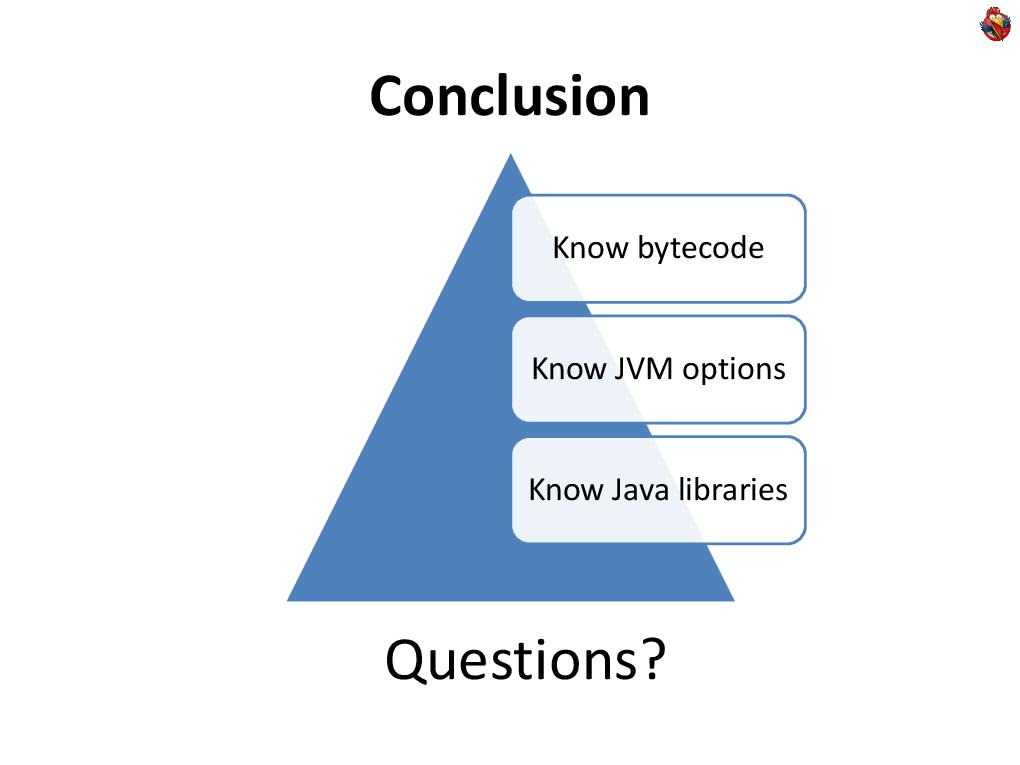 In conclusion, I’ll say that it’s not at all necessary, to solve some profiling problems, to own any tool, it is enough to know the bytecode, know the options of the Java machine, and know the standard Java libraries, the same javalang tool. This allows you to solve a huge number of specific problems that you encounter. For ten years in our company we have developed several homegrown tools that solve problems not specific to us, which specific profilers do not solve. Starting with the fact that in the process of work we got a weighty, but nonetheless simple tool that analyzes thread dump and gives statistics on them, it is nevertheless a simple utility that cannot be called a tool. A classic on several pages that collects statistics and displays it in a beautiful way. Wildly useful
And ending with the fact that we have our own memory profiling tool, which, again, is small, it is difficult to call it a tool that tracks where and what is allocated, and it does this almost without slowing down the program. Moreover, both commercial and open profilers, they also know how to track memory allocation, but they are trying to solve the problem of a more complex and universal one. They are trying to find out where memory allocation occurs with a full stack-trace. This is a long time, it slows down a lot. Do not use the same sampling. Not always collected, thereby not receiving all the statistics, and so on.
You make some kind of compromise, which in your subject area, you do not need, you have some of your tasks that you want to solve when analyzing the performance of your systems.
Now I will answer questions (answers to questions from 30:06).
You can also watch other transcripts from application developer days , download all videos from past conferences with torrents ( [2011] , [2010] ) or the entire folder via http .
Disclaimer again: I am not the author of the report. I am the PC chairman of this conference, video editor, and transcript. The author does not have a habraaccount, maybe in time I will be able to invite him, for example, to comment on your questions. The author of the report, elizarov, is called upon to comment and answers questions. also a discussion in the author’s journal .
BTW, elizarov speaks at the ADD-2012 conference with a report " Writing the fastest hash for data caching. "
But I also suggest that you take a look at the 70K text of the illustrated article-transcript under the cut, compiled by me from video and slides.
Today I will have a report on "Do it yourself profiling in Java." Slides will be in English, I will do the report in Russian. There are very, very many slides, but not so much time, so I’ll skip some very quickly, and try to leave more time at the end for questions, and maybe even somewhere in the middle. In principle, do not be shy if you suddenly want to ask or clarify something, or even interrupt me. I’d better explain in more detail what you are interested in than simply telling what I wanted to tell.The report is based on real experience. We have been working in the company for more than ten years to create complex, very high-loaded financial applications that work with large amounts of data, with millions of quotes per second, with tens of thousands of users online, and there, with such work, we always talk about profiling an application.
Application profiling is an inevitable component of any optimization; optimization without profiling is impossible. You profile, find bottlenecks, optimize-profile, this is a constant cycle. Why is the report called “Do It Yourself Java Profiler”, why do something yourself? There are a huge number of off-the-shelf tools that help to profile - actually profilers, and similar tools.But the fact is that, firstly, there may be a problem with a third-party tool. You simply for some reason - reliability or security, may not be able to run a third-party tool on some kind of living environment. And unfortunately, it is often necessary to do profiling not only on a test platform, but also on a live platform, and not always for a highly loaded platform, you have the opportunity and resources to make an identical copy of the system and run under the same load. And many bottlenecks can be revealed only under heavy load, only under very specific conditions. You see that the system is not working properly, but you do not understand why. What kind of load pattern needs to be created for it so that the problem manifests itself - therefore, it is often necessary to profile a live system.
When we write financial applications, we still have a task to ensure the reliability of the system. And we do not do “banks”, where the main thing is not to lose your money, but which may not be available for hours. We make brokerage systems for online trading, where the availability of systems is always 24 × 7, this is one of their key qualities, they should never fall.
And I have already said that the entire industry is regulated, and sometimes we can’t use a third-party product on a real system.
But tools are often opaque. Yes, there is documentation that describes the “what”, but it does not describe how he gets these results, and it is not always possible to understand what he actually intended.
And even if the tool is open source, it does not change anything, because there is a lot of this code, you will kill a lot of time understanding it. Tools need to be learned, and to do something yourself, of course, is much more pleasant.
What is the problem with learning? Naturally, if you use some kind of tool often, then it is worth learning it. If you program every day in some development environment you love, you know it far and wide, and this knowledge, of course, pays off a hundredfold. And if you need to do something once a month, for example, once a month you need to do profiling for a performance bug, then it is not a fact that learning the appropriate tool will pay off. Of course, if there is no situation when the tool solves the problem many times faster.
Doing something with your own hands, you can reuse your knowledge. For example, you have knowledge of programming languages, your tools, you can deepen, expand, clarify them by studying the tools that you already have, rather than learning new ones.
Why report on Java? Well, not only does our company program in Java, it is the leading language of the year 2001 by the TIOBE index, and is great for enterprise applications. And for this particular lecture, it’s generally wonderful - because Java is a managed language that works in a virtual machine, and profiling in Java is very easy.First of all, I will talk about how to solve many profiling problems by writing some code in Java. I’ll tell you about the capabilities of Java machines that you can use, and talk about a technique such as byte code manipulation. Today we look at the profiling of both the CPU and memory. I will talk about different techniques. CPU profiling. The easiest way is to simply take and program. If you need to figure out where, how much, what, in your program it takes time, and how many times it is called, then the easiest way is this: you do not need any tools, nothing - just write a few lines of code.Java has a wonderful function called “currentTimeMillis” that returns the current time. You can measure it in one place, measure it in another, and then you can calculate how many times this is done, the total time, the minimum and maximum time, anything. The most such simple way. DIY at its maximum simplicity and primitivism.
Oddly enough, in practice, the method works great, it brings a bunch of benefits - because it is fast, convenient and efficient.
When does this method work well? This works great for business methods - the business method is large, it is not called very often, and you need to measure something about it. Moreover, having written this code, since you wrote it - it becomes part of your application and part of the functionality. More or less, any modern large application contains management interfaces, some statistics, ... and in general, application performance is one of three things that you often want to see the application displaying about itself, simply as part of its functionality.In this sense, programming an application to profile itself is a logical step. You increase the functionality of the application, profiling the application becomes part of its functionality. Especially, if in this way you place the definitions in your business methods that the end user calls, then this information will also be meaningful to the end user. How many times and what methods were called, how much time worked out, and so on. The information that you collect, in this case, with this approach, is completely under your control. You can measure the number of calls, minimum time, maximum time, average count, you can build histograms of the distribution of runtime, count medians and percentiles. You can track different execution paths in code differently, as in this example,
This is possible if you write this code yourself, collect statistics, and embed yourself in your application. Moreover, to you, as a person who is involved in the profiling-optimization cycle, you then use this information - what happens in your application? This information is always inside your application, the code runs on a live system. You had some unlucky day, something the system didn’t work like that, you can look at the statistics in the logs, figure it out, and so on. Wonderful technique, there are no third-party tools, just a little bit of code in Java.
What to do if the methods are shorter and are called more often?
The fact is that such a direct method is no longer suitable, because the "currentTimeMillis" method is not fast, and only measures in milliseconds.
If you need to measure only the number of calls, then quickly enough you can do this using the Java class “AtomicLong”. With it, you can, by making a minimal contribution to performance, calculate the number of calls of any method that interests you. This will work up to tens of thousands of calls per second, without greatly distorting the operation of the application itself.What if you still need to measure the runtime? Measuring the execution time of short methods is a very complex topic. It cannot be solved by standard methods, despite the fact that Java has the “systemNanoTime” method, it does not solve these problems, it is slow by itself, and it is difficult to measure something fast with it. The only real solution is to use the native code, there is such a wonderful rdtsc instruction for the x86 processor, which returns the processor clock count. There is no direct access to it; you can write a single-line method in C that calls “rdtsc”, and then link it to Java code and call it from Java. This call will take you a hundred cycles, and if you need to measure a piece of code that takes a thousand or two cycles, then it makes sense if you are optimizing each machine cycle and you want to understand “plus or minus”, “faster-slower ", How do you work. This is a really rare case when you need to optimize every measure.
Most often, when it comes to some shorter pieces of code, and more often called, they use a different approach, which is called "sampling". Instead of accurately measuring how many times and what is called, you periodically analyze the program’s execution, see where it is executed, at arbitrary points in time, for example, once a second, or once every ten seconds.
See where the execution takes place and see where you often find your program. If your program has a line in which it spends everything, or at least 90% of its time, for example, some cycle, and there, in the depths, some line, then most likely, when you stop execution, you in this line and catch.Such a place in the program is called a “hot spot”. It is always a great candidate for optimization. Which is cool - there is a built-in function called “thread dump” to get a dump of all threads. On Windows, it is done by pressing CTRL-Break on the console, and on Linux and other Unixes this is done by sending a third signal, the “kill -3” command.
In this case, the Java machine displays a detailed description of the status of all threads on the console. And if you really have a hot spot in the code, then most likely you will find the program there. Therefore, again, when you have a performance problem with the code, you don’t have to run to the profiler, you don’t have to do anything. See that it slows down, make at least one thread dump, and look. If you have one hot spot in which the program spends all the time, you are in thread dump and you will see this line in your favorite development environment, without using any third-party, additional tools. Look at this code, study, optimize - either it is called too often, or it works slowly, then there is debriefing, optimization, or further profiling.Also in modern Java-machines there is a wonderful utility “jstack”, you can pass it the process ID, and get a thread dump on the output. Do more than one thread dump, do some thread dumps. If the first doesn’t catch anything, look at a couple more. Maybe the program spends not one hundred percent of the time in your hot spot, but 50%. Having made several thread dumps, you will obviously get at least one of these points out of your code from the hot spot, and look with your eyes at the places where you found your code.
This idea can be developed further. You can, by starting a Java machine, redirect its output to a file, and run a script that does a thread dump every three seconds. This can be done quite calmly on a living system, without any risk to do something with it. Because the collection of thread dump itself is a fairly fast procedure, it takes 100 milliseconds, even with a very large number of threads. And if you write in Java, then most likely your system is not hard real time, and nanoseconds are not important to you there, because you already periodically encounter garbage collection and so on. Those. you do not create an unnecessary falling asleep system for a hundred milliseconds of disaster.
And even in our financial field, most of the systems that we write, we write for people, people work with them, yes, there are millions of quotes per second, yes, there are robots (this is another story), but most often on These quotes are watched by a person who, plus or minus 100 milliseconds, will not notice in their eyes. A person will notice if there is braking for two hundred milliseconds, it will already be a noticeable delay for a person, but a hundred milliseconds will not.
Therefore, you can not worry about the extra hundred milliseconds, and once every three seconds to do thread dump, you can completely safely, even on a live system. At the same time, thread dump is part of the java machine, well tested - I have never seen in my entire experience that trying to do thread dump on a Java machine did something bad with it.
Those. It is a completely safe tool for profiling live and working systems. After that, having received the thread dump file, you can look at it with eyes, or you can write a simple piece of code that analyzes, considers some statistics → at least stupidly, see what methods have appeared and how many times, see what state the threads were in.
Moreover, if the standard profiling tools really look at the state of the stream that the Java machine (“RUNNABLE”) displays, then in reality, your state does not mean anything, because if your program works a lot with the database and works a lot with some external ... network, then your code can expect to receive data over the network, while the java machine considers it “RUNNABLE”, and you can’t understand anything - what are your real methods and what are waiting for data from the network. On the other hand, if you analyze the stacks yourself, you can write, you know what your program does, that this is a call to the database, that this method on the stack means that you are logged into the database, you can count how much percent of the time you spend in the database, and so on and so forth. You may know that this method doesn’t actually eat the CPU, Moreover, thread dump can be integrated into applications, Java has a wonderful method Thread.getAllStackTraceswhich allows you to get information about stacktrace programmatically.
Thus, you can integrate profiling as a functional part of this application, and distribute the application to your customers, with already built-in profiling. Thus, you will have a constant flow of information that you can analyze to improve your application.
But there is a problem. The fact is that when you ask the Java machine to make thread-dump, it does not just stop the process and makes the stack, it includes a flag that the Java machine should stop in the next safe place. A “safe place” is special places that the compiler places according to the code, where the program has a certain state, where it is clear that it has registers, the execution point is clear, and so on. If you take a piece of sequential code, where there are no reverse transitions, no cycles, then the “safe point” may not be there at all. Moreover, it doesn’t matter that method calls can become hotspot inline, and there will be no savepoints either.Therefore, if you see some line in the thread dumpe, this does not mean at all that this is the hot line of your code, it is simply the closest savepoint to the hot point. Because when you press “CTRL-BREAK”, Java streams all threads to “stop at the nearest savepoint”, and only when they stop does the Java machine analyze what state they are doing.
Now let's move on to profiling the memory of how this is done. Firstly, there are wonderful, ready-made features of the Java machine. There is a great jmap tool that displays a histogram of what your memory is full of, what objects and how much memory they occupy. This is a great tool for a general overview of what is going on and how your memory is clogged.
Again, if you have never profiled the program, then most often you will immediately find problems, and you will have food to further optimize your memory usage.
The problem is that in this way you get information about all objects, even those that are currently not in use, are in the trash. Therefore, jmap has a special option “live”, which before making a histogram makes garbage collection, leaves only used objects, and only after that builds a histogram.
The problem is that already with this option, you cannot profile a large, live system working with many gigabytes of memory, because garbage collection of a system working with ten gigabytes of memory takes ten or two seconds, and this may be unacceptable ... on any system, if your the system works with finite people, a person to whom the system does not respond for more than three seconds, believes that it hangs. It is impossible to stop a living system working with a person for longer than a second, in fact. Even a second will already be noticeable to a person, but not a disaster yet, but if you connect some tool that stops for 10 seconds, it will be a disaster. Therefore, you often have to be content with the living systems of jmaps of those objects that are, and in general, it does not matter whether it is garbage or not.
It is also useful to know additional options for Java machines. For example, Java machines may be asked to print a class histogram when you do a thread dump → “PrintClassHistogram”.You can ask a Java machine to use its memory to write its state to disk. This is very useful, because usually, people begin to optimize memory consumption only when it ends for some reason. No one is engaged in profiling when everything is fine, but when the program starts to run out of memory, it crashes, they begin to think how to optimize like that. Therefore, it is useful to always have this option enabled. Then, in a bad case, the Java machine will write you a binary dump, which you can later analyze, not on a live system, using any tools. At the same time, this dump can be taken at any time from the Java machine, with the same jmap, with the “-dump” option, but this, again, stops the Java machine for a long time, you hardly go to the live system do.
A remark from the audience: There is a property that this "HeapDumpOutOfMemory" is optimized for those cases when the memory has already run out.
Yes of course. “HeapDumpOutOfMemory” is a very useful option, and although it is “-XX”, you should not be afraid of these options, although this “XX” emphasizes their megaspeciality, but these are not experimental options, these are normal production options for Java machines, they are stable, reliable, they can be used on a live, real system.
These are not experimental options! There is a clear division in the java machine, but the division into experimental and non-experimental options does not depend on the number of Xs.
Remark from the audience: Sometimes dumps do not postpone this option ...
Well, there are bugs in the java machine too, it all depends on ... there are various reasons for running out of memory, I won’t stop there, we have little time.
I want to dwell on a very important point, in the remaining time, namely, on the profile of memory allocation.It's one thing - what the memory is about, how you use it at all. If you somewhere in the code have excessive allocation of temporary memory, i.e. you isolate ... do something with it, this method and then forget it, it goes into the garbage, and the garbage collector then picks it up. And so you do it again and again, your program will run slower than it would work with this ... but you will not find this place of code in any CPU profiler, because the allocation operation in the Java memory machine works fantastically fast, faster, than in any non-managed language, C / C ++, because in Java, allocating memory is trivial to increment a single pointer. Everything. These are a few assembly instructions, everything happens very quickly. It has already been reset to zero, everything is already allocated and prepared. When analyzing the hot spots of your code, you will not find this time - it will never be displayed in you, in any thread dumpe, or in any profiler, that it is your hot spot. Although it’s all with you, it’s going to eat up your time, why your application? Because then, the garbage collector will spend time to collect this garbage. Therefore, look at how much percent of the time your application spends on garbage collection.
This is a useful option “-verbose: gc”, “+ PrintGC”, “+ PrintGCDetails”, which will allow you to figure out how long your application takes to garbage collection. If you see that a significant percentage of the time is spent on garbage collection, it means that somewhere in the program you allocate a lot of memory, you will not find this place, you need to look for who allocates the memory.
How to search? There is a method built into the Java machine, the “-Xaprof” key. Unfortunately, only at the end of the process does it display the so-called allocation profile, which does not speak about the contents of the memory, but about the statistics of allocated objects → which objects and how often were allocated.If this really happens often for you, you will most likely see that somewhere there is some kind of temporary class that really stands out very often. Try to make aprof right away - maybe you will immediately find your problem.
But not a fact. It may turn out that you will see a selection of a large number of character arrays, some strings, or something, and it is not clear where. It is clear that you may have suspicions - where. Maybe some recent change, it could make. In the end, you can add in the place where memory is allocated too often, using the same technique of changing the code in atomis longs, count how many times the allocation takes place in this place - look at the statistics, you can initiate and find suspicious places yourself.
But what if you have no idea where this is happening? Well, you need to somehow add the collection of statistics everywhere, in all places where memory is allocated. Aspect-oriented programming, or the direct use of bytecode manipulation, is great for this kind of task.
Now, for the remaining time, I’ll try to focus on the bytecode manipulation technique, which is just right for solving problems such as “now I want to calculate how many times this happens in this place, in all my places code to find the very place where for some reason I allocate a lot of arrays of ints. ” Those. I see that a lot of them stand out, but I just want to find where.
Bytecode manipulation allows not only to solve these problems, it allows you to make any changes, non-functional, to the code, after compiling it. Thus, this way of decomposing profiling from business logic. If at the beginning I said that often profiling can be a logical part of your functionality, then there are times when it is not necessary, when you need to find a problem, solve it, and leave no lines. In this case, a wonderful technique such as bytecode manipulation is suitable. And this can be done both with post-compilation of the code layout, and on the fly, with the code.
The best way I know is to use the ASM library, ObjectWeb. This is an open-source library that makes it very easy to manipulate bytecode, and it is fantastically fast - you can manipulate the code on the fly without slowing down the application loading time. ASM is very simple. He has a class called class-reader that reads .class files and converts bytes using the Visitor template into a set of calls like “I see a method”, “I see a field with such fields in this class” and so on Further. When he sees a method, he starts using the MethodVisitor to report what kind of bytecode he sees there.
And then there is, on the other hand, such a thing as “ClassWriter”, which, on the contrary, turns the class into an array of bytes, which is needed by the Java machine.
To, for example, with the help of ASM, to track all the allocation of arrays ... in general, this is done primitively. You just need to do a couple of classes. You need to define your adapter class, which, when it is told that the method is visible, overlaps, and returns its own visitor method in order to know what is going on in this method. And when inside the method they tell him that there is an integer instruction with the bytecode of the array allocation ("NEWARRAY"), then at that moment, he has the opportunity ... to insert his own bytecodes into the upstream and that’s it. And you tracked all the places where arrays are allocated to you, and changed the corresponding bytecode.
Further - what to do if you want to make these changes on the fly.If you have a set of compiled classes, then it’s easy → you’ve sort of processed this tool, and that’s it.
If you need to do this on the fly, then there is a wonderful option in the java machine - javaagent. You make a special jar file, in which you indicate the option “Premain-Class” in the manifest, and specify the name of your class there. Then ... the “premain” method according to a specific template, and thus, even before you run the main code, with the main method, you get control and get a pointer to the interface instrumentation. This interface is wonderful, it allows you, on the fly, to change classes in a java machine. It allows you to put your own class-file transformer, which the Java machine will call for every attempt to load a class.
And you can replace classes. Those. load not only the classes that actually lie, but using the same ObjectWebASM, analyze something, change, and replace them on the fly ... you can find out the size of the selected object.
A wonderful tool for such profiling on the knee when you have a specific problem that needs to be solved.
In conclusion, I’ll say that it’s not at all necessary, to solve some profiling problems, to own any tool, it is enough to know the bytecode, know the options of the Java machine, and know the standard Java libraries, the same javalang tool. This allows you to solve a huge number of specific problems that you encounter. For ten years in our company we have developed several homegrown tools that solve problems not specific to us, which specific profilers do not solve. Starting with the fact that in the process of work we got a weighty, but nonetheless simple tool that analyzes thread dump and gives statistics on them, it is nevertheless a simple utility that cannot be called a tool. A classic on several pages that collects statistics and displays it in a beautiful way. Wildly usefulAnd ending with the fact that we have our own memory profiling tool, which, again, is small, it is difficult to call it a tool that tracks where and what is allocated, and it does this almost without slowing down the program. Moreover, both commercial and open profilers, they also know how to track memory allocation, but they are trying to solve the problem of a more complex and universal one. They are trying to find out where memory allocation occurs with a full stack-trace. This is a long time, it slows down a lot. Do not use the same sampling. Not always collected, thereby not receiving all the statistics, and so on.
You make some kind of compromise, which in your subject area, you do not need, you have some of your tasks that you want to solve when analyzing the performance of your systems.
Now I will answer questions (answers to questions from 30:06).
You can also watch other transcripts from application developer days , download all videos from past conferences with torrents ( [2011] , [2010] ) or the entire folder via http .
BTW, elizarov speaks at the ADD-2012 conference with a report " Writing the fastest hash for data caching. "