The basics of social network analysis (Social Network Analysis 101)
- Transfer
From the translator. The author of this publication - Michael Wu ( by Michael the Wu ), a leading analyst company by Lithium , specializing in the study of social interactions, and online communities.
To understand what a "social-network analysis" ( List Social the Network an Analysis , an SNA), you need to understand what a "social network" and what is "social graph." Simply put, social network analysis is a way of studying social networks, and a social network is a set of entities between which there are certain relationships. Social networks have existed since people began to roam the earth. In truth, not only humans have such structures, but also social animals (for example, wolves, lions, dolphins, mice, and even ants).
Of course, we are primarily interested in such entities as people, and such relationships between them as friendship (like on Facebook), teamwork (like on LinkedIn), kinship, communication, and some other social interactions. And in the context of SNA, we can mean by a social graph just a visualization of all this (I'm not going to catch up with the formal definition of a graph ). In such a social graph, each point (or node, or vertex) represents a person, and the edge between two points (people) represents the relationship between them. And since there are many different relationships between people, just as there are many different social graphs depicting these relationships. I will show this with a concrete example.
Let's assume that I, Michael, have a very small social network consisting of only seven friends (see Figure 1). Suppose further that I have a very simple life in which I maintain only three types of social relations: I have work colleagues (indicated by red ribs), drinking buddies (blue ribs) and badminton partners (green ribs).
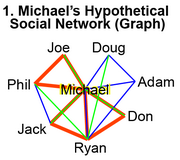 What is my social life like? I have colleagues in Lithium (Phil and Joe, who are also colleagues for each other). And before I came to work at Litium, I worked with Jack and Ryan at the University of California at Berkeley. And before that, I worked with Ryan and Don at the Los Alamos National Library. Ryan came to Berkeley with me getting a PhD ( a PhD), so we crossed paths at two jobs. That is why Ryan also worked with Jack and Don, but who are not colleagues for each other.
Another part of my social life is connected with my drinking buddies. I often went to drink with Doug, Adam and Ryan during graduate school. However, Ryan and Doug never remained alone with each other and never went anywhere together. When I came to Litium, I found out that Phil and Jack often drink together, but I never did this with any of them.
Finally, I love badminton. Everywhere I worked, I found myself a badminton partner. I played with Joe in Litium, with Jack in Berkeley, and with Don in Los Alamos. Ryan also plays badminton - with Phil and Doug. However, they play much better than me, so I never played with any of them.
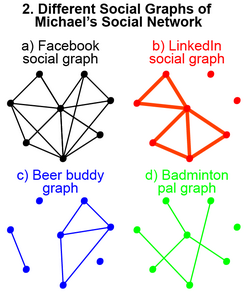 If you imagine all my seven friends on Facebook, then our friendship graph would look like Figure 2a. Black edges indicate friendship, or rather people who are familiar with each other. But if you want to see my professional network, then my social graph will look like the one shown in Figure 2b. In this case, red ribs indicate my relationship with my work colleagues. Please note that Adam and Doug are not included in my professional network (there are no red edges between us), because we never worked together.
The graph of my drinking buddies is shown in Figure 2c (where the blue ribs indicate the fact that we are drinking together) and includes Doug, Adam and Ryan, since I have never had a drink with any of my other friends. And despite the fact that Jack and Phil drink together, I never did this with them, so there are no blue ribs between us. Thus, Jack and Phil find themselves in a completely separate network of booze.
Finally, the graph of my badminton partners is shown in Figure 2d, where the green edges indicate relationships based on a game of badminton playing together. Only Jack, Joe and Don are included in my badminton net. Ryan has his own network, consisting of Phil and Doug, and none of them are included in my network.
Notice, we built four different social graphs from the same social network consisting of eight people. By asking what the faces will indicate, we get our own special graph with its own special metrics. For example, if we decide that the faces should indicate a fun pastime, we will build another, completely different social graph, which will look like the intersection of my drinking buddy count and the badminton partners graph (of course, working in Lithium also brings a lot of fun, but I I'm simplifying things now). Thus, due to the fact that there are many different relationships between people, many different social graphs can be built.
Therefore, the most important thing to do before interpreting any social graph is to understand what type of relationship its faces represent.This is perhaps even more important than understanding what peaks mean. In SNA, entities denoted by vertices will usually always be people, but 99% of all metrics in a graph will depend heavily on its faces. Therefore, if the measured ratio depicted by the faces changes, the metrics will also change.
For example, a simple metric is the graph degree centrality ( degree centrality) showing how many links the vertex has. So, in total there are 7 black faces (Figure 2a), i.e. I have 7 friends. In this case, there are only 5 red faces (Figure 2b), i.e. I have 5 colleagues. My degree of centrality in the drinking buddy graph is 3 (Figure 2c), while I have only 3 drinking buddies. The degree of centrality can be calculated for all people on the graph. For example, Ryan’s centrality in the graph of badminton partners is 2 (Figure 2d).
The interpretation of graph metrics also depends on the relationship of the faces. So, we can’t find out how many colleagues I have by looking at the friends graph (Figure 2a), because relationships with work colleagues do not appear on the friends graph. And even if we assume that everyone with whom I work becomes my friend, relying only on the graph of friends, we can only say that I can have any number of colleagues, from zero to seven. Therefore, never draw conclusions or conclusions about existing relationships based on a graph in which these relationships are not explicitly expressed in its faces. By doing so, you will just guess the coffee grounds or make random assumptions.
In the following publications, using specific live data as an example, we will try to apply the methods of social network analysis to identify and measure social influence within social networks.
To understand what a "social-network analysis" ( List Social the Network an Analysis , an SNA), you need to understand what a "social network" and what is "social graph." Simply put, social network analysis is a way of studying social networks, and a social network is a set of entities between which there are certain relationships. Social networks have existed since people began to roam the earth. In truth, not only humans have such structures, but also social animals (for example, wolves, lions, dolphins, mice, and even ants).
Of course, we are primarily interested in such entities as people, and such relationships between them as friendship (like on Facebook), teamwork (like on LinkedIn), kinship, communication, and some other social interactions. And in the context of SNA, we can mean by a social graph just a visualization of all this (I'm not going to catch up with the formal definition of a graph ). In such a social graph, each point (or node, or vertex) represents a person, and the edge between two points (people) represents the relationship between them. And since there are many different relationships between people, just as there are many different social graphs depicting these relationships. I will show this with a concrete example.
Representative social network and its social graph
Let's assume that I, Michael, have a very small social network consisting of only seven friends (see Figure 1). Suppose further that I have a very simple life in which I maintain only three types of social relations: I have work colleagues (indicated by red ribs), drinking buddies (blue ribs) and badminton partners (green ribs).
What is my social life like? I have colleagues in Lithium (Phil and Joe, who are also colleagues for each other). And before I came to work at Litium, I worked with Jack and Ryan at the University of California at Berkeley. And before that, I worked with Ryan and Don at the Los Alamos National Library. Ryan came to Berkeley with me getting a PhD ( a PhD), so we crossed paths at two jobs. That is why Ryan also worked with Jack and Don, but who are not colleagues for each other. Another part of my social life is connected with my drinking buddies. I often went to drink with Doug, Adam and Ryan during graduate school. However, Ryan and Doug never remained alone with each other and never went anywhere together. When I came to Litium, I found out that Phil and Jack often drink together, but I never did this with any of them.
Finally, I love badminton. Everywhere I worked, I found myself a badminton partner. I played with Joe in Litium, with Jack in Berkeley, and with Don in Los Alamos. Ryan also plays badminton - with Phil and Doug. However, they play much better than me, so I never played with any of them.
If you imagine all my seven friends on Facebook, then our friendship graph would look like Figure 2a. Black edges indicate friendship, or rather people who are familiar with each other. But if you want to see my professional network, then my social graph will look like the one shown in Figure 2b. In this case, red ribs indicate my relationship with my work colleagues. Please note that Adam and Doug are not included in my professional network (there are no red edges between us), because we never worked together.The graph of my drinking buddies is shown in Figure 2c (where the blue ribs indicate the fact that we are drinking together) and includes Doug, Adam and Ryan, since I have never had a drink with any of my other friends. And despite the fact that Jack and Phil drink together, I never did this with them, so there are no blue ribs between us. Thus, Jack and Phil find themselves in a completely separate network of booze.
Finally, the graph of my badminton partners is shown in Figure 2d, where the green edges indicate relationships based on a game of badminton playing together. Only Jack, Joe and Don are included in my badminton net. Ryan has his own network, consisting of Phil and Doug, and none of them are included in my network.
Reading and interpreting a social graph
Notice, we built four different social graphs from the same social network consisting of eight people. By asking what the faces will indicate, we get our own special graph with its own special metrics. For example, if we decide that the faces should indicate a fun pastime, we will build another, completely different social graph, which will look like the intersection of my drinking buddy count and the badminton partners graph (of course, working in Lithium also brings a lot of fun, but I I'm simplifying things now). Thus, due to the fact that there are many different relationships between people, many different social graphs can be built.
Therefore, the most important thing to do before interpreting any social graph is to understand what type of relationship its faces represent.This is perhaps even more important than understanding what peaks mean. In SNA, entities denoted by vertices will usually always be people, but 99% of all metrics in a graph will depend heavily on its faces. Therefore, if the measured ratio depicted by the faces changes, the metrics will also change.
For example, a simple metric is the graph degree centrality ( degree centrality) showing how many links the vertex has. So, in total there are 7 black faces (Figure 2a), i.e. I have 7 friends. In this case, there are only 5 red faces (Figure 2b), i.e. I have 5 colleagues. My degree of centrality in the drinking buddy graph is 3 (Figure 2c), while I have only 3 drinking buddies. The degree of centrality can be calculated for all people on the graph. For example, Ryan’s centrality in the graph of badminton partners is 2 (Figure 2d).
The interpretation of graph metrics also depends on the relationship of the faces. So, we can’t find out how many colleagues I have by looking at the friends graph (Figure 2a), because relationships with work colleagues do not appear on the friends graph. And even if we assume that everyone with whom I work becomes my friend, relying only on the graph of friends, we can only say that I can have any number of colleagues, from zero to seven. Therefore, never draw conclusions or conclusions about existing relationships based on a graph in which these relationships are not explicitly expressed in its faces. By doing so, you will just guess the coffee grounds or make random assumptions.
In the following publications, using specific live data as an example, we will try to apply the methods of social network analysis to identify and measure social influence within social networks.