Why Skylake processors sometimes work 2 times slower
- Transfer
I was informed that on new computers some regression tests became slower. The usual thing, it happens. Incorrect configuration somewhere in Windows or not the most optimal values in the BIOS. But this time we could not manage to find that “knocked down” setting. Since the change is significant: 9 vs. 19 seconds (on the chart, blue is the old iron, and orange is the new one), we had to dig deeper.
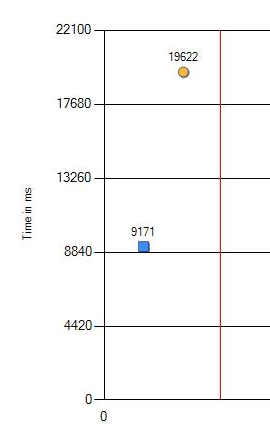
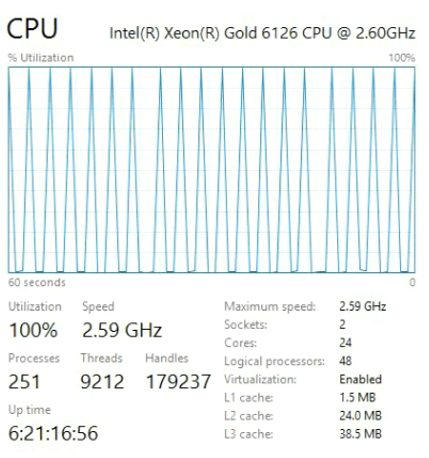
The performance drop from 9.1 to 19.6 seconds can definitely be called significant. We carried out additional checks with the change of versions of the tested programs, Windows and BIOS settings. But no, the result has not changed. The only difference was manifested only on different processors. Below is the result on the latest CPU.
And here is the one that is used for comparison.

Xeon Gold has been working on another architecture called Skylake, common to new Intel processors since mid-2017. If you buy the latest hardware, you will get a processor with Skylake architecture. These are good cars, but, as tests have shown, novelty and speed are not the same thing.
If nothing else helps, then you need to use a profiler for in-depth research. Let's test the old and new equipment and get something like this:
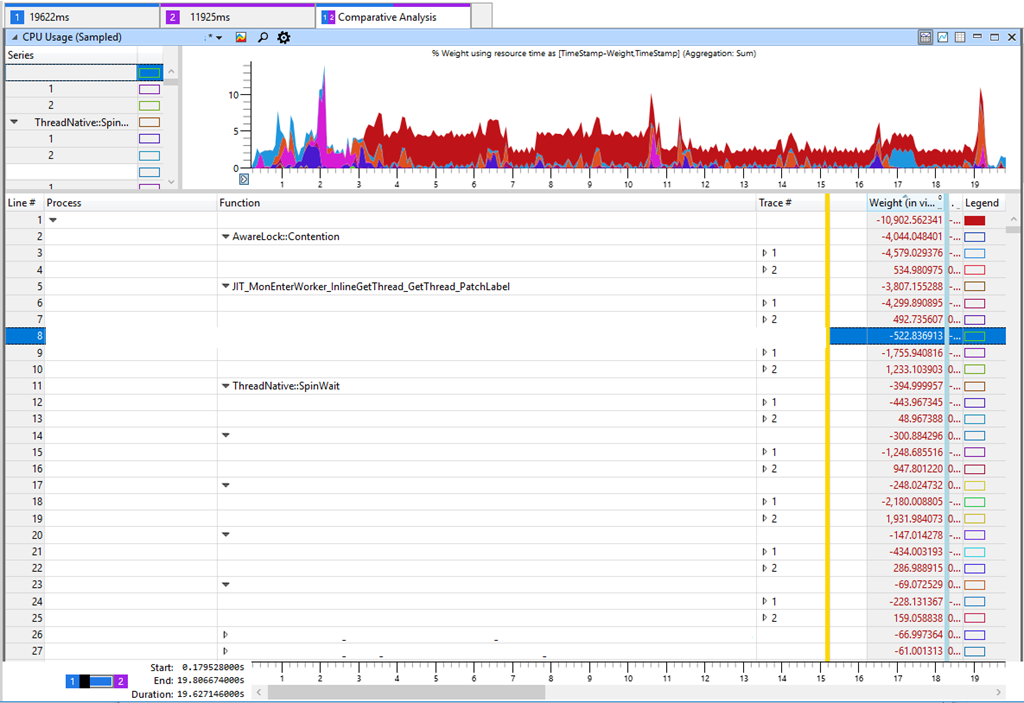
The tab in Windows Performance Analyzer (WPA) shows in the table the difference between Trace 2 (11 s) and Trace 1 (19 s). A negative difference in the table corresponds to an increase in CPU consumption in a slower test. If you look at the most significant differences in CPU consumption, you will see AwareLock :: Contention , JIT_MonEnterWorker_InlineGetThread_GetThread_PatchLabel and ThreadNative.SpinWait. Everything points to “spinning” in the CPU [spinning (spinning) - a cyclical attempt to get a lock, approx. lane] when threads are fighting for locks. But this is a false mark, because spinning is not the main cause of reduced performance. Intense competition for locks means that something in our software has slowed down and kept the lock, which as a result has led to an increase in spinning in the CPU. I checked the lock time and other key indicators, such as disk indicators, but could not find anything meaningful that would explain the performance degradation. Although this is not logical, but I returned to increasing the load on the CPU in various methods.
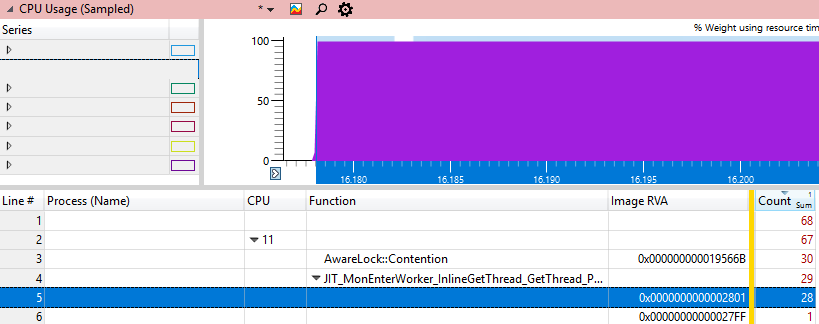
It would be interesting to find exactly where the processor is stuck. WPA has file # and line # columns, but they only work with private characters that we don’t have, because this is the .NET Framework code. The next best thing we can do is get the dll address where the instruction called Image RVA is located. If we load this dll into the debugger and
we must see the instruction that burns most CPU cycles, because this will be the only hot address.
We will explore this address with various Windbg methods: And with various JIT methods:
Now we have a template. In one case, the hot address is a jump instruction, and in the other case it is a subtraction. But the two general instructions are preceded by the same general pause instruction. Different methods perform the same processor instruction, which for some reason takes a very long time. Let's measure the speed of the pause instruction and see if we reason correctly.
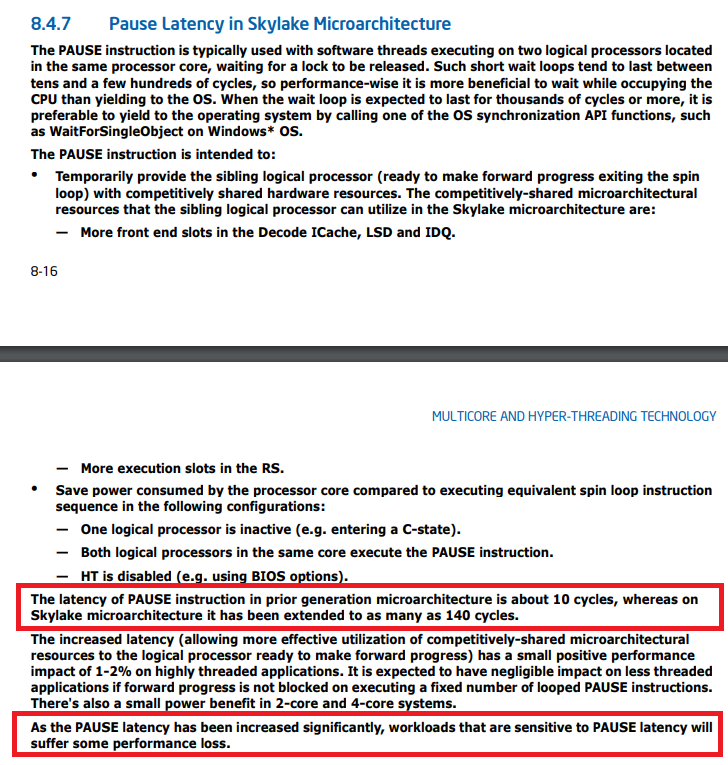
Pause in the new processors Skylake runs much longer. Of course, anything can get faster, and sometimes a little slower. But ten times slower? This is more like a bug. A small search on the Internet for a pause instruction leads to Intel's leadership , where the Skylake microarchitecture and pause instruction are explicitly mentioned:
No, this is not an error, this is a documented function. There is even a page indicating the execution time of almost all processor instructions.
Here is the number of processor cycles. To calculate the actual time, you need to divide the number of cycles by the processor frequency (usually in GHz) and get the time in nanoseconds.
This means that if you run highly multithreaded applications on .NET on the last hardware, they can work much slower. Someone has already noticed this and registered a bug back in August 2017 . The problem was fixed in .NET Core 2.1 and .NET Framework 4.8 Preview.
But since before the release of .NET 4.8 another year, I asked backport fixes, so that .NET 4.7.2 would return to normal speed on the new processors. Since there is a mutually exclusive blocking (spinlock) in many parts of .NET, you should track the increased load on the CPU when Thread.SpinWait and other spinning methods are used.

For example, Task.Result uses spinning internally, so I foresee a significant increase in CPU load and a decrease in performance in other tests.
I looked at the .NET Core code for how much the processor would continue spinning if the lock was not released before calling WaitForSingleObject to pay for “expensive” context switching. A context switch takes up to a microsecond or much more if many threads are waiting for the same kernel object.
.NET locks multiply the maximum spinning duration by the number of cores, if we take the absolute case, where the flow on each core waits for the same lock, and the spinning lasts long enough for everyone to do a little work before paying for the core call. Spinning in .NET uses an exponential extract algorithm when it starts with a cycle of 50 pause calls, where for each iteration the number of spins is tripled until the next spin counter exceeds their maximum duration. I calculated the total spinning duration per processor for different processors and different number of cores:
Below is the simplified spinning code in .NET Locks:
Previously, the spinning time was in the millisecond interval (19 ms for 24 cores), which is already quite a lot compared to the mentioned context switching time, which is an order of magnitude faster. But in the Skylake processors, the total spinning time for the processor simply explodes up to 246 ms on a 24-core or 48-core machine simply because the pause instruction has slowed down 14 times. Is this really true? I wrote a small tester to check the total spinning on the CPU - and the calculated numbers are well in line with expectations. Here are 48 threads on a 24-core CPU, waiting for one lock, which I called Monitor.PulseAll:
Only one stream will win the race, but 47 will continue spinning until they lose their pulse. This is experimental evidence that we do have a problem with the load on the CPU and the very long spinning is real. It undermines scalability, because these cycles go in lieu of the useful work of other threads, although the pause instruction frees up some of the shared CPU resources, ensuring that you fall asleep for a longer time. The reason for spinning is an attempt to get a lock faster without accessing the core. If so, then increasing the load on the CPU would be only nominal, but did not affect the performance at all, because the cores are engaged in other tasks. But the tests showed a decrease in performance in almost single-threaded operations, where one thread adds something to the work queue, while the worker thread is waiting for the result,
The reason is easiest to show on the diagram. Spin for competitive blocking occurs with tripling of the spinning at each step. After each round, the lock is checked again to see if the current thread can get it. Although spinning tries to be honest and occasionally switches to other streams to help them complete their work. This increases the chances of releasing the lock on the next check. The problem is that the check for a take is possible only after the completion of a full spin-round:

For example, if at the start of the fifth spin-round a lock signals availability, it can only be taken after the end of the round. By calculating the duration of the spin of the last round, we can estimate the worst case of delay for our flow:

Many milliseconds of waiting until the end of the spinning. Is this a real problem?
I created a simple test application that implements a producer-consumer queue, where the workflow performs each work item 10 ms, and the consumer has a delay of 1-9 ms before the next work item. This is enough to see the effect:
We see a total duration of 2.2-2.3 s for delays of 1-2 ms, while in other cases the work is performed faster up to 1.2 s. This shows that excessive spinning on the CPU is not just a cosmetic problem of excessively multi-threaded applications. It really hurts the simple threading of the producer-consumer, which includes only two streams. For the run above, the ETW data speaks for itself: it is the growth of the spinning that causes the observed delay:
If you look closely at the section with “brakes”, we will see 11 ms of spinning in the red area, although the worker (light blue) finished his work and gave the lock a long time ago.
The fast non-degenerative case looks much better, here only 1 ms is spent spinning to block.
I used the SkylakeXPause test application . The zip archive contains source code and binaries for .NET Core and .NET 4.5. For comparison, I installed .NET 4.8 Preview with fixes and .NET Core 2.0, which still implements the old behavior. The application is designed for .NET Standard 2.0 and .NET 4.5, producing both exe and dll. Now you can check the old and new behavior of the spinning side by side without the need to correct anything, so it is very convenient.
This is not a .NET problem. All spinlock implementations using the pause instruction are affected. I quickly checked the kernel of Windows Server 2016, but there is no such problem on the surface. It seems that Intel was kind enough - and hinted that some changes are needed in the approach to spinning.
A bug for .NET Core was reported in August 2017, and already in September 2017 a patch was released.and .NET Core version 2.0.3. The link shows not only the excellent reaction of the .NET Core group, but also the fact that a few days ago the problem was fixed in the main branch, as well as a discussion about additional optimization of the spinning. Unfortunately, the Desktop .NET Framework is not moving so fast, but in the face of the .NET Framework 4.8 Preview, we have at least conceptual proof that the fixes are also realizable there. Now I am waiting for the backend for .NET 4.7.2 to use .NET at full speed and on the latest hardware. This is the first bug I found that is directly related to performance changes due to a single CPU instruction. ETW remains the primary profiler in Windows. If I could, I would ask Microsoft to port the ETW infrastructure to Linux, because the current profilers on Linux are still slopy.
If you are working with .NET Core 2.0 or the .NET Framework on the latest processors that have been released since mid-2017, then in case of performance problems you should definitely check your applications with a profiler - and upgrade to .NET Core and, I hope, soon .NET Desktop. My test application will tell you about the presence or absence of a problem. or The tool will report a problem if you are working on the .NET Framework without a corresponding update and on the Skylake processor.
I hope you find the investigation of this problem as interesting as it was to me. To truly understand the problem, you need to create a playback tool that allows you to experiment and look for influencing factors. The rest is just a boring job, but now I am much better versed in the causes and consequences of the cyclic attempt to get a lock in the CPU.
The same OS, same hardware, another processor: 2 times slower
The performance drop from 9.1 to 19.6 seconds can definitely be called significant. We carried out additional checks with the change of versions of the tested programs, Windows and BIOS settings. But no, the result has not changed. The only difference was manifested only on different processors. Below is the result on the latest CPU.
And here is the one that is used for comparison.
Xeon Gold has been working on another architecture called Skylake, common to new Intel processors since mid-2017. If you buy the latest hardware, you will get a processor with Skylake architecture. These are good cars, but, as tests have shown, novelty and speed are not the same thing.
If nothing else helps, then you need to use a profiler for in-depth research. Let's test the old and new equipment and get something like this:
The tab in Windows Performance Analyzer (WPA) shows in the table the difference between Trace 2 (11 s) and Trace 1 (19 s). A negative difference in the table corresponds to an increase in CPU consumption in a slower test. If you look at the most significant differences in CPU consumption, you will see AwareLock :: Contention , JIT_MonEnterWorker_InlineGetThread_GetThread_PatchLabel and ThreadNative.SpinWait. Everything points to “spinning” in the CPU [spinning (spinning) - a cyclical attempt to get a lock, approx. lane] when threads are fighting for locks. But this is a false mark, because spinning is not the main cause of reduced performance. Intense competition for locks means that something in our software has slowed down and kept the lock, which as a result has led to an increase in spinning in the CPU. I checked the lock time and other key indicators, such as disk indicators, but could not find anything meaningful that would explain the performance degradation. Although this is not logical, but I returned to increasing the load on the CPU in various methods.
It would be interesting to find exactly where the processor is stuck. WPA has file # and line # columns, but they only work with private characters that we don’t have, because this is the .NET Framework code. The next best thing we can do is get the dll address where the instruction called Image RVA is located. If we load this dll into the debugger and
u xxx.dll+ImageRVAwe must see the instruction that burns most CPU cycles, because this will be the only hot address.
We will explore this address with various Windbg methods: And with various JIT methods:
0:000> u clr.dll+0x19566B-10

clr!AwareLock::Contention+0x135:

00007ff8`0535565b f00f4cc6 lock cmovl eax,esi

00007ff8`0535565f 2bf0 sub esi,eax

00007ff8`05355661 eb01 jmp clr!AwareLock::Contention+0x13f (00007ff8`05355664)

00007ff8`05355663 cc int 3

00007ff8`05355664 83e801 sub eax,1

00007ff8`05355667 7405 je clr!AwareLock::Contention+0x144 (00007ff8`0535566e)

00007ff8`05355669 f390 pause

00007ff8`0535566b ebf7 jmp clr!AwareLock::Contention+0x13f (00007ff8`05355664)
0:000> u clr.dll+0x2801-10
clr!JIT_MonEnterWorker_InlineGetThread_GetThread_PatchLabel+0x124:
00007ff8`051c27f1 5e pop rsi
00007ff8`051c27f2 c3 ret
00007ff8`051c27f3 833d0679930001 cmp dword ptr [clr!g_SystemInfo+0x20 (00007ff8`05afa100)],1
00007ff8`051c27fa 7e1b jle clr!JIT_MonEnterWorker_InlineGetThread_GetThread_PatchLabel+0x14a (00007ff8`051c2817)
00007ff8`051c27fc 418bc2 mov eax,r10d
00007ff8`051c27ff f390 pause
00007ff8`051c2801 83e801 sub eax,1
00007ff8`051c2804 75f9 jne clr!JIT_MonEnterWorker_InlineGetThread_GetThread_PatchLabel+0x132 (00007ff8`051c27ff)Now we have a template. In one case, the hot address is a jump instruction, and in the other case it is a subtraction. But the two general instructions are preceded by the same general pause instruction. Different methods perform the same processor instruction, which for some reason takes a very long time. Let's measure the speed of the pause instruction and see if we reason correctly.
If the problem is documented, it becomes a feature.
| CPU | pause in nanoseconds |
| Xeon E5 1620v3 3.5 GHz | four |
| Xeon® Gold 6126 @ 2.60 GHz | 43 |
Pause in the new processors Skylake runs much longer. Of course, anything can get faster, and sometimes a little slower. But ten times slower? This is more like a bug. A small search on the Internet for a pause instruction leads to Intel's leadership , where the Skylake microarchitecture and pause instruction are explicitly mentioned:
No, this is not an error, this is a documented function. There is even a page indicating the execution time of almost all processor instructions.
- Sandy Bridge 11
- Ivy bridege 10
- Haswell 9
- Broadwell 9
- SkylakeX 141
Here is the number of processor cycles. To calculate the actual time, you need to divide the number of cycles by the processor frequency (usually in GHz) and get the time in nanoseconds.
This means that if you run highly multithreaded applications on .NET on the last hardware, they can work much slower. Someone has already noticed this and registered a bug back in August 2017 . The problem was fixed in .NET Core 2.1 and .NET Framework 4.8 Preview.
Improved spin-wait in several synchronization primitives for better performance on Intel Skylake and later microarchitectures. [495945, mscorlib.dll, bug]
But since before the release of .NET 4.8 another year, I asked backport fixes, so that .NET 4.7.2 would return to normal speed on the new processors. Since there is a mutually exclusive blocking (spinlock) in many parts of .NET, you should track the increased load on the CPU when Thread.SpinWait and other spinning methods are used.
For example, Task.Result uses spinning internally, so I foresee a significant increase in CPU load and a decrease in performance in other tests.
How bad is it?
I looked at the .NET Core code for how much the processor would continue spinning if the lock was not released before calling WaitForSingleObject to pay for “expensive” context switching. A context switch takes up to a microsecond or much more if many threads are waiting for the same kernel object.
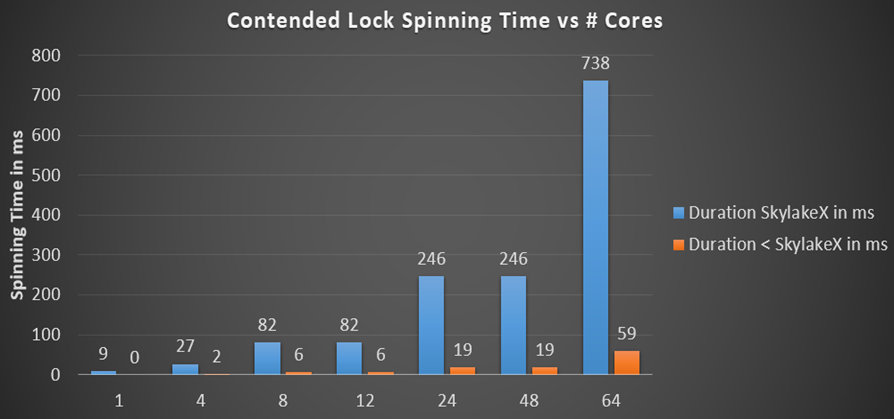
.NET locks multiply the maximum spinning duration by the number of cores, if we take the absolute case, where the flow on each core waits for the same lock, and the spinning lasts long enough for everyone to do a little work before paying for the core call. Spinning in .NET uses an exponential extract algorithm when it starts with a cycle of 50 pause calls, where for each iteration the number of spins is tripled until the next spin counter exceeds their maximum duration. I calculated the total spinning duration per processor for different processors and different number of cores:
Below is the simplified spinning code in .NET Locks:
///<summary>/// This is how .NET is spinning during lock contention minus the Lock taking/SwitchToThread/Sleep calls///</summary>///<param name="nCores"></param>voidSpin(int nCores)
{
	constint dwRepetitions = 10;
	constint dwInitialDuration = 0x32;
	constint dwBackOffFactor = 3;
	int dwMaximumDuration = 20 * 1000 * nCores;
	for (int i = 0; i < dwRepetitions; i++)
	{
		int duration = dwInitialDuration;
		do
		{
			for (int k = 0; k < duration; k++)
			{
				Call_PAUSE();
			}
			duration *= dwBackOffFactor;
		}
		while (duration < dwMaximumDuration);
	}
}
Previously, the spinning time was in the millisecond interval (19 ms for 24 cores), which is already quite a lot compared to the mentioned context switching time, which is an order of magnitude faster. But in the Skylake processors, the total spinning time for the processor simply explodes up to 246 ms on a 24-core or 48-core machine simply because the pause instruction has slowed down 14 times. Is this really true? I wrote a small tester to check the total spinning on the CPU - and the calculated numbers are well in line with expectations. Here are 48 threads on a 24-core CPU, waiting for one lock, which I called Monitor.PulseAll:
Only one stream will win the race, but 47 will continue spinning until they lose their pulse. This is experimental evidence that we do have a problem with the load on the CPU and the very long spinning is real. It undermines scalability, because these cycles go in lieu of the useful work of other threads, although the pause instruction frees up some of the shared CPU resources, ensuring that you fall asleep for a longer time. The reason for spinning is an attempt to get a lock faster without accessing the core. If so, then increasing the load on the CPU would be only nominal, but did not affect the performance at all, because the cores are engaged in other tasks. But the tests showed a decrease in performance in almost single-threaded operations, where one thread adds something to the work queue, while the worker thread is waiting for the result,
The reason is easiest to show on the diagram. Spin for competitive blocking occurs with tripling of the spinning at each step. After each round, the lock is checked again to see if the current thread can get it. Although spinning tries to be honest and occasionally switches to other streams to help them complete their work. This increases the chances of releasing the lock on the next check. The problem is that the check for a take is possible only after the completion of a full spin-round:
For example, if at the start of the fifth spin-round a lock signals availability, it can only be taken after the end of the round. By calculating the duration of the spin of the last round, we can estimate the worst case of delay for our flow:
Many milliseconds of waiting until the end of the spinning. Is this a real problem?
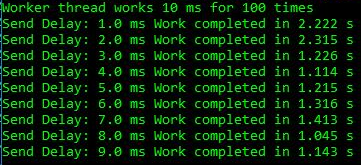
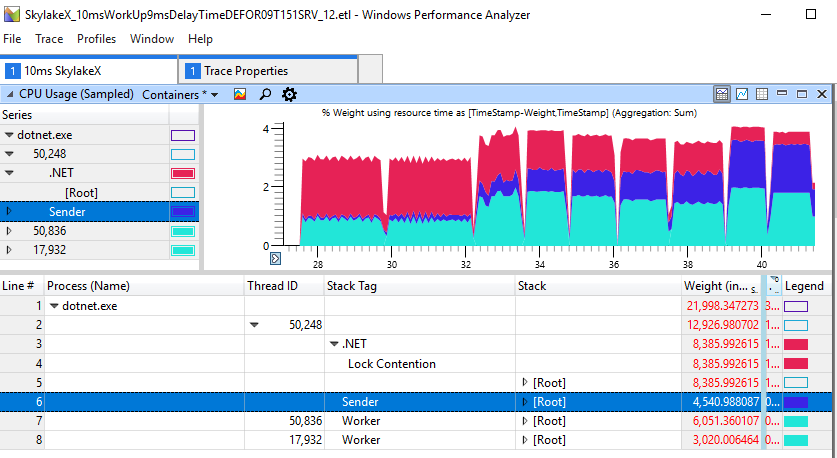
I created a simple test application that implements a producer-consumer queue, where the workflow performs each work item 10 ms, and the consumer has a delay of 1-9 ms before the next work item. This is enough to see the effect:
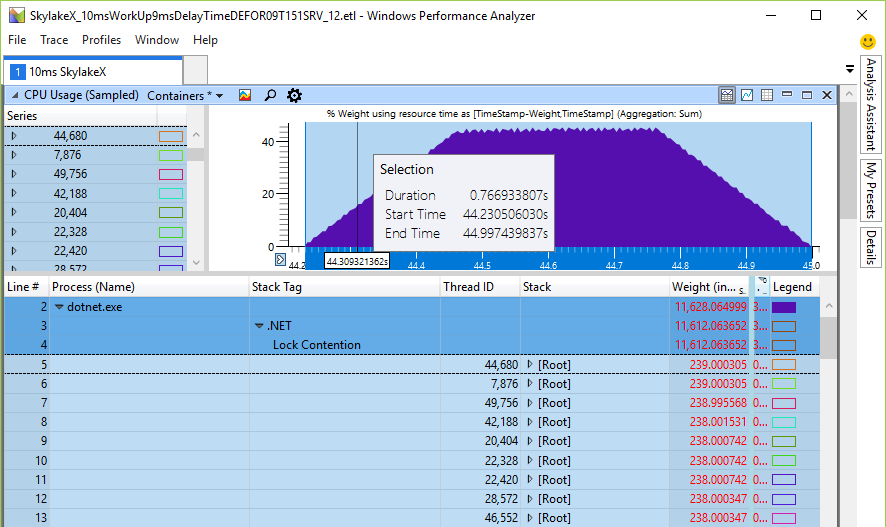
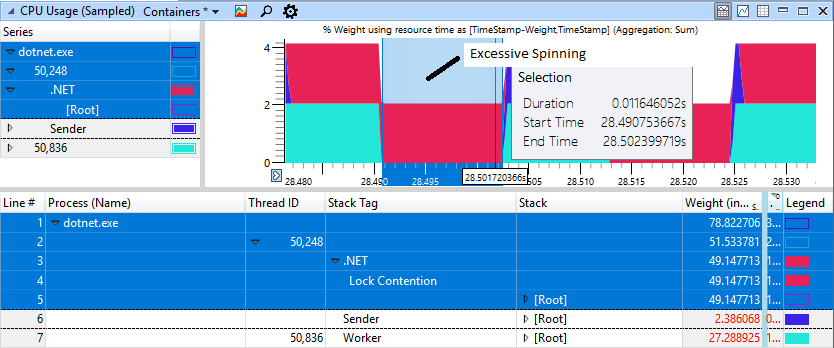
We see a total duration of 2.2-2.3 s for delays of 1-2 ms, while in other cases the work is performed faster up to 1.2 s. This shows that excessive spinning on the CPU is not just a cosmetic problem of excessively multi-threaded applications. It really hurts the simple threading of the producer-consumer, which includes only two streams. For the run above, the ETW data speaks for itself: it is the growth of the spinning that causes the observed delay:
If you look closely at the section with “brakes”, we will see 11 ms of spinning in the red area, although the worker (light blue) finished his work and gave the lock a long time ago.
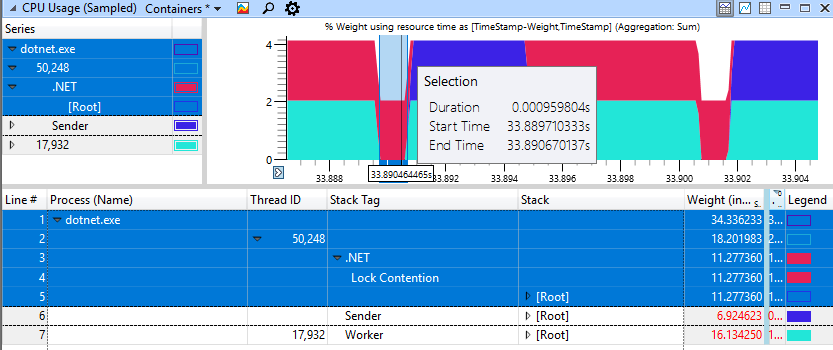
The fast non-degenerative case looks much better, here only 1 ms is spent spinning to block.
I used the SkylakeXPause test application . The zip archive contains source code and binaries for .NET Core and .NET 4.5. For comparison, I installed .NET 4.8 Preview with fixes and .NET Core 2.0, which still implements the old behavior. The application is designed for .NET Standard 2.0 and .NET 4.5, producing both exe and dll. Now you can check the old and new behavior of the spinning side by side without the need to correct anything, so it is very convenient.
readonlyobject _LockObject = newobject();
int WorkItems;
int CompletedWorkItems;
Barrier SyncPoint;
voidRunSlowTest()
{
	constint processingTimeinMs = 10;
	constint WorkItemsToSend = 100;
	Console.WriteLine($"Worker thread works {processingTimeinMs} ms for {WorkItemsToSend} times");
	// Test one sender one receiver thread with different timings when the sender wakes up again// to send the next work item// synchronize worker and sender. Ensure that worker starts firstdouble[] sendDelayTimes = { 1, 2, 3, 4, 5, 6, 7, 8, 9 };
	foreach (var sendDelay in sendDelayTimes)
	{
		SyncPoint = new Barrier(2);  // one sender one receivervar sw = Stopwatch.StartNew();
		Parallel.Invoke(() => Sender(workItems: WorkItemsToSend,          delayInMs: sendDelay),
						() => Worker(maxWorkItemsToWork: WorkItemsToSend, workItemProcessTimeInMs: processingTimeinMs));
		sw.Stop();
		Console.WriteLine($"Send Delay: {sendDelay:F1} ms Work completed in {sw.Elapsed.TotalSeconds:F3} s");
		Thread.Sleep(100);  // show some gap in ETW data so we can differentiate the test runs
	}
}
///<summary>/// Simulate a worker thread which consumes CPU which is triggered by the Sender thread///</summary>voidWorker(int maxWorkItemsToWork, double workItemProcessTimeInMs)
{
	SyncPoint.SignalAndWait();
	while (CompletedWorkItems != maxWorkItemsToWork)
	{
		lock (_LockObject)
		{
			if (WorkItems == 0)
			{
				Monitor.Wait(_LockObject); // wait for work
			}
			for (int i = 0; i < WorkItems; i++)
			{
				CompletedWorkItems++;
				SimulateWork(workItemProcessTimeInMs); // consume CPU under this lock
			}
			WorkItems = 0;
		}
	}
}
///<summary>/// Insert work for the Worker thread under a lock and wake up the worker thread n times///</summary>voidSender(int workItems, double delayInMs)
{
	CompletedWorkItems = 0; // delete previous work
	SyncPoint.SignalAndWait();
	for (int i = 0; i < workItems; i++)
	{
		lock (_LockObject)
		{
			WorkItems++;
			Monitor.PulseAll(_LockObject);
		}
		SimulateWork(delayInMs);
	}
}
findings
This is not a .NET problem. All spinlock implementations using the pause instruction are affected. I quickly checked the kernel of Windows Server 2016, but there is no such problem on the surface. It seems that Intel was kind enough - and hinted that some changes are needed in the approach to spinning.
A bug for .NET Core was reported in August 2017, and already in September 2017 a patch was released.and .NET Core version 2.0.3. The link shows not only the excellent reaction of the .NET Core group, but also the fact that a few days ago the problem was fixed in the main branch, as well as a discussion about additional optimization of the spinning. Unfortunately, the Desktop .NET Framework is not moving so fast, but in the face of the .NET Framework 4.8 Preview, we have at least conceptual proof that the fixes are also realizable there. Now I am waiting for the backend for .NET 4.7.2 to use .NET at full speed and on the latest hardware. This is the first bug I found that is directly related to performance changes due to a single CPU instruction. ETW remains the primary profiler in Windows. If I could, I would ask Microsoft to port the ETW infrastructure to Linux, because the current profilers on Linux are still slopy.
If you are working with .NET Core 2.0 or the .NET Framework on the latest processors that have been released since mid-2017, then in case of performance problems you should definitely check your applications with a profiler - and upgrade to .NET Core and, I hope, soon .NET Desktop. My test application will tell you about the presence or absence of a problem. or The tool will report a problem if you are working on the .NET Framework without a corresponding update and on the Skylake processor.
D:\SkylakeXPause\bin\Release\netcoreapp2.0>dotnet SkylakeXPause.dll -check

Did call pause 1,000,000 in 3.5990 ms, Processors: 8

No SkylakeX problem detected
D:\SkylakeXPause\SkylakeXPause\bin\Release\net45>SkylakeXPause.exe -check
Did call pause 1,000,000 in 3.6195 ms, Processors: 8
No SkylakeX problem detectedI hope you find the investigation of this problem as interesting as it was to me. To truly understand the problem, you need to create a playback tool that allows you to experiment and look for influencing factors. The rest is just a boring job, but now I am much better versed in the causes and consequences of the cyclic attempt to get a lock in the CPU.