Augmented Reality Token Recognition
Augmented reality (AR) has been written in many articles. On the Habré there is a whole section devoted to this direction . In short, there are two fundamental approaches to creating augmented reality: using a pre-prepared marker ( yet ), which you need to print without . Both approaches using the algorithms of “computer vision” recognize objects in the frame and complement them.
This article is devoted to recognition algorithms when creating additional reality with a pre-prepared marker.
What could be a marker?
In theory, a marker can be any figure (object). But in practice, we are limited by the resolution of the webcam (phone), the features of color rendering, lighting and the processing power of the equipment (everything happens in real time, and therefore needs to be done quickly), and therefore a black-and-white marker of a simple form is usually chosen. As a rule, it is a rectangle or a square with an identifier image inscribed inside.
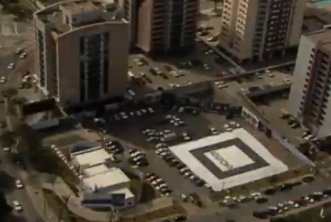
The article [1] describes the main types of markers, which may look like this:
ArToolKit (ATK) marker system.

Institut Graphische Datenverarbeitung (IGD) marker system.
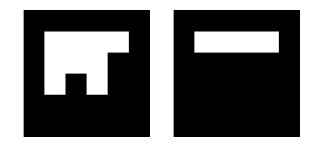
Siemens Corporate Research (SCR) marker system.
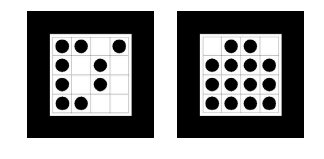
Ho ff man marker system (HOM) used by SCR and Framatome ANP.
The same article [1] compares the performance of different marker implementations and recognition.
Generalized marker recognition algorithm
In short, the marker recognition algorithm looks like this ( taken here ):
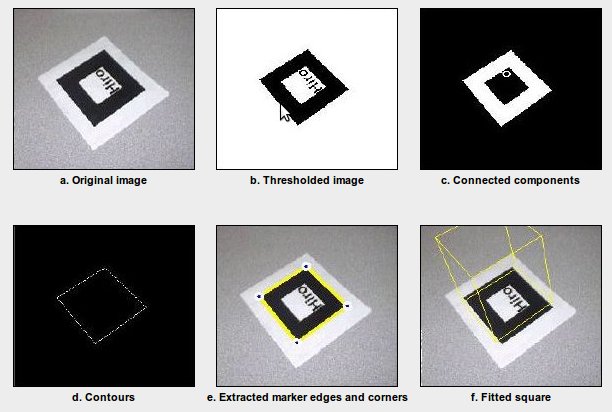
a) We present in grayscale.
b) Image binarization (threshold).
c) Definition of closed areas.
d) Select the contours.
e) Select the corners of the marker.
f) Transform the coordinates.
Let us consider in more detail what happens at each step with illustrations.
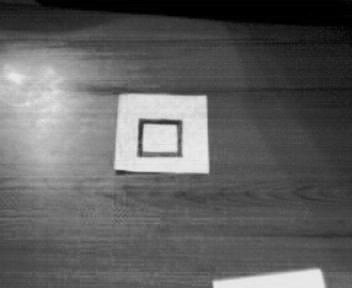
Grayscale color image translation
Here are three algorithms for translating a color image in grayscale.
1. Lightness
GS = (max (R, G, B) + min (R, G, B)) / 2
2. Luminosity
GS = 0.21 × R + 0.72 × G + 0.07 × B
3. Average
GS = (R + G + B) / 3
Here is an example of what these three methods look like. As a rule, they use “Luminosity”.
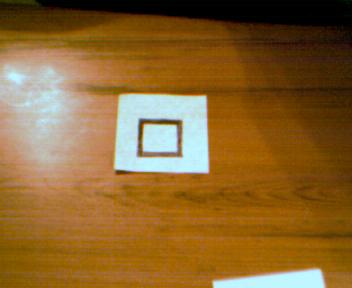
Original Image:
Lightness:

Luminosity:

Average:
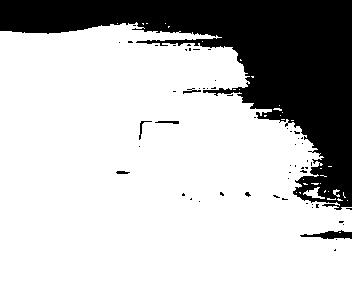
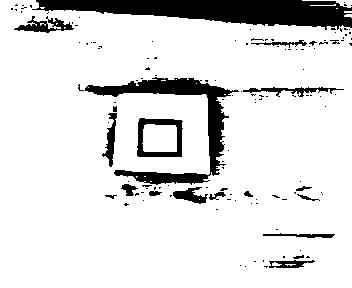
Binarization of the image. Threshold
It is transparent that a certain threshold is used to translate the image into a two-color state. The question is how and why this threshold is applied. The easiest way is to set a threshold. For example, if we have 256 colors, then we can set the threshold to 128. If we complicate things a bit, we can select the threshold using the color histogram. In general, all methods of converting an image into a b / w type can be divided into six large groups that are listed and classified in the article [2].
1) Methods based on the “form" of the histogram.
2) Methods based on clustering.
3) Methods based on the study of entropy.
4) Methods based on the search for similarities between gray and b / w image.
5) Methods using correlation dependencies and features of the statistical distribution between pixels in image areas.
6) Methods based on local adaptation of the threshold for each pixel in the image.
Most often, methods based on local adaptation are used. There are about forty binarization methods, if you compare them, you get another full-fledged article, so here is an example of binarizing an image with a given threshold, adaptive , as well as the Otsu method
Hard-set threshold:
Adaptive:
Otsu method:

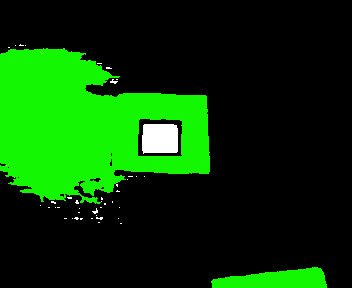
Definition of closed areas
We need to define closed areas on a white background. As a rule, there is a combination of algorithms, but in the general case, as a rule, “fill” algorithms for white areas are used and closed areas are distinguished.
Here is a person decides a similar problem and still . Variations are possible at this point. First, the contours are highlighted, and then checked for isolation. Perhaps this approach is faster.
Like this:
Or like that, we first selected the contours, then checked for isolation:

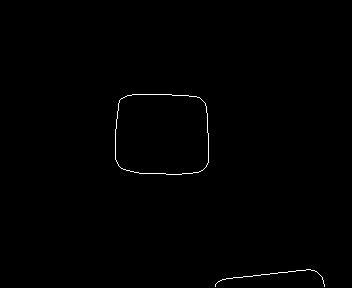
Outline selection
There are several approaches to the selection of contours in the image. I
’ll indicate the main ones found [3]: 1) Marr-Hildreth Edge Detector
2) Canny Edge Detector
3) Boolean function based Edge Detector
4) Euclidian distance and Vector Angle based Edge Detector
5) Depth Edge Detection using Multi-Flash Imaging
6) Sobel Edge Detector
Again, the material is quite voluminous; comparison and description of algorithms can take more than one page. Mostly the Canny and Sobel algorithm is used.
Inside the white closed areas we are looking for contours.
As a result of receiving such image
Canny (need to play with the parameters of the algorithm)
Sobel

Highlighting marker corners
Having selected a contour, it is necessary to compare it with our marker. Many different outlines can be highlighted in the image, we need to find something “similar” to a quadrangle.
To solve this problem, you can apply the Douglas-Pecker algorithm (aka the Ramer-Douglas-Pecker algorithm, the iterative nearest point algorithm, the split and merge algorithm), which allows you to reduce the number of points in the curve approximated by a larger series of points.
For example, openCV has the approxPolyDP function, which already does this. If we further process its result, then we get a completely suitable result.
So we got the coordinates of the corners of the marker.
Coordinate transformation
Now we have the coordinates of the corners of the marker, which, in essence, ideally are perpendicular, but in reality are located at a different angle. In addition, both ideally and in reality, the sides of the square are coordinate axes. Thus, we can determine the position of the "camera" relative to our object, and the reference point of the origin.
What is the basis for the method of determining coordinates can be shown graphically as follows [4]:
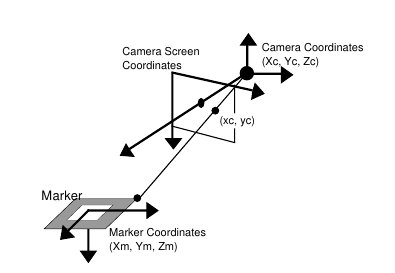
Those. The idea is that when you change the angle from which the camera is looking, the projection size changes. For example:
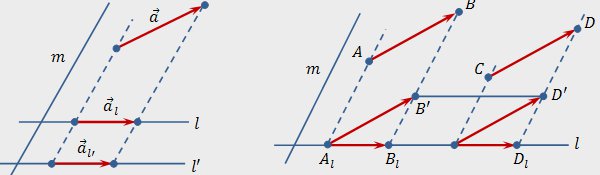
Drawings and basic information from here . The mathematics is described here [4]:
Knowing the position of the camera and the reference point, we can draw a projection for our 3D model. In this case, a cube.
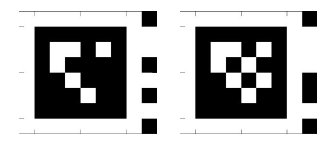
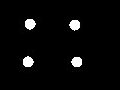
As you can see, if we use a square with a clean field as a marker, then it is symmetrical, and we can only recognize the rotation partially. Sometimes this is enough. If not, then we can add an additional marker inside the square, then it will look like this
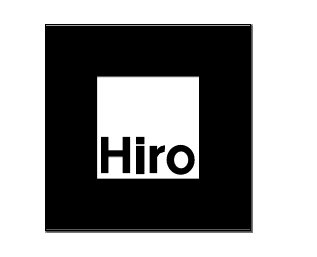
and get the rotation angle as well, using the Hough transform.
To build augmented reality, there are already libraries that can be used without having to go all this way again, for example ARToolkit and related to it.
This article was conceived as the first part of the augmented reality learning cycle. In the second part, if this will cause interest among Habrausers, I’m going to consider creating applications with augmented reality for Android. And then we can try to create augmented reality without a specially prepared marker.
Continued: How to use the webcam in the Android emulator
References
1.Xiang Zhang, Stephan Fronz, Nassir Navab. Visual Marker Detection and Decoding in AR Systems: A Comparative Study.
2.Mehmet Sezgin. Survey over image thresholding techniques and quantitative performance evaluation.
3.Ehsan Nadernejad. Edge Detection Techniques: Evaluations and Comparisons.
4.Hirokazu Kato, Mark Billinghurst. Marker Tracking and HMD Calibration for a Video-based Augmented Reality Conferencing System