Profiling Programs in QNX Momentics
General information
Eclipse-based QNX Momentics Professional Edition (PE) is a fully-featured and highly integrated professional development kit that contains everything you need to build and optimize applications for QNX Neutrino RTOS. With a wide range of convenient tools - from embedded on the processor board to remote diagnostics - the QNX Momentics PE kit provides a single, flexible software environment for the entire development cycle.
Software profiling provides a simple and convenient mechanism for examining program execution in order to optimize it. Profiling- This is a collection of characteristics of the program, such as the execution time of individual fragments of the program, the number of correctly predicted conditional transitions, etc. The tool used to analyze the work is called a profiler .
In this step -by - step guide, we profile the sy21 training, multi-threaded application using the QNX System Profiler and QNX Application Profiler tools to demonstrate the capabilities of the profiling tools in QNX Momentics.
Many pictures.
The Profiler shows the execution time of individual fragments of the program, allows you to see the amount of time that the program spends on each line and each function.
The System Profiler goes beyond conventional debuggers and code analyzers; it is a graphical system analysis tool that allows you to explore how all the components of a complex real-time system interact with each other. The result is additional convenience for users in terms of searching for errors and optimizing the code, as well as increasing the speed of work and greater predictability of the systems themselves.
The sy21 multi- threaded application built on semaphores (Semaphore is an object that allows no more than n threads to enter a given section of code) illustrates the operation of thread synchronization, within the framework of this manual it will allow to better demonstrate the work of the profiler.
Training
To work with this guide, you will need:
- QNX Momentics, to compile the application and perform the profiling itself (the manual uses the latest version - 6.5, but profiling tools are available from earlier versions)
- Installed by QNX Neutrino to run the compiled application (the manual uses the VMware Workstation virtual machine )
- Average knowledge of C ++
Profiling
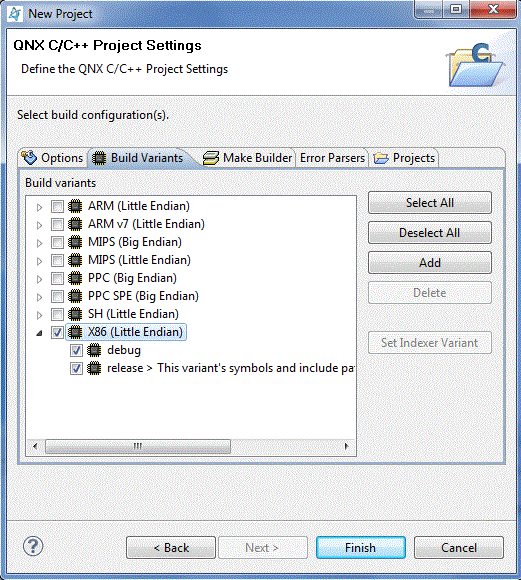
In QNX Momentics we will create a new QNX C ++ project, in the Buld Variants tab we will set the configuration
The project has been created, now we will compile the Project-> Build Project application , upon successful compilation we will see the following in the console window

Create the C / C ++ QNX QConn (ip) configuration to run the run- program > run configurations
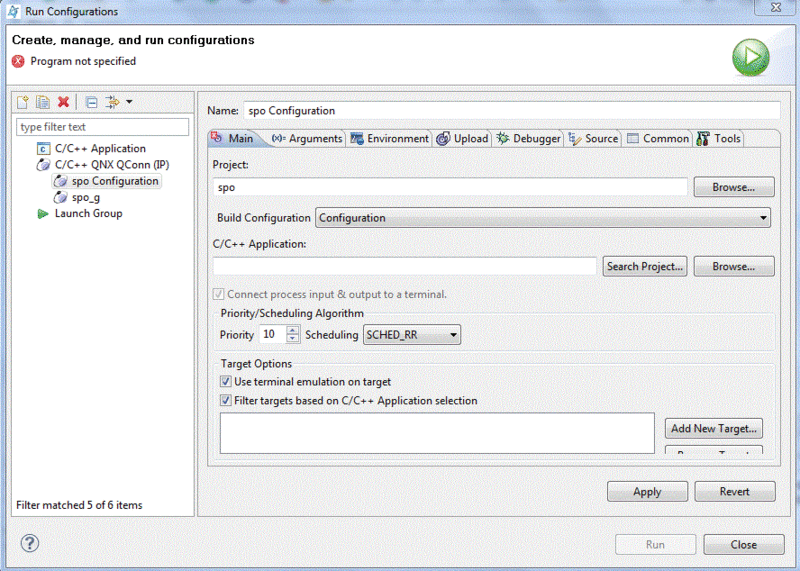
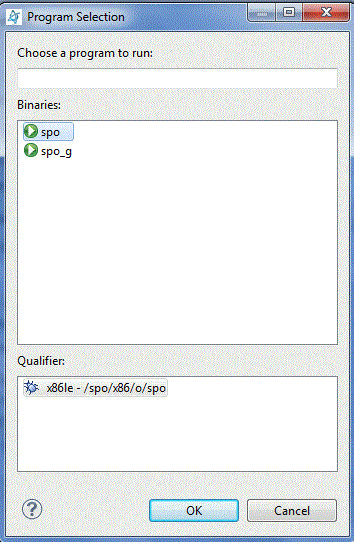
In the C / C ++ Aplication field, select our project
In the Target Options field we write the ip address of the running QNX Neutrino OS

Ip address can be found by running the terminal in the operating system using the ifconfig command , to monitor processes in momentics, you need to run the target qconn agent

Go to the arguments tab of the program you are running, run the program with arguments -n20 -t2 , n is the number of iterations of the synchronization cycle (control transfer), t is the number of threads between which synchronization
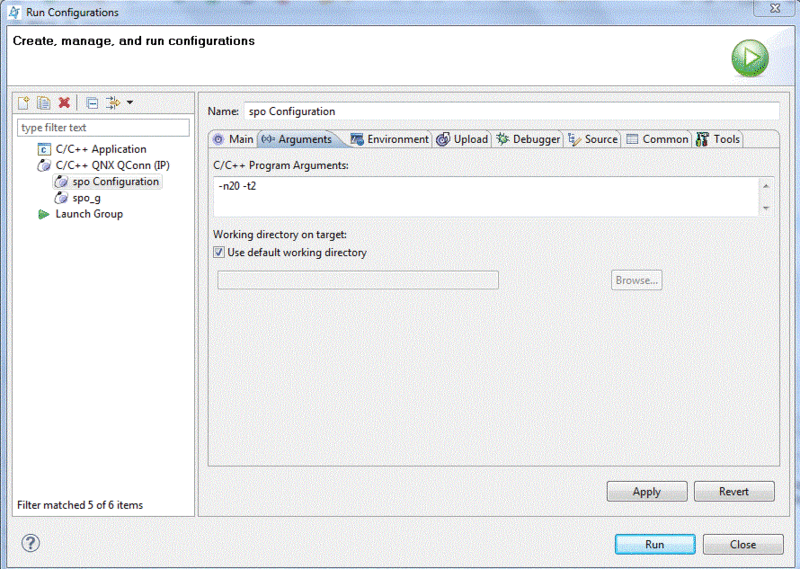
is performed, now we will create the profiler configuration:
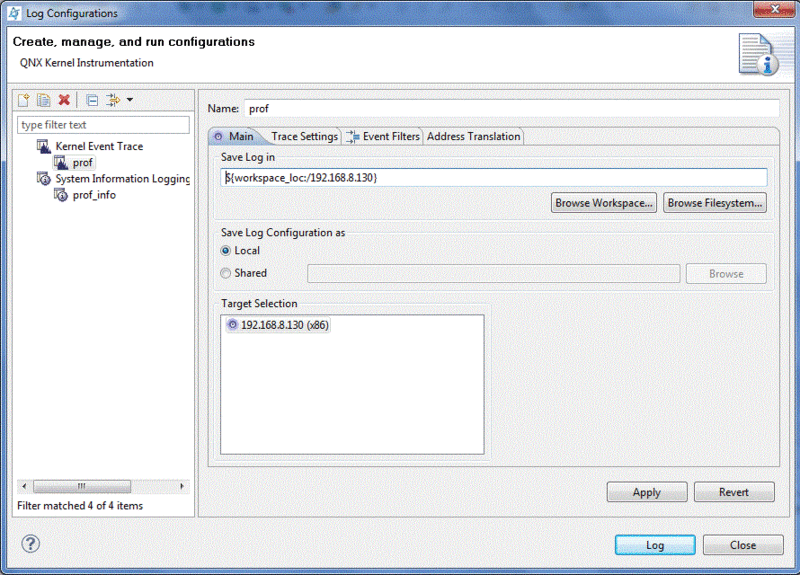
Run the created profiler configuration while it is running, We launch our program. Let’s open the created log, go to the QNX System Profiler tab and open the log (file with the kev extension)
General information:

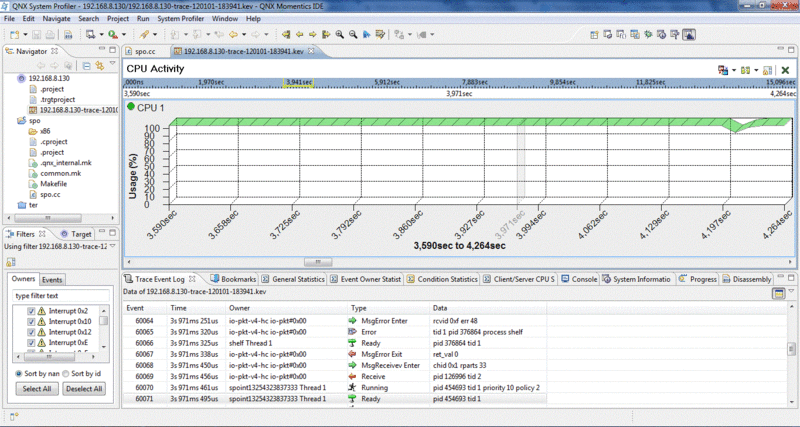
Processor load:
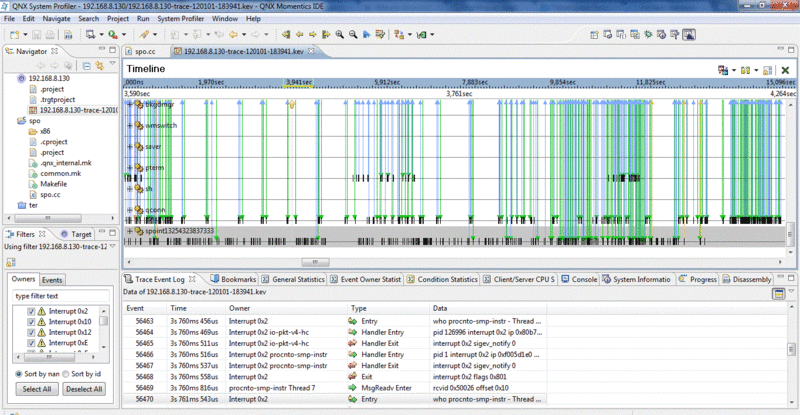
Graphical representation of the interaction of processes and threads:
Let's take a closer look. Find our process and take a closer look.
Creating the first child stream:
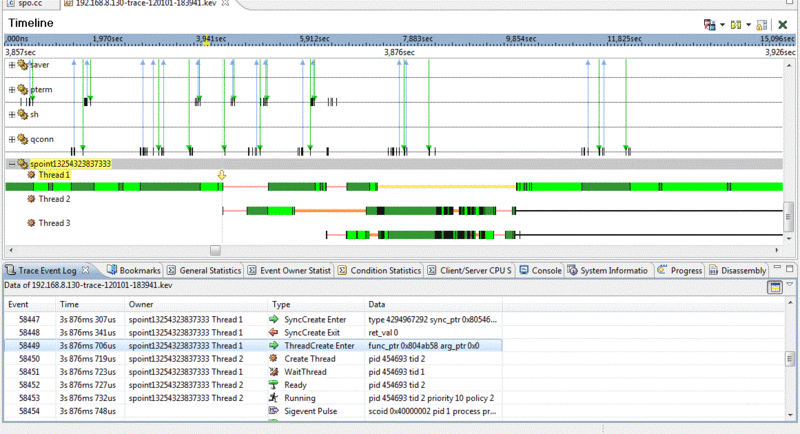
Synchronization cycle:

Now go to the QNX Aplication Profiler tab.

Here you can see the total execution time of individual functions and threads.
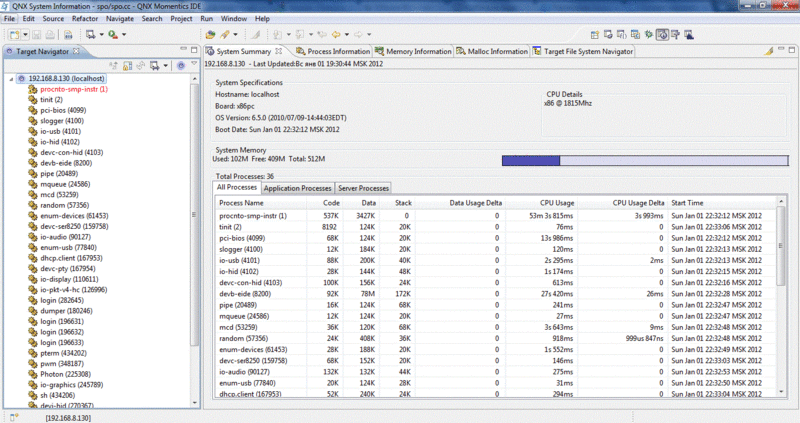
Also, if you go to the QNX System information tab, you can see the status of a working operating system.
Running processes:
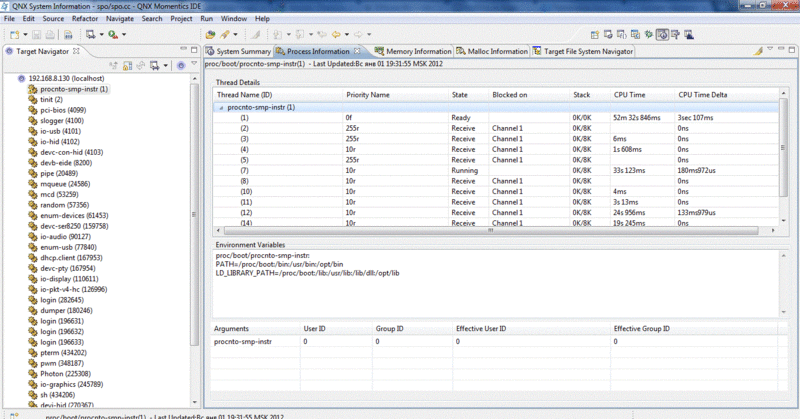
Information about the selected process:
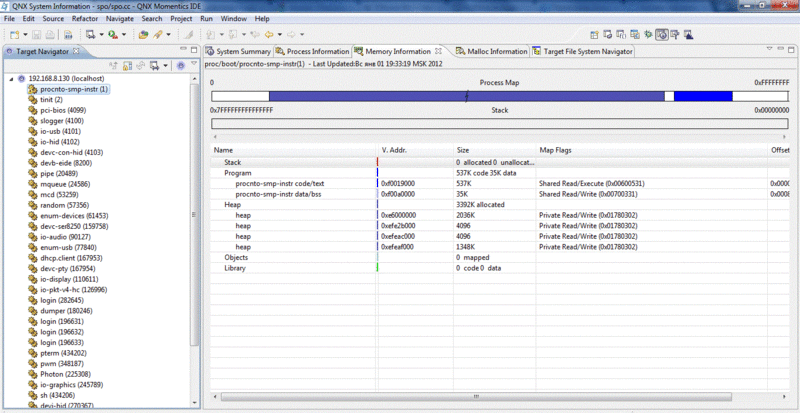
Information about memory:
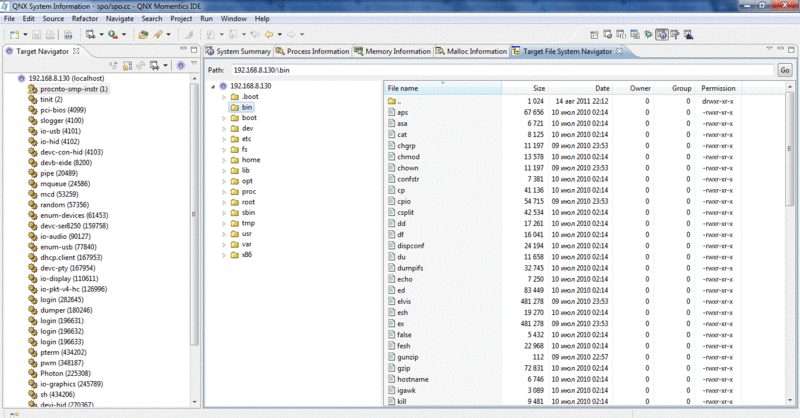
File system:
In this manual, we will not optimize anything, as it was written to demonstrate the means of profiling.
Literature
- Anatomy of Concurrency - Oleg Tsiryulik, Egor Goroshko
- QNX Momentics Application Basics - Sergey Zyl
