Non-WYSIWYG Wiki Charts
Charts are constantly used in technical documentation to illustrate any idea - many facts are easier to present graphically than text.
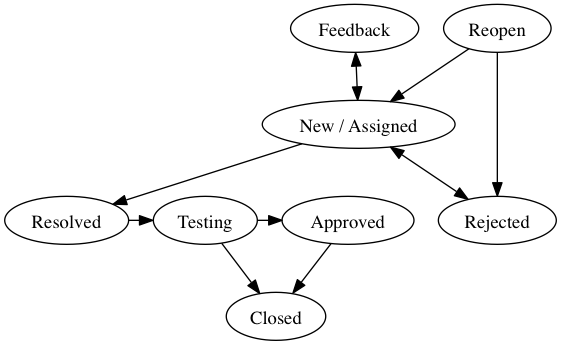
I want to talk about how to embed diagrams on wiki pages (the word wiki in this article means exclusively MediaWiki ). The standard approach — storing charts in files inside the wiki itself — has its drawbacks; about them - under the cut. I tried using Graphviz - a tool that draws graphs on a given data. Here is the source for the picture this article started with:
The programmer Vasya drew a diagram in his favorite Omnigraffle, saved it in png and uploaded it to the wiki. A week later, a new component was added to the project architecture, and PM Katya wanted to edit the diagram. But she can’t do it right away, because a) Vasya got sick, and the source code lies only on his machine; b) Katya uses Windows, where the omnigraffle somehow does not work.
Vasya could upload not only png, but also the source to the wiki, and put links between files - the solution is not very elegant, but it works. The cross-platform problem is not so easy to solve.
Let's look at a less natural non-WYSIWYG solution.
The diagrams in graphvis are described by text - as in the example given at the beginning of the article. Strengths grafviza:
- A fairly simple syntax;
- he thinks out how to arrange the elements of the diagram most optimally - for example, minimizes the number of intersections of arrows (aka edges of the graph);
- The diagram is always easy to edit, and the layout automatically adapts to the new data;
- cross-platform, of course - graphvis binaries are distributed for Windows, makoshi and many Linux assemblies.
Extension for wiki adds tag
What we get at the cost of a little effort:
- you can draw and edit diagrams without putting additional software;
- each chart has a transparent source;
- Charts can be "drawn" even on an iPhone.
- Workflow participants take time to master the graphvis syntax;
- grafvis is not suitable for those cases when you need to manage the layout manually - you must understand that this is not a WYSIWIG editor, and that absolutely no diagram can be displayed in it;
- there should have been one more minus - for parallelism, but I could not find it; maybe the reader will offer something.
I did not want to list in detail in this article the features of grafvis, but I really want to mention one feature. You can turn any node of the chart drawn by grafvis into a link! This is incredibly convenient if the diagram describes the interaction of the components of some complex application, since it provides connectivity between the diagram and information about the components. For example, by clicking on the square in which “Storage” is written, the reader will immediately be taken to a page describing the data warehouse.
Thanks for attention! In the comments, I propose to share my experience in using grafvis and to throw links to valuable sources of information on the topic.
I want to talk about how to embed diagrams on wiki pages (the word wiki in this article means exclusively MediaWiki ). The standard approach — storing charts in files inside the wiki itself — has its drawbacks; about them - under the cut. I tried using Graphviz - a tool that draws graphs on a given data. Here is the source for the picture this article started with:
digraph A {

 Feedback -> New_Assigned [dir="both"];

 New_Assigned [label="New / Assigned"];

 New_Assigned -> Rejected [dir="both"];

 Reopen -> Rejected;

 Reopen -> New_Assigned;

 New_Assigned -> Resolved -> Testing -> Approved -> Closed;

 Testing -> Closed;


 { rank=same; Feedback; Reopen; }

 { rank=same; Resolved; Testing; Approved; }

}
The cross-platform issue and “where to store the source”
The programmer Vasya drew a diagram in his favorite Omnigraffle, saved it in png and uploaded it to the wiki. A week later, a new component was added to the project architecture, and PM Katya wanted to edit the diagram. But she can’t do it right away, because a) Vasya got sick, and the source code lies only on his machine; b) Katya uses Windows, where the omnigraffle somehow does not work.
Vasya could upload not only png, but also the source to the wiki, and put links between files - the solution is not very elegant, but it works. The cross-platform problem is not so easy to solve.
Let's look at a less natural non-WYSIWYG solution.
Graphviz on the wiki
The diagrams in graphvis are described by text - as in the example given at the beginning of the article. Strengths grafviza:
- A fairly simple syntax;
- he thinks out how to arrange the elements of the diagram most optimally - for example, minimizes the number of intersections of arrows (aka edges of the graph);
- The diagram is always easy to edit, and the layout automatically adapts to the new data;
- cross-platform, of course - graphvis binaries are distributed for Windows, makoshi and many Linux assemblies.
Extension for wiki adds tag
Result
What we get at the cost of a little effort:
- you can draw and edit diagrams without putting additional software;
- each chart has a transparent source;
- Charts can be "drawn" even on an iPhone.
Minuses
- Workflow participants take time to master the graphvis syntax;
- grafvis is not suitable for those cases when you need to manage the layout manually - you must understand that this is not a WYSIWIG editor, and that absolutely no diagram can be displayed in it;
- there should have been one more minus - for parallelism, but I could not find it; maybe the reader will offer something.
Killer feature
I did not want to list in detail in this article the features of grafvis, but I really want to mention one feature. You can turn any node of the chart drawn by grafvis into a link! This is incredibly convenient if the diagram describes the interaction of the components of some complex application, since it provides connectivity between the diagram and information about the components. For example, by clicking on the square in which “Storage” is written, the reader will immediately be taken to a page describing the data warehouse.
References
- http://www.mediawiki.org/wiki/Extension:GraphViz - extension for media science;
- www.graphviz.org - grafviz itself;
- www.graphviz.org/Gallery.php - gallery of graphs drawn in graphs;
- www.graphviz.org/Documentation.php - documentation;
- particularly good text: www.graphviz.org/pdf/dotguide.pdf;
- in Russian: lib.custis.ru/Graphviz
Thanks for attention! In the comments, I propose to share my experience in using grafvis and to throw links to valuable sources of information on the topic.