InfoSphere Warehouse data mining integration with IBM Cognos reports
When working with information, IT departments often have a problem how to make the use of in-depth data analysis tools available for analysts. As you know, such tools require special knowledge in database programming.
For example, there are data about clients related to demographic aspects (age, profession, place of residence, etc.), as well as to past operations with these clients. The marketing department wants to create new offers aimed at specific groups of customers with similar properties. How to distinguish such typical groups? The solution to this problem is provided by data clustering technology. It automatically combines data arrays according to their properties or features. Then the analyst can analyze these arrays and interactively refine them until they receive answers to their questions. An important step in the analysis process is to present the results of clustered data to users. As a rule, analysts are not specialists in low-level database programming.
How to present to analysts and employees the results of an in-depth data analysis in such a way that they reflect the business process in which the user participates? How to comply with security requirements, for example, so that each user sees only what he is supposed to?
To give satisfactory answers to these questions, it is necessary to shift the perspective from statistical analysis to the real end user and the business processes that interest him. How can this be achieved? One possible answer to this is to integrate two interesting solutions - InfoSphere Warehouse (the foundation for an enterprise-wide data warehouse and an in-depth data analysis tool directly in the DB2 database) and IBM Cognos (reporting tool). Each of these products already represents powerful solutions for working with information, but, unfortunately, Cognos is not able to do in-depth analysis, and InfoSphere Warehouse does not provide an opportunity to consolidate and visualize relevant information. If you connect them (and the programs allow you to do this), you can get a very interesting tool for work.
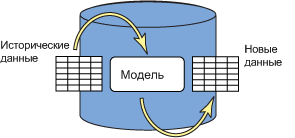
First, consider the possibility of such integration in theory. InfoSphere Warehouse uses DB2 to store data. Equipped with a database segmentation function (DPF), it provides a scalable, reliable, and high-performance data warehouse, combining the benefits of a database with online transaction processing capabilities and the capacity needed for large data warehouses. The package also includes a number of algorithms for in-depth data analysis, for example, clustering, regression, association, etc. ... The data analysis process begins with loading information into the database. Then a model is created, which, subsequently, can be applied to records for which the target value is not yet known, creating a forecast and calculating the level of its reliability (Schematically, this process is shown in Figure 2). All data mining functions are called like regular SQL commands. This allows you to easily integrate analysis tools into almost any design, for example, in Web services.
It should also be noted that in case of a lack of statistical methods presented in the framework of InfoSphere Warehouse, models created in any statistical analysis tool that supports the PMML format can be applied to the data.

Fig. 2
The IBM Cognos 8 Business Intelligence module provides a complete set of business intelligence features and is based on a flexible service-oriented architecture (SOA). The main functions of this module are reporting, analysis, dashboards and rating tables.
To include data in the report, you must perform the following steps:
In Framework Manager, the data architect creates Cognos metadata that describes the data from the database from a business point of view (relations between tables, business names of quantities, etc.).
After modeling the metadata, the entire package is loaded into the Cognos 8 content repository. From there, you can retrieve it using Cognos Connection as a new report.
The ability to create reports from relational databases is key to integrating InfoSphere Warehouse and IBM Cognos.
Cognos reports contain a set of results obtained from a relational data source, as described above. The content of a particular report is determined by (dynamically) querying SQL to one or more data sources. This basic communication method can be used to integrate Cognos advanced data mining and reporting systems in the following ways:
Cognos can be used to display score tables, possibly along with information about their reliability.
Cognos can be used to display model information. This information is extracted from current XML models using table extractor functions or XQuery queries.
Cognos can dynamically initiate in-depth data analysis and evaluation by invoking SQL stored procedures. This allows you to:
call the function of in-depth data analysis with various settings set by the user in the reporting interface.
call the function of in-depth data analysis on different subsets of data (for example, to create recursive in-depth reports)
Dynamically evaluate records based on data entered by the user.
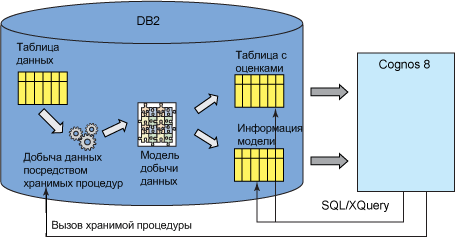
Figure 3 shows the final function call scheme used in all of the above methods.

The data mining function is called as a stored procedure and creates an XML model in the database. This model can be used to evaluate new data, or you can extract information from the model into a table and use such tables in Cognos. The user can invoke the advanced data mining function interactively by accessing the corresponding database stored procedure from the Cognos report.
Such integration provides a number of advantages:
It is very simple and requires only knowledge of SQL, without any additional programming. The
models of in-depth data analysis are stored in the database, and they can be accessed from Cognos in a safe, efficient way.
The whole process of in-depth data analysis can be started and controlled from Cognos using stored procedures
Such integration can have a significant impact on the dissemination of in-depth data analysis, as users do not need to know any details of the in-depth data analysis process.
If the topic is interesting, then in one of the following posts I can describe the step-by-step integration process using a real example.
For example, there are data about clients related to demographic aspects (age, profession, place of residence, etc.), as well as to past operations with these clients. The marketing department wants to create new offers aimed at specific groups of customers with similar properties. How to distinguish such typical groups? The solution to this problem is provided by data clustering technology. It automatically combines data arrays according to their properties or features. Then the analyst can analyze these arrays and interactively refine them until they receive answers to their questions. An important step in the analysis process is to present the results of clustered data to users. As a rule, analysts are not specialists in low-level database programming.
How to present to analysts and employees the results of an in-depth data analysis in such a way that they reflect the business process in which the user participates? How to comply with security requirements, for example, so that each user sees only what he is supposed to?
To give satisfactory answers to these questions, it is necessary to shift the perspective from statistical analysis to the real end user and the business processes that interest him. How can this be achieved? One possible answer to this is to integrate two interesting solutions - InfoSphere Warehouse (the foundation for an enterprise-wide data warehouse and an in-depth data analysis tool directly in the DB2 database) and IBM Cognos (reporting tool). Each of these products already represents powerful solutions for working with information, but, unfortunately, Cognos is not able to do in-depth analysis, and InfoSphere Warehouse does not provide an opportunity to consolidate and visualize relevant information. If you connect them (and the programs allow you to do this), you can get a very interesting tool for work.
First, consider the possibility of such integration in theory. InfoSphere Warehouse uses DB2 to store data. Equipped with a database segmentation function (DPF), it provides a scalable, reliable, and high-performance data warehouse, combining the benefits of a database with online transaction processing capabilities and the capacity needed for large data warehouses. The package also includes a number of algorithms for in-depth data analysis, for example, clustering, regression, association, etc. ... The data analysis process begins with loading information into the database. Then a model is created, which, subsequently, can be applied to records for which the target value is not yet known, creating a forecast and calculating the level of its reliability (Schematically, this process is shown in Figure 2). All data mining functions are called like regular SQL commands. This allows you to easily integrate analysis tools into almost any design, for example, in Web services.
It should also be noted that in case of a lack of statistical methods presented in the framework of InfoSphere Warehouse, models created in any statistical analysis tool that supports the PMML format can be applied to the data.

Fig. 2
The IBM Cognos 8 Business Intelligence module provides a complete set of business intelligence features and is based on a flexible service-oriented architecture (SOA). The main functions of this module are reporting, analysis, dashboards and rating tables.
To include data in the report, you must perform the following steps:
In Framework Manager, the data architect creates Cognos metadata that describes the data from the database from a business point of view (relations between tables, business names of quantities, etc.).
After modeling the metadata, the entire package is loaded into the Cognos 8 content repository. From there, you can retrieve it using Cognos Connection as a new report.
The ability to create reports from relational databases is key to integrating InfoSphere Warehouse and IBM Cognos.
Cognos reports contain a set of results obtained from a relational data source, as described above. The content of a particular report is determined by (dynamically) querying SQL to one or more data sources. This basic communication method can be used to integrate Cognos advanced data mining and reporting systems in the following ways:
Cognos can be used to display score tables, possibly along with information about their reliability.
Cognos can be used to display model information. This information is extracted from current XML models using table extractor functions or XQuery queries.
Cognos can dynamically initiate in-depth data analysis and evaluation by invoking SQL stored procedures. This allows you to:
call the function of in-depth data analysis with various settings set by the user in the reporting interface.
call the function of in-depth data analysis on different subsets of data (for example, to create recursive in-depth reports)
Dynamically evaluate records based on data entered by the user.
Figure 3 shows the final function call scheme used in all of the above methods.

The data mining function is called as a stored procedure and creates an XML model in the database. This model can be used to evaluate new data, or you can extract information from the model into a table and use such tables in Cognos. The user can invoke the advanced data mining function interactively by accessing the corresponding database stored procedure from the Cognos report.
Such integration provides a number of advantages:
It is very simple and requires only knowledge of SQL, without any additional programming. The
models of in-depth data analysis are stored in the database, and they can be accessed from Cognos in a safe, efficient way.
The whole process of in-depth data analysis can be started and controlled from Cognos using stored procedures
Such integration can have a significant impact on the dissemination of in-depth data analysis, as users do not need to know any details of the in-depth data analysis process.
If the topic is interesting, then in one of the following posts I can describe the step-by-step integration process using a real example.
