Statistics Services for Mobile Applications
Hello! My name is Arseniy Batyrov, I work in Yandex, and I also conduct testing courses. In my work, I often have to choose devices for testing in various conditions. In addition to obvious parameters like dpi and OS, I often rely on device prevalence statistics to accurately cover all the most popular combinations. This article lists the services with various statistics that I use when selecting devices. If this problem is relevant for you, welcome to cat.

Without a doubt, the most popular topic in mobile testing is the approach to choosing real devices. The need for choice is faced by every tester, beginner or working in the industry a long time ago. On the one hand, the more devices - the greater the variability. On the other hand, time and budgets are not endless. But a small number of devices is fraught with missed device-specific bugs and long edits. And if for iOS the choice is more or less limited, then on Android there are no numbers for the various options. Therefore, you have to choose and prioritize in any case.
When selecting devices, you can use different criteria: size and resolution of the display, processor power, version of the operating system, manufacturer, and so on. However, first of all, you should look at the statistics on the use of devices: first of all, those that your customers use are important. The importance of statistics for selection is difficult to overestimate: the choice of devices begins with it, and the list resulting from a long screening is checked against it.
Naturally, the best statistics are those collected on your own application. Only it can give the most complete and accurate picture of exactly which devices your users have - and which ones should be purchased for testing. The problem is that the application that is under development does not and cannot have any statistics. There are only assumptions which of the user groups will be the main for you, and what devices they possess.
In such cases, it is worth referring to external data. Many analytical companies collect lists of the most popular and best-selling devices, and with some caution in choosing you can rely on them. Beware is worth the three main mistakes.
Firstly , it is important to check the relevance of statistics. Any data that is more than a year old is hopelessly outdated. They can be used only as a reference, when there is simply no more relevant information. In just a year, the top 10 popular devices can change almost completely. If there is no other data, look at the names of manufacturers, and not at specific devices: with a high probability, the companies in the list will remain approximately the same.
Secondly, consider the market in which you operate. The popularity of devices varies greatly from country to country, depending on their price, operating system and many other factors. The device, which is in the first place in the US in sales, may not even enter the top 10 devices in India, and vice versa. If we talk about the Russian market, then the devices of Chinese manufacturers are very popular on it, while in Europe they are almost nonexistent. Finally, devices that are not even heard of in the rest of the world are sold and popular in the Central African or South Asian markets. Therefore, taking global data on popularity and using them in the local market is a big mistake.
Thirdly, do not confuse the lists of the most popular (that is, sold) and the best (powerful, expensive, well-known) devices. No one is safe from such mistakes. For example, one of the fellow trainers once pointed out that the most popular device in Russia is Xiaomi Black Shark: a gaming smartphone with a very powerful processor at the time of release and liquid cooling. Naturally, this device was mentioned in the list of the best devices, but did not even get into the top 100 of the best-selling in Russia. Carefully check that the statistics you are looking at mention exactly the best-selling, not the best devices.
Now let's move on to specific sources. All links to the mentioned sites will be in the basement of the article.
Naturally, some statistics on operating systems can be obtained on the official sites of Google and Apple. For Android, there are detailed lists by version, but they are updated approximately every 3 months - be sure to consider this when choosing.

Here we can see data on devices with different sizes and density of screens.

On the Apple website , the statistics are slightly less detailed: a graph with the prevalence of versions at the moment is shown here. Suitable for quick assessment of the share of a particular OS version in the market.

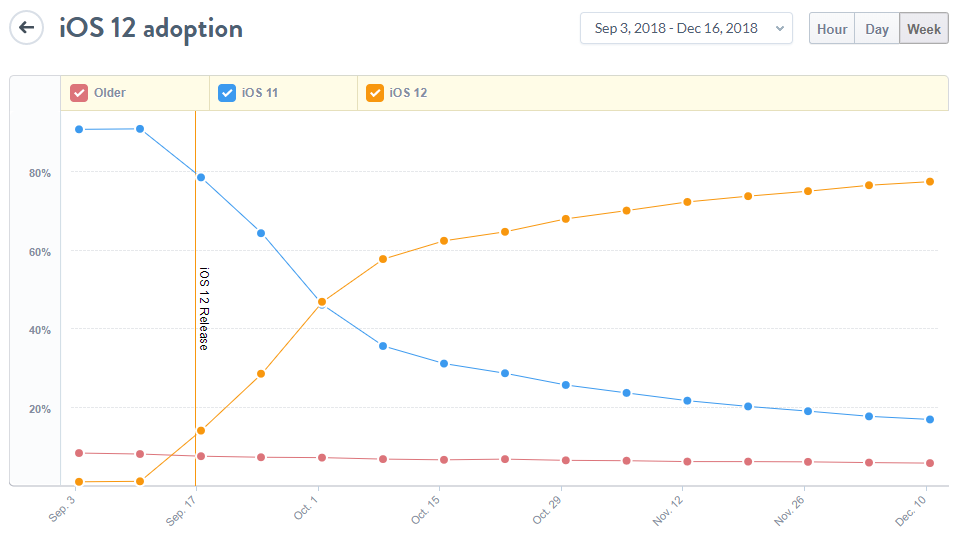
More detailed data on the OS distribution in dynamics can be seen on the Mixpanel resource : one of the graphs, for example, shows the adoption speed of iOS 12 after release.
A similar schedule exists for all versions of Android: here, if you wish, you can select exactly those versions that interest you.
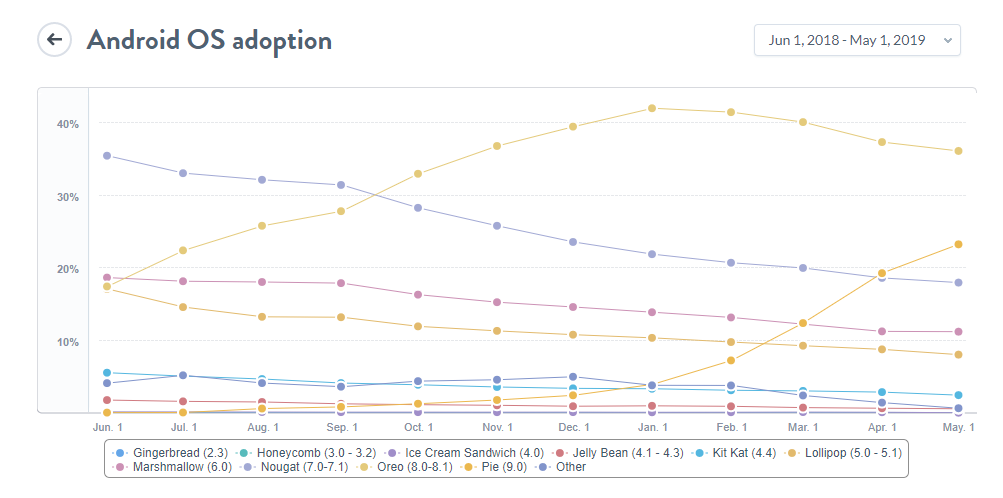
Good tops of Android devices, updated quite often, are provided by appbrain.com . Here you can see which devices are common for different countries, as well as see how popular a particular device is in the world. Unfortunately, to see the popularity of the device in all countries, a paid subscription is needed at the same time, but this is rarely required in testing. Also, if you wish, you can select a country on the world map, and by click go to the popular android devices there. In addition, you can see a breakdown by version of the Android OS in dynamics, which is convenient for understanding trends. For example, this graph shows that in Android 9 it grows faster than the share of Android 8 decreases, but the share of older versions remains practically unchanged.

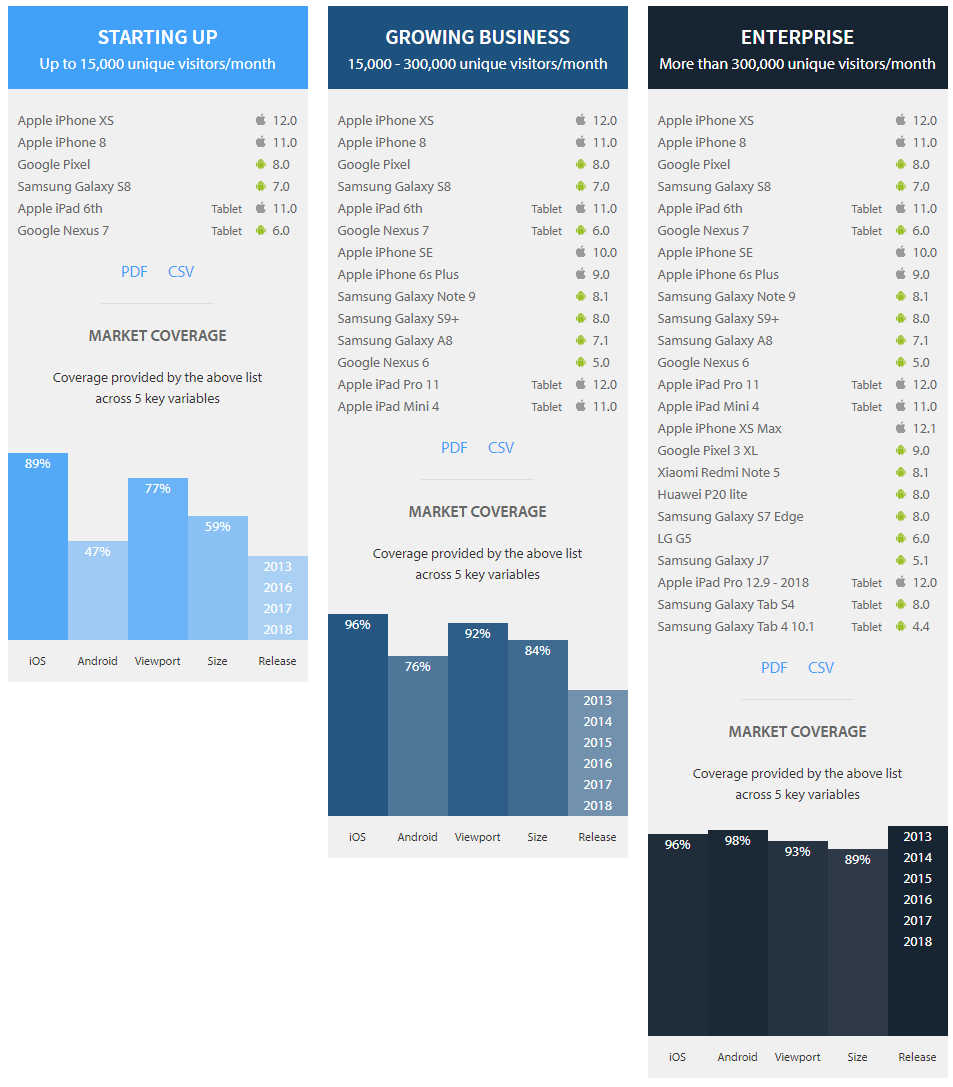
The browserstack.com website , in addition to the ability to remotely use devices, also offers several lists of smartphones and tablets that are suitable for testing for companies with different budgets. If your application will be used around the world, or you already know that your usage statistics are close to the global statistics on the distribution of devices - you can take these lists and purchase devices directly from them. Unfortunately, they are updated about once every six months or a year, so they may lag behind the real market. Also below you can see which devices are worth buying if you are in any of the listed countries. Unfortunately, Russia is not among them, but if you suddenly enter the Indian or Chinese application market, use it.
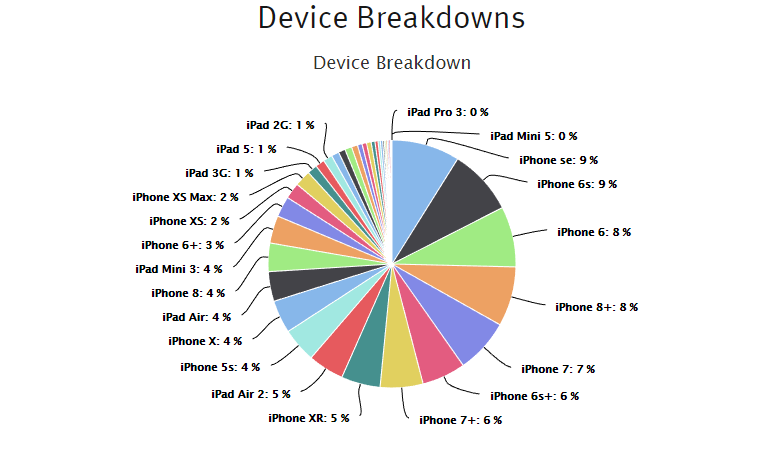
The developer resource of the application for iOS Audiobooks david-smith.org provides statistics on the use of various devices on this platform. The most useful chart is Device Breakdown, which allows you to quickly assess the popularity of a device on the market. In addition, you can see the distribution of older versions of the OS by device, which helps in choosing such combinations for testing. Naturally, the data is given for only one application, and for individual regions they can vary greatly, but the site is excellent for use as a reference - especially since the information is updated regularly.
On the Device Atlas website you can see the top 12 devices for different countries. Here, unlike Appbrain, you can find both iOS and Android devices. All tops can be viewed for all countries from the list on one page, which, of course, adds convenience.

Website androidnik.ru provides a selection of the most popular smartphones in 2018. Probably the same collections will be released in the future. The problem is that there are no specific numbers, and such a selection seems subjective. But the information here is in Russian.
But on the Kantar WorldPanel website there are no statistics for Russia, and there is generally no breakdown by specific device. But there is a timeline starting in January 2012, where you can see in dynamics how the mobile OS market has changed in a particular country. The choice is given to Android, iOS, Windows Phone and Blackberry. The last two are no longer relevant, but you can clearly see how they lost their market shares.

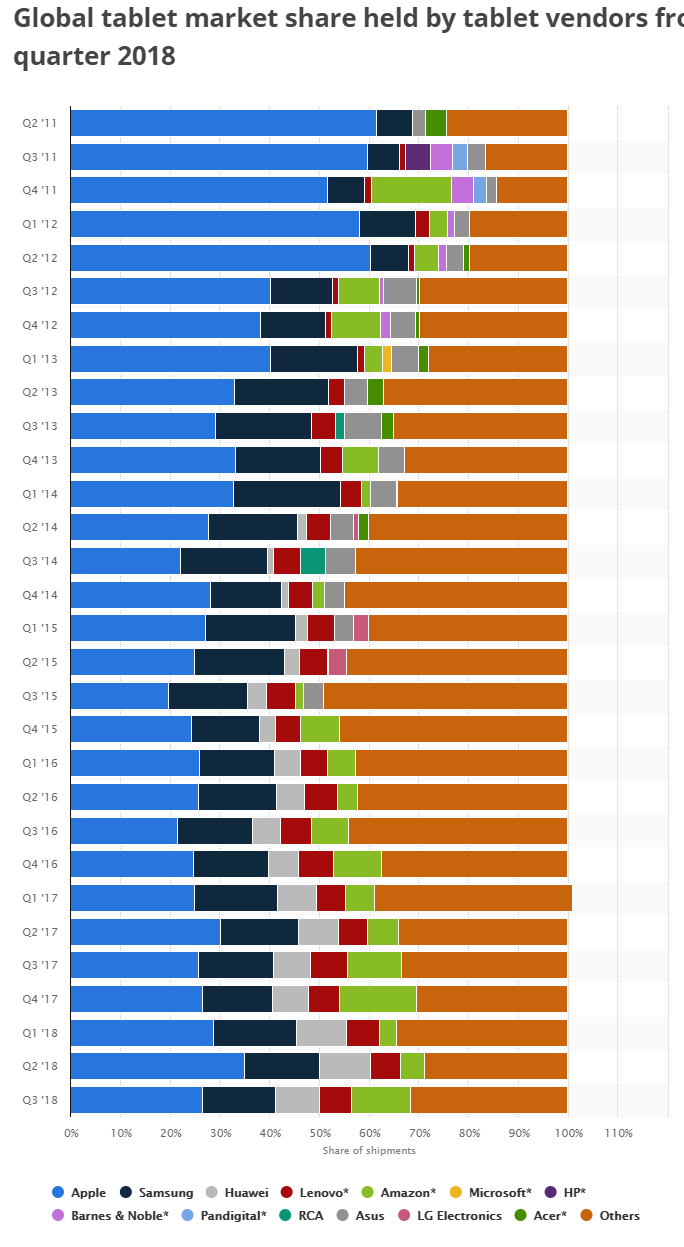
There are not many statistics separately for tablets, so you have to rely on data only from vendors from statista.com . Here you can see fairly current data on tablet manufacturers. They are updated approximately every 3 months.
The gs.statcounter.com website has a lot of different data, including mobile data. Here you can see the distribution of producers in almost all countries in dynamics.
At the same time, you can see the statistics for many years: for testing, this is not so important, but it can be interesting. Here you can also see data on the types of OS for each country, which is useful for a quick assessment of your proposed fleet of devices. Charts can be customized, and if desired, choose different types of devices, countries and display methods.

Finally, the Perfecto mobile farm website offers a special utility that can select the right devices for testing depending on the country, device type, and the desired operating system. Unfortunately, Russia is not among the possible countries, but there is the USA, the main countries of Europe, as well as some other large countries. After entering the email you can see the full results, as well as the proportion of the size of the screens, the number of smartphones and tablets and parts of the mobile market. If desired, you can choose the top 10 devices you need, or devices to cover 50 and 80% of the market.

Finally, data on specific devices: their sizes, resolution, processor and amount of memory, OS versions and everything else can be found on gsmarena.com . It is enough to drive a specific device into the search - and you will get a huge array of data on the device on one page.

As you can see, to select devices you have to use different data, with different relevance and reliability. Naturally, no one expects the tester to access all these resources each time to buy a couple more devices. But you can always choose sites that are suitable for specific tasks, and follow the relevant information on them.
If I forgot about some popular resources, or you know something about where you can get more statistics - be sure to write about it in the comments, and I will add this to the main article.
On how to effectively work with statistics and other details of mobile testing I talk about in my course “Manual Testing of Mobile Applications”. In it, we will talk about the basic concepts of mobile testing: what are native and web applications, what are hybrid applications, and so on. We will discuss the strategy for choosing devices for testing, we will analyze the differences between the emulator and the simulator from real devices, learn how to intercept mobile traffic and much more. We will focus in detail on the features and differences of testing iOS and Android applications.
Link to the course program: learnqa.ru/manual
If you are interested in testing automation of mobile applications, we have a course on the Java, JUnit, and Appium stack. On it we learn about test frameworks, learn how to write tests from scratch: do tap, work correctly with expectations (wait), swipe and much more. Then, one after another, we will write about 15 tests running on Android, iOS and MobileWeb applications. Learn to work with Maven and run tests in Jenkins. By the end of the course you will have your own working framework for quickly writing a wide variety of autotests for any mobile platform.
Link to the course program: learnqa.ru/java
Thank you for your attention!
Device Selection Criteria
Without a doubt, the most popular topic in mobile testing is the approach to choosing real devices. The need for choice is faced by every tester, beginner or working in the industry a long time ago. On the one hand, the more devices - the greater the variability. On the other hand, time and budgets are not endless. But a small number of devices is fraught with missed device-specific bugs and long edits. And if for iOS the choice is more or less limited, then on Android there are no numbers for the various options. Therefore, you have to choose and prioritize in any case.
When selecting devices, you can use different criteria: size and resolution of the display, processor power, version of the operating system, manufacturer, and so on. However, first of all, you should look at the statistics on the use of devices: first of all, those that your customers use are important. The importance of statistics for selection is difficult to overestimate: the choice of devices begins with it, and the list resulting from a long screening is checked against it.
Naturally, the best statistics are those collected on your own application. Only it can give the most complete and accurate picture of exactly which devices your users have - and which ones should be purchased for testing. The problem is that the application that is under development does not and cannot have any statistics. There are only assumptions which of the user groups will be the main for you, and what devices they possess.
In such cases, it is worth referring to external data. Many analytical companies collect lists of the most popular and best-selling devices, and with some caution in choosing you can rely on them. Beware is worth the three main mistakes.
Errors in data selection
Firstly , it is important to check the relevance of statistics. Any data that is more than a year old is hopelessly outdated. They can be used only as a reference, when there is simply no more relevant information. In just a year, the top 10 popular devices can change almost completely. If there is no other data, look at the names of manufacturers, and not at specific devices: with a high probability, the companies in the list will remain approximately the same.
Secondly, consider the market in which you operate. The popularity of devices varies greatly from country to country, depending on their price, operating system and many other factors. The device, which is in the first place in the US in sales, may not even enter the top 10 devices in India, and vice versa. If we talk about the Russian market, then the devices of Chinese manufacturers are very popular on it, while in Europe they are almost nonexistent. Finally, devices that are not even heard of in the rest of the world are sold and popular in the Central African or South Asian markets. Therefore, taking global data on popularity and using them in the local market is a big mistake.
Thirdly, do not confuse the lists of the most popular (that is, sold) and the best (powerful, expensive, well-known) devices. No one is safe from such mistakes. For example, one of the fellow trainers once pointed out that the most popular device in Russia is Xiaomi Black Shark: a gaming smartphone with a very powerful processor at the time of release and liquid cooling. Naturally, this device was mentioned in the list of the best devices, but did not even get into the top 100 of the best-selling in Russia. Carefully check that the statistics you are looking at mention exactly the best-selling, not the best devices.
Now let's move on to specific sources. All links to the mentioned sites will be in the basement of the article.
Official data
Naturally, some statistics on operating systems can be obtained on the official sites of Google and Apple. For Android, there are detailed lists by version, but they are updated approximately every 3 months - be sure to consider this when choosing.
Here we can see data on devices with different sizes and density of screens.
On the Apple website , the statistics are slightly less detailed: a graph with the prevalence of versions at the moment is shown here. Suitable for quick assessment of the share of a particular OS version in the market.
Third party sources
Mixpanel
More detailed data on the OS distribution in dynamics can be seen on the Mixpanel resource : one of the graphs, for example, shows the adoption speed of iOS 12 after release.
A similar schedule exists for all versions of Android: here, if you wish, you can select exactly those versions that interest you.
Appbrain
Good tops of Android devices, updated quite often, are provided by appbrain.com . Here you can see which devices are common for different countries, as well as see how popular a particular device is in the world. Unfortunately, to see the popularity of the device in all countries, a paid subscription is needed at the same time, but this is rarely required in testing. Also, if you wish, you can select a country on the world map, and by click go to the popular android devices there. In addition, you can see a breakdown by version of the Android OS in dynamics, which is convenient for understanding trends. For example, this graph shows that in Android 9 it grows faster than the share of Android 8 decreases, but the share of older versions remains practically unchanged.
Browserstack
The browserstack.com website , in addition to the ability to remotely use devices, also offers several lists of smartphones and tablets that are suitable for testing for companies with different budgets. If your application will be used around the world, or you already know that your usage statistics are close to the global statistics on the distribution of devices - you can take these lists and purchase devices directly from them. Unfortunately, they are updated about once every six months or a year, so they may lag behind the real market. Also below you can see which devices are worth buying if you are in any of the listed countries. Unfortunately, Russia is not among them, but if you suddenly enter the Indian or Chinese application market, use it.
David-smith
The developer resource of the application for iOS Audiobooks david-smith.org provides statistics on the use of various devices on this platform. The most useful chart is Device Breakdown, which allows you to quickly assess the popularity of a device on the market. In addition, you can see the distribution of older versions of the OS by device, which helps in choosing such combinations for testing. Naturally, the data is given for only one application, and for individual regions they can vary greatly, but the site is excellent for use as a reference - especially since the information is updated regularly.
Device atlas
On the Device Atlas website you can see the top 12 devices for different countries. Here, unlike Appbrain, you can find both iOS and Android devices. All tops can be viewed for all countries from the list on one page, which, of course, adds convenience.
androidnik.ru
Website androidnik.ru provides a selection of the most popular smartphones in 2018. Probably the same collections will be released in the future. The problem is that there are no specific numbers, and such a selection seems subjective. But the information here is in Russian.
Kantar worldpanel
But on the Kantar WorldPanel website there are no statistics for Russia, and there is generally no breakdown by specific device. But there is a timeline starting in January 2012, where you can see in dynamics how the mobile OS market has changed in a particular country. The choice is given to Android, iOS, Windows Phone and Blackberry. The last two are no longer relevant, but you can clearly see how they lost their market shares.
statista.com
There are not many statistics separately for tablets, so you have to rely on data only from vendors from statista.com . Here you can see fairly current data on tablet manufacturers. They are updated approximately every 3 months.
Statcounter
The gs.statcounter.com website has a lot of different data, including mobile data. Here you can see the distribution of producers in almost all countries in dynamics.
At the same time, you can see the statistics for many years: for testing, this is not so important, but it can be interesting. Here you can also see data on the types of OS for each country, which is useful for a quick assessment of your proposed fleet of devices. Charts can be customized, and if desired, choose different types of devices, countries and display methods.
Perfecto
Finally, the Perfecto mobile farm website offers a special utility that can select the right devices for testing depending on the country, device type, and the desired operating system. Unfortunately, Russia is not among the possible countries, but there is the USA, the main countries of Europe, as well as some other large countries. After entering the email you can see the full results, as well as the proportion of the size of the screens, the number of smartphones and tablets and parts of the mobile market. If desired, you can choose the top 10 devices you need, or devices to cover 50 and 80% of the market.
Specifications
Finally, data on specific devices: their sizes, resolution, processor and amount of memory, OS versions and everything else can be found on gsmarena.com . It is enough to drive a specific device into the search - and you will get a huge array of data on the device on one page.
conclusions
As you can see, to select devices you have to use different data, with different relevance and reliability. Naturally, no one expects the tester to access all these resources each time to buy a couple more devices. But you can always choose sites that are suitable for specific tasks, and follow the relevant information on them.
If I forgot about some popular resources, or you know something about where you can get more statistics - be sure to write about it in the comments, and I will add this to the main article.
On how to effectively work with statistics and other details of mobile testing I talk about in my course “Manual Testing of Mobile Applications”. In it, we will talk about the basic concepts of mobile testing: what are native and web applications, what are hybrid applications, and so on. We will discuss the strategy for choosing devices for testing, we will analyze the differences between the emulator and the simulator from real devices, learn how to intercept mobile traffic and much more. We will focus in detail on the features and differences of testing iOS and Android applications.
Link to the course program: learnqa.ru/manual
If you are interested in testing automation of mobile applications, we have a course on the Java, JUnit, and Appium stack. On it we learn about test frameworks, learn how to write tests from scratch: do tap, work correctly with expectations (wait), swipe and much more. Then, one after another, we will write about 15 tests running on Android, iOS and MobileWeb applications. Learn to work with Maven and run tests in Jenkins. By the end of the course you will have your own working framework for quickly writing a wide variety of autotests for any mobile platform.
Link to the course program: learnqa.ru/java
Thank you for your attention!