How to set up a web analytics infrastructure for $ 100 per month
Sooner or later, almost any company is faced with the problem of developing web analytics. This does not mean that you only need to put the Google Analytics code on the site - you need to find a benefit in the data received. In this post I will tell you how to do it as efficiently as possible, spending little (by the standards of specialized services) money.

My name is Andrey Kolesnichenko, I am the head of the web analytics department at the fintech company ID Finance. At the company, we constantly monitor many indicators, first of all, conversions at different steps are important for us. In the beginning, all reporting was only for Google Analytics. In order to calculate the conversion, we segmented users and found the share of each segment.
Then we moved on to reporting in Google Docs. We wrote about it earlier on Habré .
Now we are at the next stage - all reports are based on raw data.
They are important for any analyst: working with aggregated Google Analytics reports, it’s not possible to deeply understand user behavior, which greatly affects the quality of analytics.
To get such data, you can pay Google Analytics Premium, the cost of which is several million rubles per year. In this case, we get the raw data in BigQuery. There are also various services that duplicate Google Analytics data and put it into BigQuery. But you can do it yourself and in a less costly way. Let's get started.
You already have a site and configured Google Analytics. Now we need to make small changes to start collecting raw data. The main idea is to send the Google Client ID and then upload the data in these sections.
First we need to create three new custom dimension in the Google Analytics interface.
It is in the context of these custom dimensions that we will download reports from Google Analytics
Then we must add these variables to all hits sent to Google Analytics.
When sending each hit, dimension2 and dimension3 must be regenerated. Dimension3 is a hit identifier, so it must be unique. If you use GTM, then the principle of adding custom dimension is the same.
Our ClientID is configured at the User level, so we can uniquely identify a person by it. SessionID is configured at the Session level, according to it we can determine the user's session. You may notice that we send different SessionIDs each time, but Google will only keep one, the last value. This value will determine the session.
After setting up the front end, we need to configure the upload of raw data.
The data stream looks like this:
Google Analytics has an API that allows you to download reports. We will download reports in the context of our parameters. All scripts are written in python, I will tell you about the main things:
The script downloads the data via the API and writes to the file filename for the date date. View_id - view number in google analytics:
In order to get all the hits, download the data in the context of dimension2, dimension3:
At the end, we combine all the data with each other with a sql query. It turns out something similar to:
We’ve set up raw data collection in BigQuery, we just have to prepare reports for our conversions. They are made simple sql queries. For reporting, we use Tableau and Google Data Studio.
In addition, we have the opportunity to enrich data from google analytics with data from an internal database containing information about applications, issuances, late payments, payments, etc.
In addition, Google Cloud allows you to simply configure realtime data streaming, if necessary.
The full flow chart for analytical reporting now looks like this:
As a result, we were able to:
My name is Andrey Kolesnichenko, I am the head of the web analytics department at the fintech company ID Finance. At the company, we constantly monitor many indicators, first of all, conversions at different steps are important for us. In the beginning, all reporting was only for Google Analytics. In order to calculate the conversion, we segmented users and found the share of each segment.
Then we moved on to reporting in Google Docs. We wrote about it earlier on Habré .
Now we are at the next stage - all reports are based on raw data.
They are important for any analyst: working with aggregated Google Analytics reports, it’s not possible to deeply understand user behavior, which greatly affects the quality of analytics.
To get such data, you can pay Google Analytics Premium, the cost of which is several million rubles per year. In this case, we get the raw data in BigQuery. There are also various services that duplicate Google Analytics data and put it into BigQuery. But you can do it yourself and in a less costly way. Let's get started.
Front-End Preparation
You already have a site and configured Google Analytics. Now we need to make small changes to start collecting raw data. The main idea is to send the Google Client ID and then upload the data in these sections.
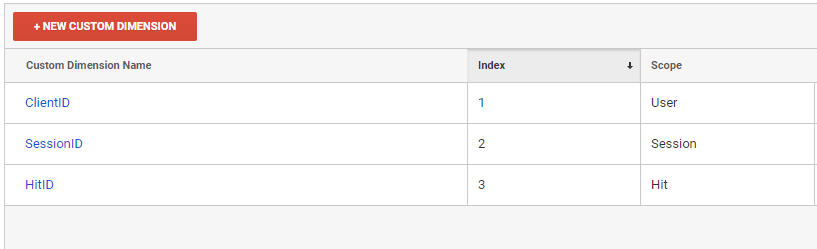
First we need to create three new custom dimension in the Google Analytics interface.
It is in the context of these custom dimensions that we will download reports from Google Analytics
- ClientID - user identifier
- SessionID - session identifier
- HitID - hit identifier
Then we must add these variables to all hits sent to Google Analytics.
ga(function (tracker) {
            var clientId = tracker.get('clientId');
            var timestamp = new Date().getTime();
            ga('set', 'dimension1', clientId);
            ga('set', 'dimension2', clientId + '_' + timestamp);
            ga('set', 'dimension3', clientId + '_' + timestamp);
        });
When sending each hit, dimension2 and dimension3 must be regenerated. Dimension3 is a hit identifier, so it must be unique. If you use GTM, then the principle of adding custom dimension is the same.
Our ClientID is configured at the User level, so we can uniquely identify a person by it. SessionID is configured at the Session level, according to it we can determine the user's session. You may notice that we send different SessionIDs each time, but Google will only keep one, the last value. This value will determine the session.
Infrastructure
After setting up the front end, we need to configure the upload of raw data.
- We will upload data to Google BigQuery. To do this, we will need to create a project in the Google Cloud Platform . Even if you are not going to use BigQuery, you still need to create a project to download data by API. Those who use the Google Cloud services will enjoy a pleasant bonus of $ 300 when linking a card. For the needs of analytics, a small project is enough for at least six months of free use.
- On the console.cloud.google.com/iam-admin/serviceaccounts page, you need to create a service key with which we will use the Google Analytics API and Google BigQuery.
- Then you need to give this mail access to reading Google Analytics.
- Go to console.cloud.google.com/apis/library/analytics.googleapis.com and enable the Google Analytics API
- Since we will download data every day, we need a server to perform our tasks. For this we will use the Google Compute Engine
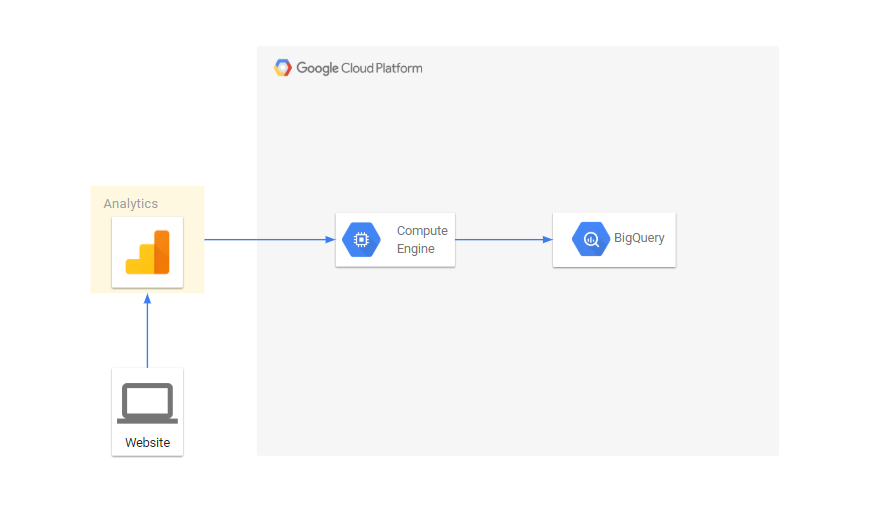
The data stream looks like this:
Export data through the Google Analytics API
Google Analytics has an API that allows you to download reports. We will download reports in the context of our parameters. All scripts are written in python, I will tell you about the main things:
Export data from Google Analytics to a file
from apiclient.discovery import build
import os
import unicodecsv as csv
from googleapiclient.errors import HttpError
import time
SCOPES = ['https://www.googleapis.com/auth/analytics.readonly']
KEY_FILE_LOCATION = 'my_key_file.p12'
SERVICE_ACCOUNT_EMAIL = 'service_account_email@my-google-cloud-project.iam.gserviceaccount.com'
class ApiGA():
    def __init__(self, scopes=SCOPES,
                 key_file_location=KEY_FILE_LOCATION,
                 service_account_email=SERVICE_ACCOUNT_EMAIL,
                 version='v4'):
        credentials = ServiceAccountCredentials.from_p12_keyfile(
                service_account_email, key_file_location, scopes=scopes)
        self.handler = build('analytics', version, credentials=credentials)
    def downloadReport(self, view_id, dim_list, metrics_list, date, page, end_date=None, filters=None):
        if not end_date:
            end_date = date
        body = {
                'reportRequests': [
        {
          'viewId': view_id,
          'dateRanges': [{'startDate': date, 'endDate': end_date}],
          'dimensions': dim_list,
          'metrics': metrics_list,
          'includeEmptyRows': True,
          'pageSize': 10000,
          'samplingLevel': 'LARGE'
        }]}
        if page:
            body['reportRequests'][0]['pageToken'] = page
        if filters:
            body['reportRequests'][0]['filtersExpression'] = filters
        while True:
            try:
                return self.handler.reports().batchGet(body=body).execute()
            except HttpError:
                time.sleep(0.5)
    def getData(self, view_id, dimensions, metrics, date, filename='raw_data.csv', end_date=None, write_mode='wb', filters=None):
        dim_list = map(lambda x: {'name': 'ga:'+x}, dimensions)
        metrics_list = map(lambda x: {'expression': 'ga:'+x}, metrics)
        file_data = open(filename, write_mode)
        writer = csv.writer(file_data)
        page = None
        while True:
            response = self.downloadReport(view_id, dim_list, metrics_list, date, page, end_date=end_date, filters=filters)
            report = response['reports'][0]
            rows = report.get('data', {}).get('rows', [])
            for row in rows:
                dimensions = row['dimensions']
                metrics = row['metrics'][0]['values']
                writer.writerow(dimensions+metrics)
            if 'nextPageToken' in report:
                page = report['nextPageToken']
            else:
                break
        file_data.close()
The script downloads the data via the API and writes to the file filename for the date date. View_id - view number in google analytics:
filename = 'raw_data.csv'
date = '2019-01-01'
view_id = '123123123'
ga = ApiGA()
dims = ['dimension1', 'dimension2', 'source', 'medium', 'campaign', 'keyword', 'adContent', 'userType']
metrics = ['hits', 'pageviews', 'totalEvents', 'transactions', 'screenviews']
ga.getData(view_id, dims, metrics, date, filename)
Then we load the received data into BigQuery
from google.cloud import bigquery
client = bigquery.Client()
schema = [
    	bigquery.SchemaField('clientId', 'STRING'),
bigquery.SchemaField('sessionId', 'STRING'),
bigquery.SchemaField('source', 'STRING'),
bigquery.SchemaField('medium', 'STRING'),
bigquery.SchemaField('campaign', 'STRING'),
bigquery.SchemaField('keyword', 'STRING'),
bigquery.SchemaField('adContent', 'STRING'),
bigquery.SchemaField('userType', 'STRING'),
bigquery.SchemaField('hits', 'INTEGER'),
bigquery.SchemaField('pageviews', 'INTEGER'),
bigquery.SchemaField('totalEvents', 'INTEGER'),
bigquery.SchemaField('transactions', 'INTEGER'),
bigquery.SchemaField('screenviews', 'INTEGER')
]
table_id = ‘raw.sessions’
table = bigquery.Table(table_id, schema=schema)
table = client.create_table(table)
dataset_ref = client.dataset(dataset_id)
table_ref = dataset_ref.table(table_id)
job_config = bigquery.LoadJobConfig()
job_config.source_format = bigquery.SourceFormat.CSV
job_config.skip_leading_rows = 0
job_config.autodetect = True
with open(filename, "rb") as source_file:
    job = client.load_table_from_file(source_file, table_ref, job_config=job_config)
job.result()
In order to get all the hits, download the data in the context of dimension2, dimension3:
dims = ['dimension2', 'dimension13', 'pagePath', 'hostname', 'dateHourMinute']
metrics = ['hits', 'entrances', 'exits']
….
dims = ['dimension3', 'eventCategory', 'eventAction', 'eventLabel']
metrics = ['eventValue']
….
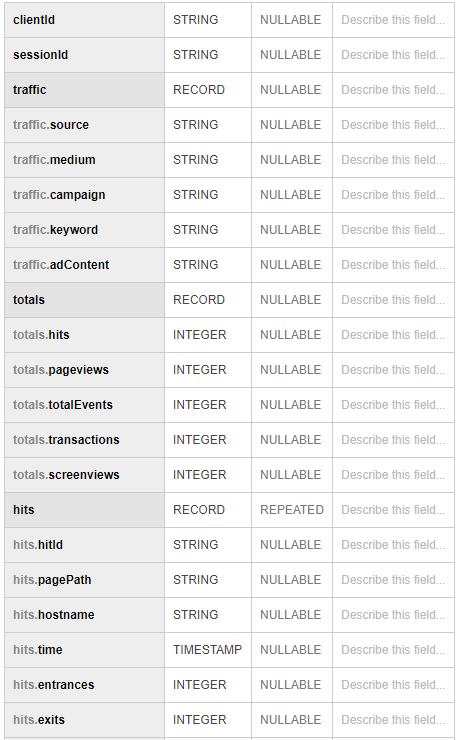
At the end, we combine all the data with each other with a sql query. It turns out something similar to:
Using
We’ve set up raw data collection in BigQuery, we just have to prepare reports for our conversions. They are made simple sql queries. For reporting, we use Tableau and Google Data Studio.
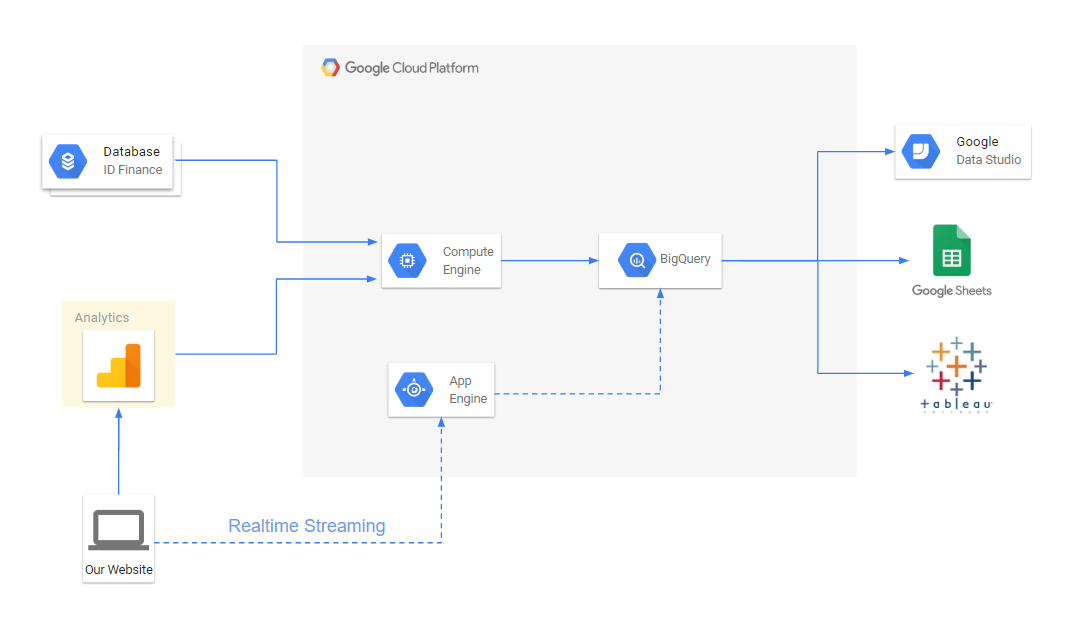
In addition, we have the opportunity to enrich data from google analytics with data from an internal database containing information about applications, issuances, late payments, payments, etc.
In addition, Google Cloud allows you to simply configure realtime data streaming, if necessary.
The full flow chart for analytical reporting now looks like this:
As a result, we were able to:
- Make reporting more flexible and convenient.
- Reduce time to resolve conversion issues
- Build multi-channel attribution for marketing. This allows us to distribute the value of the application not only by the last source, but also by all other sources that brought the user to the site.
- Combine user data in one place