JMeter - Swiss Tester Knife (Part 1)
Talk about JMeter? Most likely, if you are in the subject, then you have already read everything about this tool for stress testing. But I have something to surprise you. For three years at QA, I realized that JMeter is very versatile and can be used for a variety of purposes. For example, for:
If you are interested, welcome to cat. It turned out voluminously, so I will break the article into two parts.
JMeter - Java applet with GUI. For testing, it starts without a graphical interface. And for writing test scripts, he has a panel in which you can do anything.
 This is how the script creation process looks (even the word “spelling” does not fit here)
A common Test Plan is created, into which the Thread Group throws itself with the main elements of the test: the controllers that control the process and requests (HTTP, FTP, etc.).
In addition, there are additional elements for setting parameters. For example, HTTP Request Defaults allows you to specify the main server, headers and enable / disable the download of additional assets (pictures, styles, fonts, etc.). It’s easy to figure it out. And you can immediately run a test from this interface and look at the results.
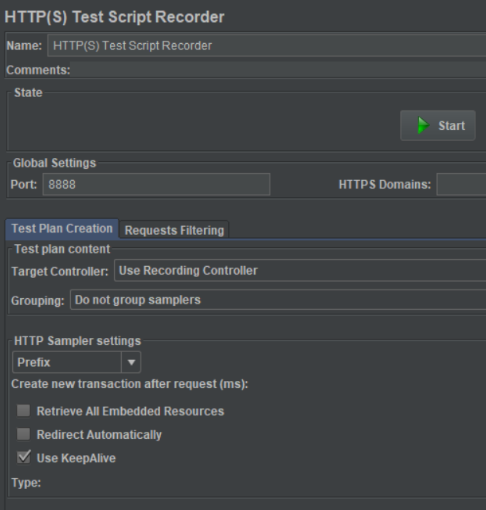
JMeter can record such test cases. It runs as a proxy on the local machine and, if you configure a browser (or application), drive traffic through this proxy, JMeter will record all requests and responses. And from this set, you can concoct a test script that will repeat the actions of the user, and run it wherever and whenever you want:
The main problem is the heap of the memory of Java itself. It rests on the ceiling and can fall with 50 threads of simultaneous testing, even on top-end machines.
If the machine does not have enough power for a full load test, contact a third-party organization. They deployed an infrastructure that is a set of servers. They got the same JMeter. For a fee, these guys will run your script on any load. We applied for such services at Octoperf and Blazemeter.
We have been engaged in web development for 18 years (cheers - now you can smoke, get married and watch John Wick). There have been many customers in their lifetime, but the largest have appeared recently. For example, we made a site on Sitecore for one of the English Premier League football clubs with the SPW paradigm (single page website: all pages open without reloading the browser page itself). Under the hood is the admin panel for managing a live match page. This is a textual online broadcast of the game: the main events (goals, deletions, free kicks) are loaded automatically from the Opta system, and photos, comments and reposts of fans from Twitter and Instagram are published by live people - football club content managers.
Not without pride, I note: after the release, the British media published articles under the headings like "Finally, the hegemony of the old sites of football clubs is over." At that time, most clubs already had sites. But they looked like they were developed at the beginning of the 2000s and have not changed since then - with the corresponding design and UX.
Before launch, we conducted a full load test and made sure that everything works as it should. The server structure looked like this:
A year after the launch during a large influx of users at the client site called and said that the site is not working:
- We have a website does not work! Doesn't work at all! Just a white screen and an inscription from the browser that the site is down! - the client says.
We are opening a site in a panic, and everything is OK with it:
- Still it works, - we respond.
The client opens the site from the phone and computer and ... everything is OK too!
- Really, sorry. Apparently, users have problems.
Such messages do not appear from scratch, so we conducted a study: we launched a utility for monitoring the status of Server Density servers and looked at what happens to them during an influx of users on the site:

There is a load, but all CD servers look about the same and even
Soon the story repeated itself - some users reported a completely broken site. It was not some kind of error or page not found - the server simply did not respond to the request. It was possible to catch the situation with the help of JMeter.
The goal was simple - load all eight servers and see what happens. A stress test was carried out when the dawn was taking place in Chelyabinsk, and in London it was a deep night. We used several machines in non-interface mode (it allows you to run much more threads at the same time). The script endlessly opened the home page, and this was our main mistake.

We downloaded the same assets that were already cached a hundred times. Therefore, the load came out insignificant. Then the idea came: on the site - a carriage and a small cart of pages with news for certain dates. If you advance a couple of variables and substitute them in the URL, we will always get a random page (for example - ... url / news / 2016/08/23 /? Page = 4).
Suddenly, we realized that Server Density has some built-in “smoothing” in the graphs of server load over past periods. If in five minutes the load on the server reached 100%, then fell to 0%, and after 20-30 seconds increased to 90%, it will show the average value for this period - about 80-90%. Therefore, we did not see a real server crash.
Having examined the logs in detail during stress tests, we found out that one of the CD-servers went into reboot at 100% load and didn’t tell anyone about it (he’s such an introvert).

The load balancer looked only at the CPU utilization of all the servers. He saw that one of them was loaded at 20%, and the rest at 90%, and sent the user to the first. And he was in reboot and gave out a white screen. In addition, the distribution server exposed the user to a cookie and tightly bound it to the idle server. Therefore, even after the update, the site was unavailable. The remaining 7 out of 8 users at the same time enjoyed life and said that everything works.
we found that JMeter can be used for stress tests and at the same time analyzing the status of servers during testing with other tools. We managed to “catch” the problem with the fall of the site among some users and solve it by correcting the load distribution logic and adding state control.
In the next part I’ll tell you how, with the help of JMeter, we set up the caching process for product pages, tested the operation of a mobile application without the application itself and created 2000 users in the system without access to the database.
- search for an elusive bug with the fall of the site for some users;
- quick cache warming on thousands of product pages;
- testing the backend of a mobile application;
- creating 2000 records with user data in the application database in a short time.
If you are interested, welcome to cat. It turned out voluminously, so I will break the article into two parts.
Disclaimer: For obvious reasons, I do not insert screenshots from real projects into the article (or extract all the important information from them). Illustrations are provided for research and educational purposes only.
Classic JMeter Application
JMeter - Java applet with GUI. For testing, it starts without a graphical interface. And for writing test scripts, he has a panel in which you can do anything.
A common Test Plan is created, into which the Thread Group throws itself with the main elements of the test: the controllers that control the process and requests (HTTP, FTP, etc.).
In addition, there are additional elements for setting parameters. For example, HTTP Request Defaults allows you to specify the main server, headers and enable / disable the download of additional assets (pictures, styles, fonts, etc.). It’s easy to figure it out. And you can immediately run a test from this interface and look at the results.
JMeter can record such test cases. It runs as a proxy on the local machine and, if you configure a browser (or application), drive traffic through this proxy, JMeter will record all requests and responses. And from this set, you can concoct a test script that will repeat the actions of the user, and run it wherever and whenever you want:
The main problem is the heap of the memory of Java itself. It rests on the ceiling and can fall with 50 threads of simultaneous testing, even on top-end machines.
If the machine does not have enough power for a full load test, contact a third-party organization. They deployed an infrastructure that is a set of servers. They got the same JMeter. For a fee, these guys will run your script on any load. We applied for such services at Octoperf and Blazemeter.
This is football, baby: how we caught a bug with a partial server crash
We have been engaged in web development for 18 years (cheers - now you can smoke, get married and watch John Wick). There have been many customers in their lifetime, but the largest have appeared recently. For example, we made a site on Sitecore for one of the English Premier League football clubs with the SPW paradigm (single page website: all pages open without reloading the browser page itself). Under the hood is the admin panel for managing a live match page. This is a textual online broadcast of the game: the main events (goals, deletions, free kicks) are loaded automatically from the Opta system, and photos, comments and reposts of fans from Twitter and Instagram are published by live people - football club content managers.
Not without pride, I note: after the release, the British media published articles under the headings like "Finally, the hegemony of the old sites of football clubs is over." At that time, most clubs already had sites. But they looked like they were developed at the beginning of the 2000s and have not changed since then - with the corresponding design and UX.
Before launch, we conducted a full load test and made sure that everything works as it should. The server structure looked like this:
- the request from the client goes to the load balancing server →
- load balancing server checks the status of eight CD servers →
- load balancing server sends a request to the least loaded CD server →
- The CD server responds to the client.
A year after the launch during a large influx of users at the client site called and said that the site is not working:
- We have a website does not work! Doesn't work at all! Just a white screen and an inscription from the browser that the site is down! - the client says.
We are opening a site in a panic, and everything is OK with it:
- Still it works, - we respond.
The client opens the site from the phone and computer and ... everything is OK too!
- Really, sorry. Apparently, users have problems.
Such messages do not appear from scratch, so we conducted a study: we launched a utility for monitoring the status of Server Density servers and looked at what happens to them during an influx of users on the site:
There is a load, but all CD servers look about the same and even
Soon the story repeated itself - some users reported a completely broken site. It was not some kind of error or page not found - the server simply did not respond to the request. It was possible to catch the situation with the help of JMeter.
The goal was simple - load all eight servers and see what happens. A stress test was carried out when the dawn was taking place in Chelyabinsk, and in London it was a deep night. We used several machines in non-interface mode (it allows you to run much more threads at the same time). The script endlessly opened the home page, and this was our main mistake.
We downloaded the same assets that were already cached a hundred times. Therefore, the load came out insignificant. Then the idea came: on the site - a carriage and a small cart of pages with news for certain dates. If you advance a couple of variables and substitute them in the URL, we will always get a random page (for example - ... url / news / 2016/08/23 /? Page = 4).
Suddenly, we realized that Server Density has some built-in “smoothing” in the graphs of server load over past periods. If in five minutes the load on the server reached 100%, then fell to 0%, and after 20-30 seconds increased to 90%, it will show the average value for this period - about 80-90%. Therefore, we did not see a real server crash.
Having examined the logs in detail during stress tests, we found out that one of the CD-servers went into reboot at 100% load and didn’t tell anyone about it (he’s such an introvert).
The load balancer looked only at the CPU utilization of all the servers. He saw that one of them was loaded at 20%, and the rest at 90%, and sent the user to the first. And he was in reboot and gave out a white screen. In addition, the distribution server exposed the user to a cookie and tightly bound it to the idle server. Therefore, even after the update, the site was unavailable. The remaining 7 out of 8 users at the same time enjoyed life and said that everything works.
Conclusion:
we found that JMeter can be used for stress tests and at the same time analyzing the status of servers during testing with other tools. We managed to “catch” the problem with the fall of the site among some users and solve it by correcting the load distribution logic and adding state control.
In the next part I’ll tell you how, with the help of JMeter, we set up the caching process for product pages, tested the operation of a mobile application without the application itself and created 2000 users in the system without access to the database.