Sometimes more is less. When a decrease in load leads to an increase in delay
- Transfer
As in most posts , there was a problem with a distributed service, let's call this service Alvin. This time I did not find the problem myself, the guys from the client part informed me.
Once I woke up from a disgruntled letter due to the big delays of Alvin, whom we planned to launch in the near future. In particular, the client encountered a 99th percentile delay around 50ms, well above our delay budget. This was surprising, since I thoroughly tested the service, especially for delays, because this is the subject of frequent complaints.
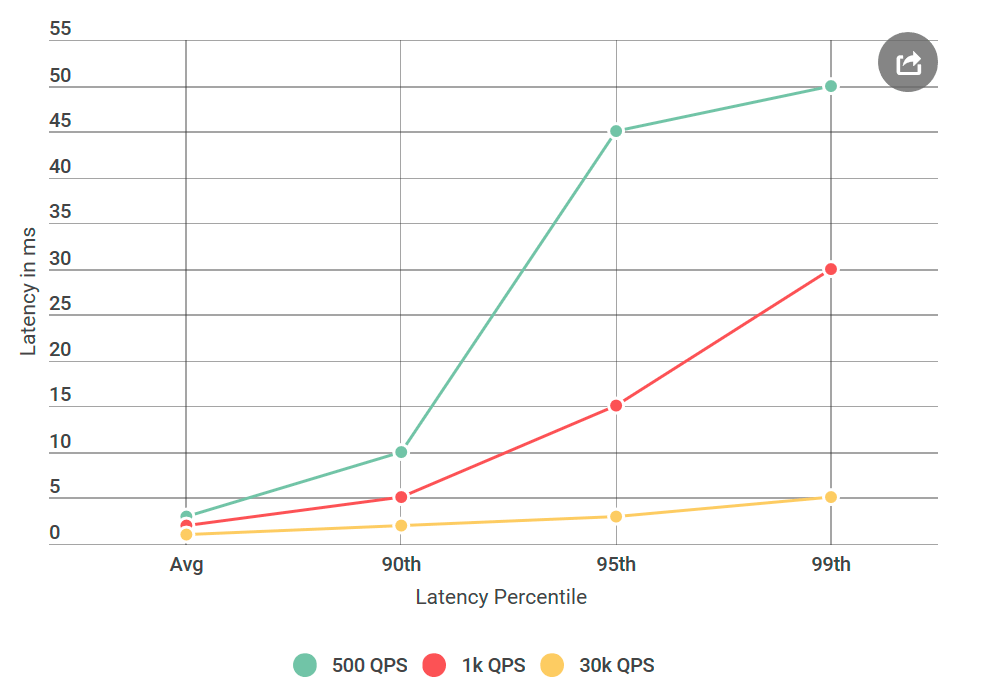
Before giving Alvin for testing, I conducted many experiments with 40 thousand requests per second (QPS), all showed a delay of less than 10 ms. I was ready to declare that I did not agree with their results. But once again looking at the letter, I drew attention to something new: I definitely did not test the conditions that they mentioned, their QPS was much lower than mine. I tested on 40k QPS, and they only on 1k. I ran another experiment, this time with lower QPS, just to please them.
Since I write about this on my blog, you probably already understood: their numbers turned out to be correct. I tested my virtual client again and again, all with the same result: a low number of requests not only increases the delay, but also increases the number of requests with a delay of more than 10 ms. In other words, if at 40k QPS about 50 requests per second exceeded 50 ms, then at 1k QPS every second there were 100 requests above 50 ms. Paradox!
Faced with the problem of delay in a distributed system with many components, the first thing you need to do is make a short list of suspects. We dig a little deeper into Alvin's architecture:
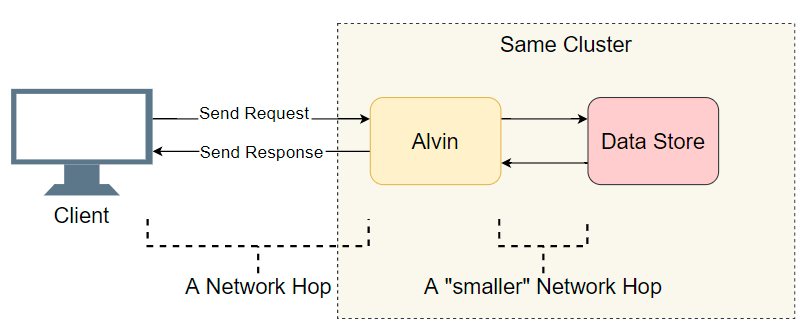
A good starting point is a list of completed I / O transitions (network calls / disk searches, etc.). Let's try to find out where the delay is. In addition to the obvious I / O with the client, Alvin takes an additional step: he accesses the data warehouse. However, this storage works in the same cluster with Alvin, so there should be less delay than with the client. So, the list of suspects:
Let's try to cross out some points.
The first thing I did was convert Alvin to a ping-ping server that does not handle requests. Upon receiving the request, it returns an empty response. If the delay decreases, then an error in the implementation of Alvin or the data warehouse is nothing unheard of. In the first experiment, we get the following graph:
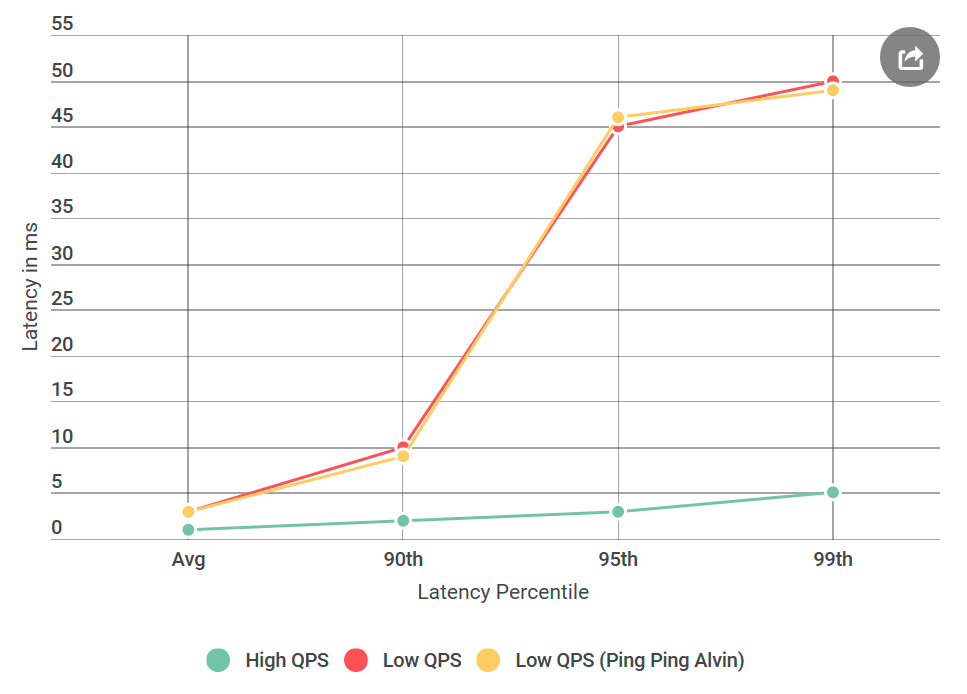
As you can see, when using the ping-ping server, there are no improvements. This means that the data warehouse does not increase the delay, and the list of suspects is halved:
Wow! The list is rapidly shrinking. I thought I almost figured out the reason.
Now is the time to introduce you to a new player: gRPC . This is an open source library from Google for in-process RPC communications . Although
The presence
To make you understand what the code looks like, my client / Alvin implementation is not much different from async client-server examples .
Crossing out the data warehouses, I thought I was almost done: “Now easy! We’ll apply the profile and find out where the delay occurs. ” I am a big fan of accurate profiling because the CPUs are very fast and most often they are not a bottleneck. Most delays occur when the processor must stop processing in order to do something else. Precise profiling of the CPU was made just for this: it accurately records all context switches and makes it clear where delays occur.
I took four profiles: under high QPS (low latency) and with a ping-pong server on low QPS (high latency), both on the client side and on the server side. And just in case, I also took a sample processor profile. When comparing profiles, I usually look for an abnormal call stack. For example, on the bad side with a high delay, there are much more context switches (10 or more times). But in my case, the number of context switches almost coincided. To my horror, there was nothing significant there.
I was desperate. I did not know what other tools could be used, and my next plan was essentially to repeat experiments with different variations, and not to clearly diagnose the problem.
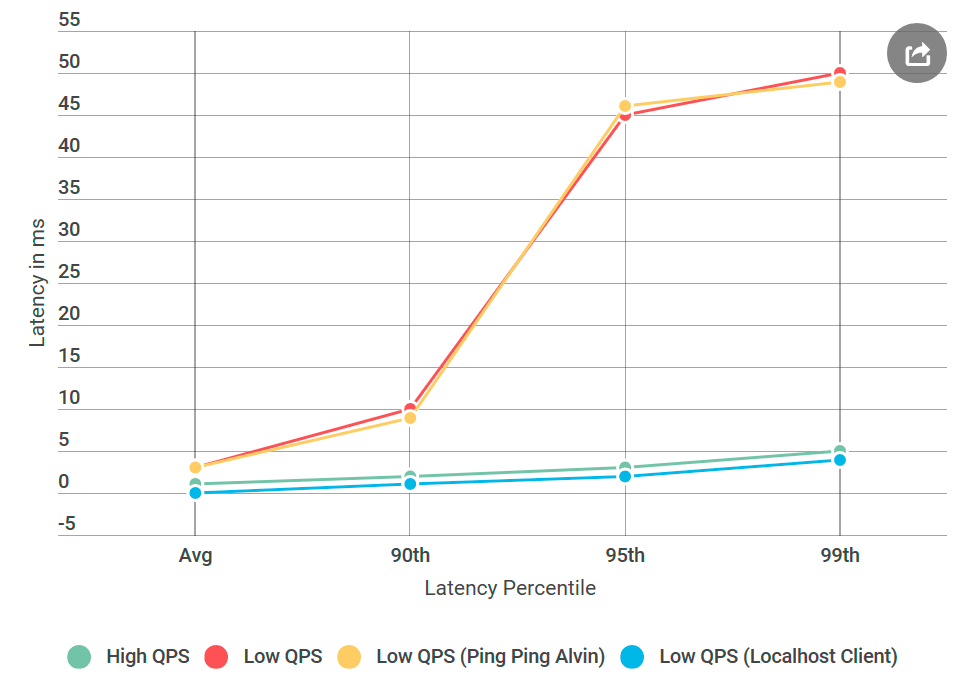
From the very beginning, I was worried about the specific delay time of 50 ms. This is a very big time. I decided that I would cut out the pieces from the code until I could figure out exactly which part was causing this error. Then followed an experiment that worked.
As usual, with the back mind it seems that everything was obvious. I put the client on the same machine with Alvin - and sent a request to
Something was wrong with the network.
I must admit: my knowledge of network technologies is terrible, especially considering the fact that I work with them daily. But the network was the main suspect, and I needed to learn how to debug it.
Fortunately, the Internet loves those who want to learn. The combination of ping and tracert seemed a good enough start to debug network transport issues.
First, I ran PsPing on Alvin 's TCP port. I used the default options - nothing special. Of the more than a thousand pings, not one exceeded 10 ms, with the exception of the first for warming up. This contradicts the observed increase in the delay of 50 ms in the 99th percentile: there, for every 100 requests, we should see about one request with a delay of 50 ms.
Then i tried tracert: maybe a problem on one of the nodes along the route between Alvin and the client. But the tracer came back empty-handed.
Thus, the reason for the delay was not my code, not the implementation of gRPC, and not the network. I have already begun to worry that I will never understand this.
And here's what happened: the ping-pong Linux server did not have such delays as a similar Windows node, although the data source did not differ. It turns out that the problem is in implementing gRPC for Windows.
All this time, I thought I was missing a flag

Almost done: I started deleting the added flags one at a time until regression returned, so I could pinpoint its cause. It was the infamous TCP_NODELAY , a switch of the Nagle algorithm.
Nagle algorithmtries to reduce the number of packets sent over the network by delaying the transmission of messages until the packet size exceeds a certain number of bytes. Although this may be pleasant for the average user, it is destructive for real-time servers, since the OS will delay some messages, causing delays on low QPS. There
A big delay in low QPS was caused by OS optimization. Looking back, profiling did not detect a delay because it was performed in kernel mode and not in user mode . I don’t know if it is possible to observe the Nagle algorithm through ETW captures, but that would be interesting.
As for the localhost experiment, it probably did not touch the actual network code, and the Neigl algorithm did not start, so the delay problems disappeared when the client contacted Alvin through localhost.
The next time you see an increase in latency while decreasing the number of requests per second, the Neigl algorithm should be on your list of suspects!
Once I woke up from a disgruntled letter due to the big delays of Alvin, whom we planned to launch in the near future. In particular, the client encountered a 99th percentile delay around 50ms, well above our delay budget. This was surprising, since I thoroughly tested the service, especially for delays, because this is the subject of frequent complaints.
Before giving Alvin for testing, I conducted many experiments with 40 thousand requests per second (QPS), all showed a delay of less than 10 ms. I was ready to declare that I did not agree with their results. But once again looking at the letter, I drew attention to something new: I definitely did not test the conditions that they mentioned, their QPS was much lower than mine. I tested on 40k QPS, and they only on 1k. I ran another experiment, this time with lower QPS, just to please them.
Since I write about this on my blog, you probably already understood: their numbers turned out to be correct. I tested my virtual client again and again, all with the same result: a low number of requests not only increases the delay, but also increases the number of requests with a delay of more than 10 ms. In other words, if at 40k QPS about 50 requests per second exceeded 50 ms, then at 1k QPS every second there were 100 requests above 50 ms. Paradox!
Narrow your search
Faced with the problem of delay in a distributed system with many components, the first thing you need to do is make a short list of suspects. We dig a little deeper into Alvin's architecture:
A good starting point is a list of completed I / O transitions (network calls / disk searches, etc.). Let's try to find out where the delay is. In addition to the obvious I / O with the client, Alvin takes an additional step: he accesses the data warehouse. However, this storage works in the same cluster with Alvin, so there should be less delay than with the client. So, the list of suspects:
- Network call from client to Alvin.
- Network call from Alvin to the data warehouse.
- Search on disk in the data warehouse.
- Network call from data warehouse to Alvin.
- Network call from Alvin to the client.
Let's try to cross out some points.
Data Warehouse
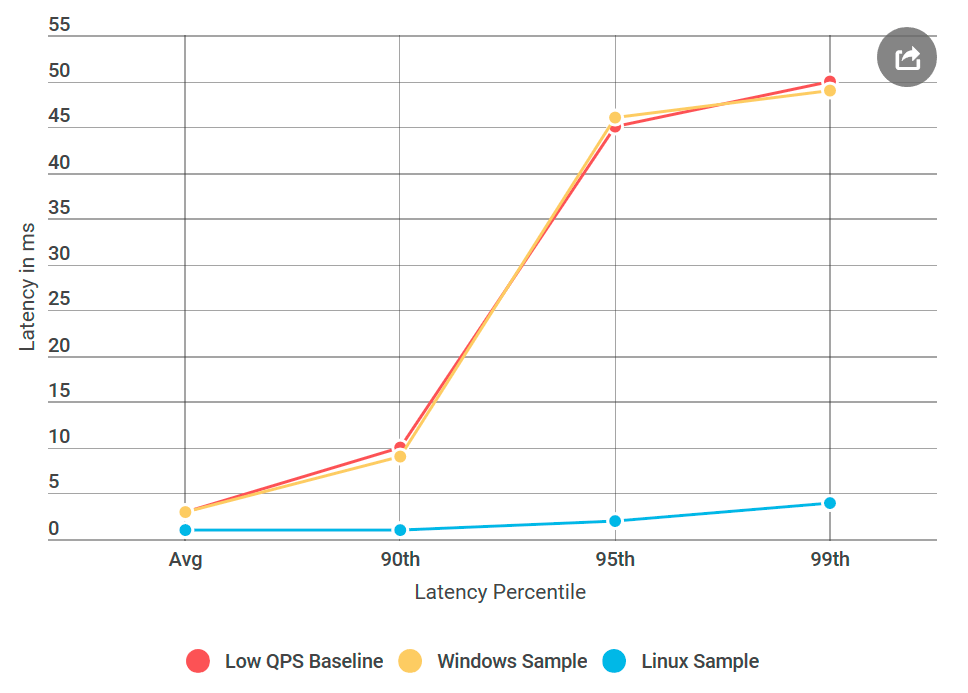
The first thing I did was convert Alvin to a ping-ping server that does not handle requests. Upon receiving the request, it returns an empty response. If the delay decreases, then an error in the implementation of Alvin or the data warehouse is nothing unheard of. In the first experiment, we get the following graph:
As you can see, when using the ping-ping server, there are no improvements. This means that the data warehouse does not increase the delay, and the list of suspects is halved:
- Network call from client to Alvin.
- Network call from Alvin to the client.
Wow! The list is rapidly shrinking. I thought I almost figured out the reason.
gRPC
Now is the time to introduce you to a new player: gRPC . This is an open source library from Google for in-process RPC communications . Although
gRPCwell optimized and widely used, I used it for the first time on a system of this scale, and I expected that my implementation would be sub-optimal - to put it mildly. The presence
gRPCon the stack raised a new question: maybe this is my implementation or does it gRPCcause a delay problem? Add to the list of the new suspect:- The client calls the library
gRPC - The library
gRPCon the client makes a network call to the librarygRPCon the server - The library
gRPCcalls Alvin (no operation in the case of the ping-pong server)
To make you understand what the code looks like, my client / Alvin implementation is not much different from async client-server examples .
Note: the list above is a little simplified, as itgRPCallows you to use your own (template?) Stream model, in which the execution stackgRPCand user implementation are intertwined . For the sake of simplicity, we will stick to this model.
Profiling will fix everything
Crossing out the data warehouses, I thought I was almost done: “Now easy! We’ll apply the profile and find out where the delay occurs. ” I am a big fan of accurate profiling because the CPUs are very fast and most often they are not a bottleneck. Most delays occur when the processor must stop processing in order to do something else. Precise profiling of the CPU was made just for this: it accurately records all context switches and makes it clear where delays occur.
I took four profiles: under high QPS (low latency) and with a ping-pong server on low QPS (high latency), both on the client side and on the server side. And just in case, I also took a sample processor profile. When comparing profiles, I usually look for an abnormal call stack. For example, on the bad side with a high delay, there are much more context switches (10 or more times). But in my case, the number of context switches almost coincided. To my horror, there was nothing significant there.
Additional debugging
I was desperate. I did not know what other tools could be used, and my next plan was essentially to repeat experiments with different variations, and not to clearly diagnose the problem.
What if
From the very beginning, I was worried about the specific delay time of 50 ms. This is a very big time. I decided that I would cut out the pieces from the code until I could figure out exactly which part was causing this error. Then followed an experiment that worked.
As usual, with the back mind it seems that everything was obvious. I put the client on the same machine with Alvin - and sent a request to
localhost. And the increase in delay has disappeared! Something was wrong with the network.
Learning the skills of a network engineer
I must admit: my knowledge of network technologies is terrible, especially considering the fact that I work with them daily. But the network was the main suspect, and I needed to learn how to debug it.
Fortunately, the Internet loves those who want to learn. The combination of ping and tracert seemed a good enough start to debug network transport issues.
First, I ran PsPing on Alvin 's TCP port. I used the default options - nothing special. Of the more than a thousand pings, not one exceeded 10 ms, with the exception of the first for warming up. This contradicts the observed increase in the delay of 50 ms in the 99th percentile: there, for every 100 requests, we should see about one request with a delay of 50 ms.
Then i tried tracert: maybe a problem on one of the nodes along the route between Alvin and the client. But the tracer came back empty-handed.
Thus, the reason for the delay was not my code, not the implementation of gRPC, and not the network. I have already begun to worry that I will never understand this.
Now what OS are we on
gRPCIt is widely used in Linux, but for Windows it is exotic. I decided to conduct an experiment that worked: I created a Linux virtual machine, compiled Alvin for Linux, and deployed it. And here's what happened: the ping-pong Linux server did not have such delays as a similar Windows node, although the data source did not differ. It turns out that the problem is in implementing gRPC for Windows.
Nagle algorithm
All this time, I thought I was missing a flag
gRPC. Now I realized that this is gRPCactually missing the Windows flag. I found the internal RPC library, in which I was sure that it works well for all installed Winsock flags . Then he added all these flags to gRPC and deployed Alvin to Windows, in the fixed ping-pong server for Windows! Almost done: I started deleting the added flags one at a time until regression returned, so I could pinpoint its cause. It was the infamous TCP_NODELAY , a switch of the Nagle algorithm.
Nagle algorithmtries to reduce the number of packets sent over the network by delaying the transmission of messages until the packet size exceeds a certain number of bytes. Although this may be pleasant for the average user, it is destructive for real-time servers, since the OS will delay some messages, causing delays on low QPS. There
gRPCwas this flag to Linux implementations for TCP sockets, but not for Windows. I fixed it .Conclusion
A big delay in low QPS was caused by OS optimization. Looking back, profiling did not detect a delay because it was performed in kernel mode and not in user mode . I don’t know if it is possible to observe the Nagle algorithm through ETW captures, but that would be interesting.
As for the localhost experiment, it probably did not touch the actual network code, and the Neigl algorithm did not start, so the delay problems disappeared when the client contacted Alvin through localhost.
The next time you see an increase in latency while decreasing the number of requests per second, the Neigl algorithm should be on your list of suspects!