Two Approaches to Structuring an Activity Chart
Comparison of two approaches to structuring an Activity diagram (based on "Proteins")
In the first part of the article "From Process Modeling to Designing an Automated System" we simulated the processes of a "fairy-tale" subject area - a line about a squirrel from "Tales of Tsar Saltan, of his glorious and powerful hero Prince Gvidon Saltanovich and the beautiful Princess Swans" A.S. Pushkin. And we started with the Activity diagram, agreeing to structure the diagram field using the “swimming” paths - Swim lanes. The name of the track corresponds to the type of chart elements that are present on this track: “Input and output artifacts”, “Process steps”, “Participants” and “Business rules”. This approach differs from the standard when the tracks are indicated by the names of the participants in the process, thus assigning them certain areas of responsibility in the process.
In this example, I use the Enterprise Architect environment from the Australian company Sparx Systems [1].
For more details on the applied modeling approaches, see [2].
See the full UML specification here [3].
I repeat the version of the diagram from the previous article (Figure 1) and show the redrawn diagram with the "standard" tracks (Figure 2), I will try to outline the pros and cons, maybe a little subjectively.

Figure 1. Activity diagram - general view of the process
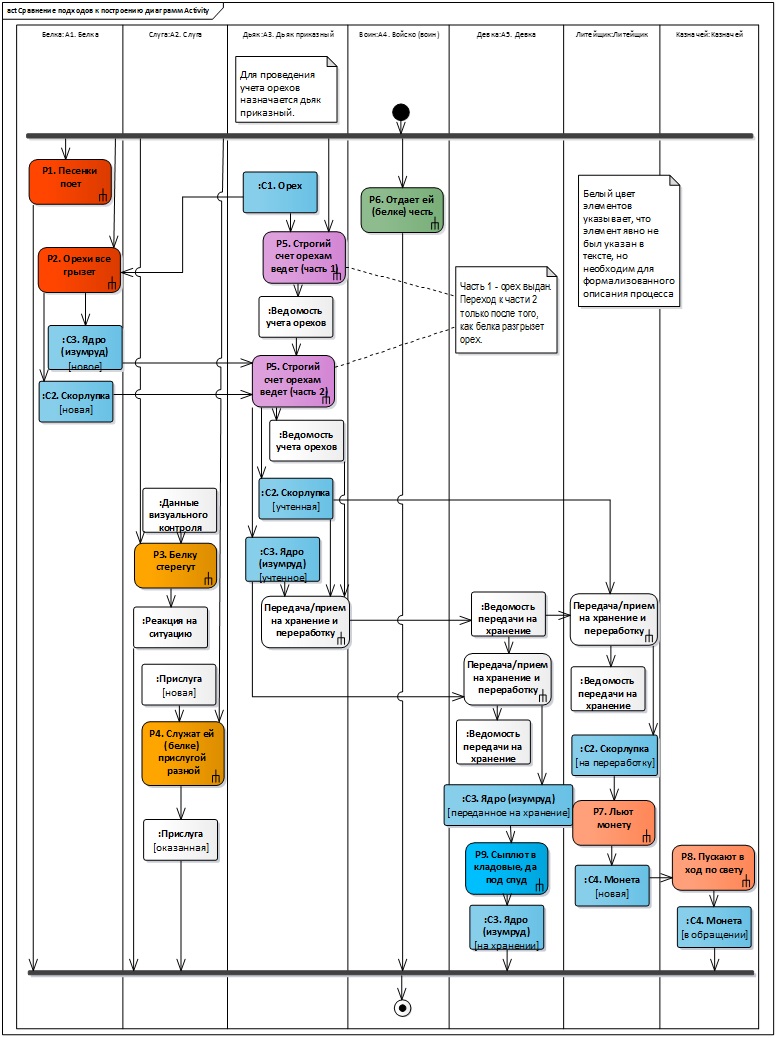
Figure 2. Activity diagram - standard chart structuring
- I must admit that the number of arrows is slightly less on the 2nd diagram.
- But on the 2nd diagram, the objects are "smeared" over the entire field of the diagram, which, for my taste, is not very convenient.
- The same story with notes - rules. And in order to insert the rule about the appointment of the deacon, I had to move all the elements of the diagram at some point down.
- I had to clone the “receive / transmit ...” step to show that several participants were present at this step.
- In the second option, I had to abandon one branch and one merge of the process, well, it was completely impossible to put them “beautifully”! On good, then it would be necessary to post a comment - the rule.
Of course, there are no friends for taste and color, but the first option seems to me even more convenient for collecting data about the process.
But I will not dissemble - sometimes it’s better to draw both options in order to figure it out.
Addition. Thank you for the comments and give a slightly modified diagram of the 2nd option: you can rearrange the tracks (in Figure 2, their sequence repeats the sequence of the appearance of participants in the story), the number of intersecting arrows will decrease slightly (Figure 3).
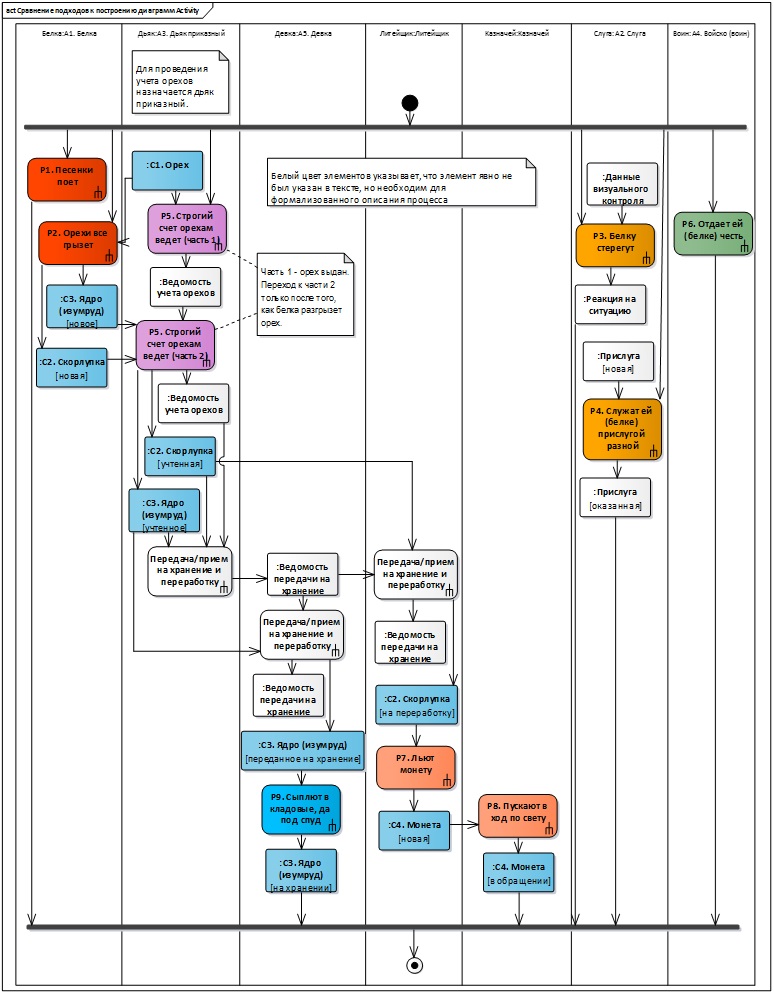
Figure 3. Activity chart - standard charting - rearranged tracks
Articles based on which this article appeared:
From process modeling to designing an automated system (Part 1)
From process modeling to designing an automated system (Part 2)
- Sparx Systems Website. [Electronic resource] Access mode: Internet: https://sparxsystems.com
- Zolotukhina E.B., Cherry A.S., Krasnikova S.A. Modeling business processes. - M .: COURSE, SIC INFRA-M, EBS Znanium.com. - 2017.
- OMG Unified Modeling Language (OMG UML) Specification. Version 2.5.1. [Electronic resource] Access mode: Internet: https://www.omg.org/spec/UML/2.5.1/PDF