Load testing a game with a couple of hundreds of thousands of virtual users
Hello, Habr!
I work for a gaming company that develops online games. Currently, all our games are divided into many “markets” (one “market” per country) and in each “market” there are a dozen worlds between which players are distributed during registration (well, or sometimes they can choose it themselves). Each world has one database and one or more web / app servers. Thus, the load is divided and distributed across the worlds / servers almost evenly and as a result we get the maximum online of 6K-8K players (this is the maximum, mostly several times less) and 200-300 requests per prime time per world.
Such a structure with the division of players into markets and worlds is becoming obsolete; players want something global. In the last games, we stop dividing people by country and left only one / two markets (America and Europe), but still with many worlds in each. The next step will be the development of games with a new architecture and the unification of all players in one single world with one database .
Today I wanted to talk a little bit about how I was tasked with checking what if the whole online (and this is 50-200 thousand users at a time) of one of our popular games “send” to play the next game built on the new architecture and whether whole system, especially database ( PostgreSQL 11) practically withstand such a load and, if it can’t, find out where our maximum is. I’ll tell you a little about the problems that have arisen and the decisions to prepare for testing so many users, the process itself and a little about the results.
In the past, at InnoGames GmbH, each game team created a game project to their taste and color, often using different technologies, programming languages, and databases. In addition, we have many external systems responsible for payments, sending push notifications, marketing and more. To work with these systems, developers also created their unique interfaces as best they could.
There is a lot of money in the mobile gaming business right nowand, accordingly, huge competition. Here it is very important to get it back from each dollar spent on marketing and a little more from above, therefore all game companies very often “close” games even at the stage of closed testing, if they do not meet the analytical expectations. Accordingly, losing time on the invention of the next wheel is unprofitable, so it was decided to create a unified platform that will provide developers with a ready-made solution for integration with all external systems, a database with replication and all best-practices. All that developers need is to develop and “put” a good game on top of this and not waste time on development not related to the game itself.
This platform is called GameStarter :

So, to the point. All future InnoGames games will be built on this platform, which has two databases - master and game (PostgreSQL 11). Master stores basic information about the players (login, password, etc.) and participates, mainly, only in the process of login / registration in the game itself. Game - the database of the game itself, where, accordingly, all game data and entities are stored, which is the core of the game, where the whole load will go.
Thus, the question arose whether this whole structure could withstand such a potential number of users equal to the maximum online of one of our most popular games.
The task itself was this: to check whether the database (PostgreSQL 11), with replication enabled, can withstand all the load that we currently have in the most loaded game, having at its disposal the entire PowerEdge M630 hypervisor (HV).
I ’ll clarify that the task at the moment was only to verify , using the existing database configs, which we formed taking into account best-practices and our own experience.
I’ll say right away the database, and the whole system showed itself well, with the exception of a couple of points. But this particular game project was at the prototype stage and in the future, with the complication of game mechanics, requests to the database will become more complicated and the load itself may increase significantly and its nature may change. To prevent this, it is necessary to iteratively test the project with each more or less significant milestone. Automating the ability to run these kinds of tests with a couple of hundreds of thousands of users has become the main task at this stage.
Like any load testing, it all starts with a load profile.
Our potential value CCU60 (CCU is the maximum number of users for a certain period of time, in this case 60 minutes) is taken to be 250,000 users. The number of competitive virtual users (VUs) is lower than the CCU60 and analysts have suggested that it can be safely divided into two. Round up and accept 150,000 competitive VUs.
The total number of requests per second was taken from one rather loaded game:
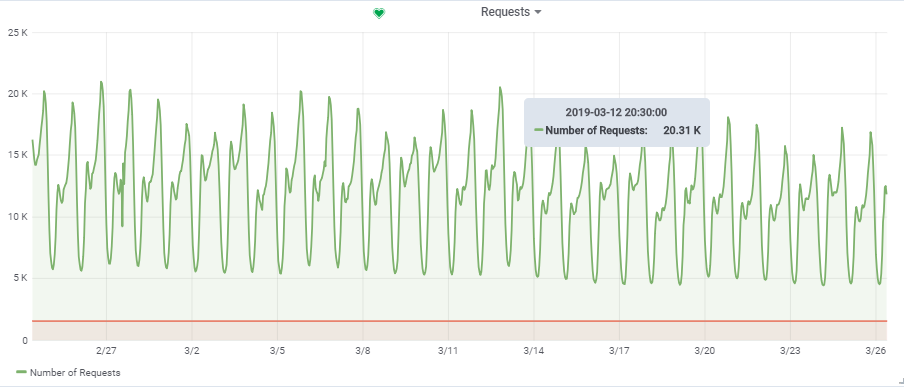
Thus, our target load is ~ 20,000 requests / s at 150,000 VU.
In a previous article, I already talked about automating the entire process of load testing. Further, I may repeat myself a little, but I will tell you some points in more detail.

In the diagram, the blue squares are our hypervisors (HV), a cloud consisting of many servers (Dell M620 - M640). On each HV, a dozen virtual machines (VMs) are launched via KVM (web / app and db in the mix). When creating any new VM, balancing and searching through the set of parameters of a suitable HV occurs and it is not initially known which server it will be on.
But for our db1 purpose, we reserved a separate HV targer_hypervisor based on the M630.
Targer_hypervisor at a glance:
Dell M_630
Model name: Intel® Xeon® CPU E5-2680 v3 @ 2.50GHz
CPU (s): 48
Thread (s) per core: 2
Core (s) per socket: 12
Socket (s): 2
RAM : 128 GB
Debian GNU / Linux 9 (stretch)
4.9.0-8-amd64 # 1 SMP Debian 4.9.130-2 (2018-10-27)
Brief characteristics of db1:
Architecture: x86_64
CPU (s): 48
RAM: 64 GB
4.9.0-8-amd64 # 1 SMP Debian 4.9.144-3.1 (2019-02-19) x86_64 GNU / Linux
Debian GNU / Linux 9 ( stretch)
psql (PostgreSQL) 11.2 (Debian 11.2-1.pgdg90 + 1)
hot_standby_feedback defaults to off, we had it turned on, but later it had to be turned off to conduct a successful test. I will explain later why.
The main active tables in the database (construction, production, game_entity, building, core_inventory_player_resource, survivor) are pre-filled with data (approximately 80GB) using a bash script.
Replication:
Then, on productive HV (prod_hypervisors) of various configurations and capacities, 15 app servers were launched: 8 cores, 4GB. The main thing that can be said: openjdk 11.0.1 2018-10-16, spring, interaction with the database via hikari (hikari.maximum-pool-size: 50)
The whole load testing environment consists of one main server admin.loadtest , and several generatorN.loadtest servers (in this case there were 14).
generatorN.loadtest - "bare" VM Debian Linux 9, with installed Java 8. 32 kernels / 32 gigabytes. They are located on the “non-productive” HV, so as not to accidentally kill the performance of important VMs.
admin.loadtest - Debian Linux 9 virtual machine , 16 cores / 16 gigs, it runs Jenkins, JLTC and other additional unimportant software.
JLTC - jmeter load test center . A system in Py / Django that controls and automates the launch of tests, as well as the analysis of results.

The process of running the test looks like this:
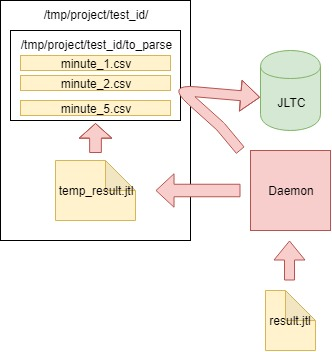
During the test, the JMeter-client generates a CSV file with the results. So during the test, the amount of data and the size of this file grows at a crazy pace, and it cannot be used for analysis after the test - Daemon was invented (as an experiment) , which parses it "on the fly . "
You can download the test plan here .
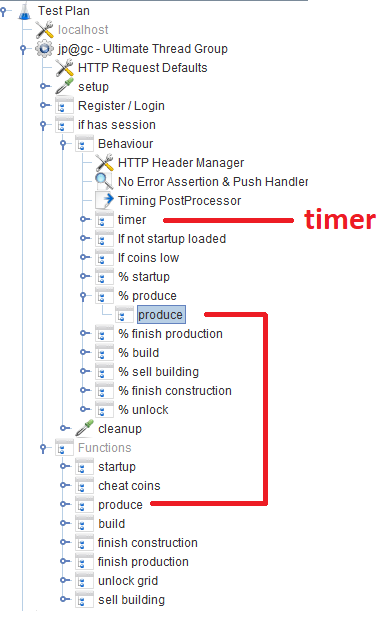
After registration / login, users work in the Behavior module , which consists of several Throughput controllers that specify the likelihood of a particular game function. In each Throughput controller, there is a Module controller , which refers to the corresponding module that implements the function.
During the development of the script, we tried to use Groovy to the fullest, and thanks to our Java programmer, I discovered a couple of tricks for myself (maybe it will be useful for someone):
When the user enters the desired number of VUs using the THREAD_COUNT_TOTAL parameter when configuring the job in Jenkins, it is necessary to somehow start the required number of Jmeter servers and distribute the final number of VUs between them. This part lies with the JLTC in the part called controller / provision .
In essence, the algorithm is as follows:
In our case, the test took place simultaneously from 300 Jmeter servers, 500 threads each, the launch format of one Jmeter server with Java parameters looked like this:
The task is to determine how much our database can withstand, rather than overloading it and the entire system as a whole to a critical state. With so many Jmeter servers, you need to somehow maintain the load at a certain level and not kill the whole system. The TARGET_RESPONSE_TIME parameter specified when starting the test is responsible for this . We agreed that 50ms is the optimal response time for which the system should be responsible.
In JMeter, by default, there are many different timers that allow you to control throughput, but it is not known where to get it in our case. But there is JSR223-Timer with which you can come up with something using the current system response time . The timer itself is in the main unitBehavior :

In addition to the graphs in Grafana, you must also have aggregated test results so that the tests can be subsequently compared in JLTC.
One such test generates 16k-20k requests per second, it is easy to calculate that in 4 hours it generates a CSV file of a couple of hundred GB in size, so it was necessary to come up with a job that parses data every minute, sends it to the database and cleans the main file.
The algorithm is as follows:
Daemon itself starts in cron.d every minute:
daemon starts every minute with cron.d:
Thus, the file with the results does not swell to inconceivable sizes, but is analyzed on the fly and cleared.
Our 150,000 virtual players:

The test tries to “match” the response time of 50ms, so the load itself constantly jumps in the region between 16k-18k requests / c:
Load application servers (15 app). Two servers were “unlucky" to end up on the slower M620:
Database response time (for app servers):

CPU util on db1 (VM):
CPU util on the hypervisor:
The load on the virtual machine is lower because it believes that it has 48 real cores at its disposal, in fact there are 24 hyperthreading cores on the hypervisor .
A maximum of ~ 250K queries / s goes to the database , consisting of (83% selects, 3% - inserts, 11.6% - updates (90% HOT), 1.6% deletes):

With the default value autovacuum_vacuum_scale_factor= 0.2, the number of dead tuples grew very rapidly during the test (with an increase in the size of the tables), which led several times to short problems with database performance, which several times ruined the entire test. I had to “tame” this growth for some tables by assigning personal values to this parameter autovacuum_vacuum_scale_factor:
Ideally, rows_fetched should be close to rows_returned, which we, fortunately, we observe:
The problem was with the hot_standby_feedback parameter , which can greatly affect the performance of the main server if its standby servers do not have time to apply changes from WAL files. The documentation (https://postgrespro.ru/docs/postgrespro/11/runtime-config-replication) states that it “determines whether the hot standby server will notify the master or higher slave about the requests that it is currently executing.” it defaults to off, but was turned on in our config. Which led to sad consequences, if there are 2 standby servers and the replication lag during the load is different from zero (for various reasons), you can observe such a picture, which can lead to the collapse of the entire test:

All due to the fact that when the hot_standby_feedback the VACUUM does not want to remove the "dead" tuples, if the standby server behind in their transaction id, to prevent replication conflicts. Detailed article What hot_standby_feedback in PostgreSQL really does :
Such a large number of dead tuples leads to the picture shown above. Here are two tests, with hot_standby_feedback turned on and off:
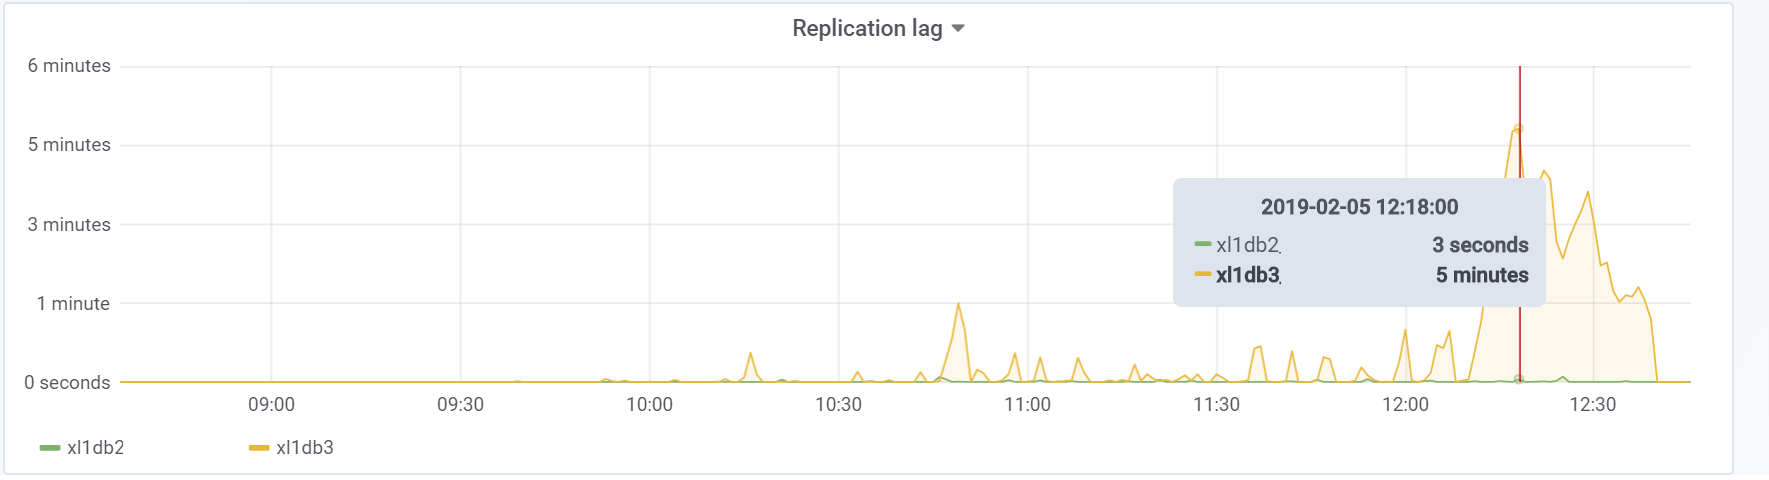
And this is our replication lag during the test, with which you will need to do something in the future:
This test, fortunately (or unfortunately for the content of the article) showed that at this stage of the prototype of the game it is quite possible to absorb the desired load on the part of users, which is enough to give green light for further prototyping and development. In the subsequent stages of development, it is necessary to follow the basic rules (to keep simplicity of the executed queries, to prevent an overabundance of indexes, as well as non-indexed readings, etc.) and most importantly, test the project at each significant stage of development to find and fix problems as can be earlier. Perhaps soon, I will write an article as we have already solved specific problems.
Good luck everyone!
Our GitHub just in case;)
I work for a gaming company that develops online games. Currently, all our games are divided into many “markets” (one “market” per country) and in each “market” there are a dozen worlds between which players are distributed during registration (well, or sometimes they can choose it themselves). Each world has one database and one or more web / app servers. Thus, the load is divided and distributed across the worlds / servers almost evenly and as a result we get the maximum online of 6K-8K players (this is the maximum, mostly several times less) and 200-300 requests per prime time per world.
Such a structure with the division of players into markets and worlds is becoming obsolete; players want something global. In the last games, we stop dividing people by country and left only one / two markets (America and Europe), but still with many worlds in each. The next step will be the development of games with a new architecture and the unification of all players in one single world with one database .
Today I wanted to talk a little bit about how I was tasked with checking what if the whole online (and this is 50-200 thousand users at a time) of one of our popular games “send” to play the next game built on the new architecture and whether whole system, especially database ( PostgreSQL 11) practically withstand such a load and, if it can’t, find out where our maximum is. I’ll tell you a little about the problems that have arisen and the decisions to prepare for testing so many users, the process itself and a little about the results.
Intro
In the past, at InnoGames GmbH, each game team created a game project to their taste and color, often using different technologies, programming languages, and databases. In addition, we have many external systems responsible for payments, sending push notifications, marketing and more. To work with these systems, developers also created their unique interfaces as best they could.
There is a lot of money in the mobile gaming business right nowand, accordingly, huge competition. Here it is very important to get it back from each dollar spent on marketing and a little more from above, therefore all game companies very often “close” games even at the stage of closed testing, if they do not meet the analytical expectations. Accordingly, losing time on the invention of the next wheel is unprofitable, so it was decided to create a unified platform that will provide developers with a ready-made solution for integration with all external systems, a database with replication and all best-practices. All that developers need is to develop and “put” a good game on top of this and not waste time on development not related to the game itself.
This platform is called GameStarter :
So, to the point. All future InnoGames games will be built on this platform, which has two databases - master and game (PostgreSQL 11). Master stores basic information about the players (login, password, etc.) and participates, mainly, only in the process of login / registration in the game itself. Game - the database of the game itself, where, accordingly, all game data and entities are stored, which is the core of the game, where the whole load will go.
Thus, the question arose whether this whole structure could withstand such a potential number of users equal to the maximum online of one of our most popular games.
Task
The task itself was this: to check whether the database (PostgreSQL 11), with replication enabled, can withstand all the load that we currently have in the most loaded game, having at its disposal the entire PowerEdge M630 hypervisor (HV).
I ’ll clarify that the task at the moment was only to verify , using the existing database configs, which we formed taking into account best-practices and our own experience.
I’ll say right away the database, and the whole system showed itself well, with the exception of a couple of points. But this particular game project was at the prototype stage and in the future, with the complication of game mechanics, requests to the database will become more complicated and the load itself may increase significantly and its nature may change. To prevent this, it is necessary to iteratively test the project with each more or less significant milestone. Automating the ability to run these kinds of tests with a couple of hundreds of thousands of users has become the main task at this stage.
Profile
Like any load testing, it all starts with a load profile.
Our potential value CCU60 (CCU is the maximum number of users for a certain period of time, in this case 60 minutes) is taken to be 250,000 users. The number of competitive virtual users (VUs) is lower than the CCU60 and analysts have suggested that it can be safely divided into two. Round up and accept 150,000 competitive VUs.
The total number of requests per second was taken from one rather loaded game:
Thus, our target load is ~ 20,000 requests / s at 150,000 VU.
Structure
Characteristics of the “stand”
In a previous article, I already talked about automating the entire process of load testing. Further, I may repeat myself a little, but I will tell you some points in more detail.
In the diagram, the blue squares are our hypervisors (HV), a cloud consisting of many servers (Dell M620 - M640). On each HV, a dozen virtual machines (VMs) are launched via KVM (web / app and db in the mix). When creating any new VM, balancing and searching through the set of parameters of a suitable HV occurs and it is not initially known which server it will be on.
Database (Game DB):
But for our db1 purpose, we reserved a separate HV targer_hypervisor based on the M630.
Targer_hypervisor at a glance:
Dell M_630
Model name: Intel® Xeon® CPU E5-2680 v3 @ 2.50GHz
CPU (s): 48
Thread (s) per core: 2
Core (s) per socket: 12
Socket (s): 2
RAM : 128 GB
Debian GNU / Linux 9 (stretch)
4.9.0-8-amd64 # 1 SMP Debian 4.9.130-2 (2018-10-27)
Detailed specifications
Debian GNU / Linux 9 (stretch)
4.9.0-8-amd64 # 1 SMP Debian 4.9.130-2 (2018-10-27)
lscpu
Architecture: x86_64
CPU op-mode (s): 32-bit, 64-bit
Byte Order: Little Endian
CPU (s): 48
On-line CPU (s) list: 0-47
Thread (s) per core: 2
Core (s) per socket: 12
Socket (s): 2
NUMA node (s) : 2
Vendor ID: GenuineIntel
CPU family: 6
Model: 63
Model name: Intel® Xeon® CPU E5-2680 v3 @ 2.50GHz
Stepping: 2
CPU MHz: 1309.356
CPU max MHz: 3300.0000
CPU min MHz: 1200.0000
BogoMIPS: 4988.42
Virtualization: VT-x
L1d cache: 32K
L1i cache: 32K
L2 cache: 256K
L3 cache: 30720K
NUMA node0 CPU (s): 0,2,4,6,8,10,12,14,16,18,20,22,24,26,28,30,32,34,36,38 , 40.42.44.46
NUMA node1 CPU (s): 1,3,5,7,9,11,13,15,17,19,21,23,25,27,29,31,33,35 , 37,39,41,43,45,47
Flags: fpu vme de pse tsc msr pae mce cx8 apic sep mtrr pge mca cmov pat pse36 clflush dts acpi mmx fxsr sse sse2 ss ht tm pbe syscall nx pdpe1gb rdtscp lm constant qtsopmopcoptsoptsopts btsoptsoptsoptsopts btsopts bts smx est tm2 ssse3 sdbg fma cx16 xtpr pdcm pcid dca sse4_1 sse4_2 x2apic movbe popcnt tsc_deadline_timer aes xsave avx f16c rdrand lahf_lm abm epb invpcid_single ssbd ibrs ibpb stibp kaiser tpr_shadow vnmi flexpriority ept vpid fsgsbase tsc_adjust bmi1 avx2 smep bmi2 erms invpcid cqm xsaveopt cqm_llc cqm_occup_llc dtherm ida arat pln pts flush_l1d
/ usr / bin / qemu-system-x86_64 --version
QEMU emulator version 2.8.1 (Debian 1: 2.8 + dfsg-6 + deb9u5)
Copyright © 2003-2016 Fabrice Bellard and the QEMU Project developers
Brief characteristics of db1:
Architecture: x86_64
CPU (s): 48
RAM: 64 GB
4.9.0-8-amd64 # 1 SMP Debian 4.9.144-3.1 (2019-02-19) x86_64 GNU / Linux
Debian GNU / Linux 9 ( stretch)
psql (PostgreSQL) 11.2 (Debian 11.2-1.pgdg90 + 1)
PostgreSQL config with some explanations
seq_page_cost = 1.0
random_page_cost = 1.1 # We have SSDs
include '/etc/postgresql/11/main/extension.conf'
log_line_prefix = '% t [% p-% l]% q% u @% h'
log_checkpoints = on
log_lock_waits = on
log_statement = ddl
log_min_duration_statement = 100
log_temp_files = 0
autovacuum_max_workers = 5
autovacuum_naptime = 10s
autovacuum_vacuum_cost_delay = 20ms
vacuum_cost_limit = 2000
maintenance_work_mem = 128MB
synchronous_commit = off
checkpoint_timeout = 30min
listen_addresses = '*'
work_mem = 32MB
effective_cache_size = 26214MB # 50% of the available memory
shared_buffers = 16384MB # 25% of available memory
= 15GB max_wal_size
min_wal_size = 80MB
wal_level = hot_standby
max_wal_senders = 10
wal_compression = on
archive_mode = on
archive_command = '/ bin / true'
archive_timeout = 1800
hot_standby = on
wal_log_hints = on
hot_standby_feedback = on
hot_standby_feedback defaults to off, we had it turned on, but later it had to be turned off to conduct a successful test. I will explain later why.
The main active tables in the database (construction, production, game_entity, building, core_inventory_player_resource, survivor) are pre-filled with data (approximately 80GB) using a bash script.
db-fill-script.sh
#!/bin/bash
--clean
TRUNCATE TABLE production CASCADE;
TRUNCATE TABLE construction  CASCADE;
TRUNCATE TABLE building  CASCADE;
TRUNCATE TABLE grid  CASCADE;
TRUNCATE TABLE core_inventory_player_resource  CASCADE;
TRUNCATE TABLE survivor  CASCADE;
TRUNCATE TABLE city  CASCADE;
TRUNCATE TABLE game_entity  CASCADE;
TRUNCATE TABLE player  CASCADE;
TRUNCATE TABLE core_player  CASCADE;
TRUNCATE TABLE core_client_device  CASCADE;
--core_client_device
INSERT INTO core_client_device (id, creation_date, modification_date, device_model, device_name, locale, platform, user_agent, os_type, os_version, network_type, device_type) SELECT  (1000000000+generate_series(0,999999))  AS id, now(), now(), 'device model', 'device name', 'en_DK', 'ios', 'ios user agent', 'android', '8.1', 'wlan', 'browser';
--core_player
INSERT INTO core_player (id, guest, name, nickname, premium_points, soft_deleted, session_id, tracking_device_data_id) SELECT  (1000000000+generate_series(0,999999))  AS id, true, 'guest0000000000000000000', null, 100, false, '00000000-0000-0000-0000-000000000000',  (1000000000+generate_series(0,999999)) ;
--player
INSERT INTO player (id, creation_date, modification_date, core_player_id) SELECT  (1000000000+generate_series(0,999999)) , now(), now(),  (1000000000+generate_series(0,999999)) ;
--city
INSERT INTO game_entity (id, type, creation_date, modification_date) SELECT  (1000000000+generate_series(0,999999)) , 'city', now(), now();
INSERT INTO city (id, game_design, player_id) SELECT  (1000000000+generate_series(0,999999)) , 'city.default',  (1000000000+generate_series(0,999999)) ;
--survivor
INSERT INTO game_entity (id, type, creation_date, modification_date) SELECT  (1001000000+generate_series(0,999999)) , 'survivor', now(), now();
INSERT INTO survivor (id, game_design, owning_entity_id, type) SELECT  (1001000000+generate_series(0,999999)) , 'survivor.prod_1',  (1000000000+generate_series(0,999999)) , 'survivor';
--core_inventory_player_resource
INSERT INTO core_inventory_player_resource (id, creation_date, modification_date, amount, player_id, resource_key) SELECT  (1000000000+generate_series(0,1999999)) , NOW(), NOW(), 1000,  (1000000000+generate_series(0,1999999)/2) , CONCAT('resource_',  (1000000000+generate_series(0,1999999))  % 2);
--grid
DROP INDEX grid_area_idx;
INSERT INTO grid (id, creation_date, modification_date, area, city_id) SELECT  (1000000000+generate_series(0,19999999)) , NOW(), NOW(), BOX '0,0,4,4',  (1000000000+generate_series(0,19999999)/20) ;
create index on grid using gist (area box_ops);
--building
INSERT INTO game_entity (id, type, creation_date, modification_date) SELECT  (1002000000+generate_series(0,99999999)) , 'building', now(), now();
INSERT INTO building (id, game_design, owning_entity_id, x, y, rotation, type) SELECT  (1002000000+generate_series(0,99999999)) , 'building.building_prod_1',  (1000000000+generate_series(0,99999999)/100) , 0, 0, 'DEGREES_0', 'building';
--construction
INSERT INTO construction (id, creation_date, modification_date, definition, entity_id, start) SELECT  (1000000000+generate_series(0,1999999)) , NOW(), NOW(), 'construction.building_prod_1-construction',  (1002000000+generate_series(0,1999999)*50) , NOW();
--production
INSERT INTO production (id, creation_date, modification_date, active, definition, entity_id, start_time) SELECT  (1000000000+generate_series(0,49999999)) , NOW(), NOW(), true, 'production.building_prod_1_production_1',  (1002000000+generate_series(0,49999999)*2) , NOW();
Replication:
SELECT * FROM pg_stat_replication;
 pid | usesysid | usename |  application_name   | client_addr  |   client_hostname   | client_port |         backend_start         | backend_xmin |   state   |  sent_lsn  | write_lsn  | flush_lsn  | replay_lsn |    write_lag    |    flush_lag    |   replay_lag    | sync_priority | sync_state
-----+----------+---------+---------------------+--------------+---------------------+-------------+-------------------------------+--------------+-----------+------------+------------+------------+------------+-----------------+-----------------+-----------------+---------------+------------
 759 |    17035 | repmgr  | xl1db2 | xxxx  | xl1db2 |       51142 | 2019-01-27 08:56:44.581758+00 |              | streaming | 18/424A9F0 | 18/424A9F0 | 18/424A9F0 | 18/424A9F0 | 00:00:00.000393 | 00:00:00.001159 | 00:00:00.001313 |             0 | async
 977 |    17035 | repmgr  | xl1db3 |xxxxx | xl1db3 |       42888 | 2019-01-27 08:57:03.232969+00 |              | streaming | 18/424A9F0 | 18/424A9F0 | 18/424A9F0 | 18/424A9F0 | 00:00:00.000373 | 00:00:00.000798 | 00:00:00.000919 |             0 | async
Application server
Then, on productive HV (prod_hypervisors) of various configurations and capacities, 15 app servers were launched: 8 cores, 4GB. The main thing that can be said: openjdk 11.0.1 2018-10-16, spring, interaction with the database via hikari (hikari.maximum-pool-size: 50)
Stress test environment
The whole load testing environment consists of one main server admin.loadtest , and several generatorN.loadtest servers (in this case there were 14).
generatorN.loadtest - "bare" VM Debian Linux 9, with installed Java 8. 32 kernels / 32 gigabytes. They are located on the “non-productive” HV, so as not to accidentally kill the performance of important VMs.
admin.loadtest - Debian Linux 9 virtual machine , 16 cores / 16 gigs, it runs Jenkins, JLTC and other additional unimportant software.
JLTC - jmeter load test center . A system in Py / Django that controls and automates the launch of tests, as well as the analysis of results.
Test Launch Scheme
The process of running the test looks like this:
- The test is launched from Jenkins . Select the required Job, then you need to enter the desired test parameters:
- DURATION - test duration
- RAMPUP - “warm-up” time
- THREAD_COUNT_TOTAL - the desired number of virtual users (VU) or threads
- TARGET_RESPONSE_TIME is an important parameter, so as not to overload the entire system with it, we set the desired response time, so the test will keep the load at a level at which the response time of the entire system is no more than the specified one.
- Launch
- Jenkins clones the test plan from Gitlab, sends it to JLTC.
- JLTC works a bit with a test plan (for example, inserts a CSV simple writer).
- JLTC calculates the required number of Jmeter servers to run the desired number of VUs (THREAD_COUNT_TOTAL).
- JLTC connects to each loadgeneratorN generator and starts the jmeter server.
During the test, the JMeter-client generates a CSV file with the results. So during the test, the amount of data and the size of this file grows at a crazy pace, and it cannot be used for analysis after the test - Daemon was invented (as an experiment) , which parses it "on the fly . "
Test plan
You can download the test plan here .
After registration / login, users work in the Behavior module , which consists of several Throughput controllers that specify the likelihood of a particular game function. In each Throughput controller, there is a Module controller , which refers to the corresponding module that implements the function.
Off-topic
During the development of the script, we tried to use Groovy to the fullest, and thanks to our Java programmer, I discovered a couple of tricks for myself (maybe it will be useful for someone):
- You can declare a function somewhere at the beginning of the test plan, and then use it in other pre-, post-processors and samplers. More Groovy Goodness: Turn Methods into Closures :
// Объявляем метод в начале тест-плана def sum(Integer x, Integer y) { return x + y } vars.putObject(‘sum’, this.&sum) // я не знаю как перевести closure. Может кто подскажет. // Теперь в любом другом sampler`е достаём метод и работаем с ним def sum= vars.getObject(‘sum’); println sum(2, 2); - groovy.json.JsonSlurper is a great fast JSON parser. Together with groovy, it allows you to elegantly parse data and process it:
import groovy.json.JsonSlurper
def canBuild =  vars.getObject(canBuild); // "Достаём" заранее подготовленную функцию для условной проверки
def content = jsonSlurper.parseText(response).content
def buildings = content[0].buildings // Берем массив с информацией о зданиях из респонса
// Далее элегантно проходимся по зданиям и вызываем вышеуказанную функцию для проверки возможности постройки здания
def constructableBuildingDefs = buildings
	.collect { k,v -> v }
	.grep{ it.definitions
		.grep { it2 -> it2['@type'] == 'type.googleapis.com/ConstructionDefinitionDTO'}
		.grep { it2 -> canBuild(it2) }  // Здесь проверка
		.size() > 0
	}
if (!constructableBuildingDefs) {
	return;
}
Collections.shuffle(constructableBuildingDefs) // Берем рандомное из отобранных зданий и строим
VU / Threads
When the user enters the desired number of VUs using the THREAD_COUNT_TOTAL parameter when configuring the job in Jenkins, it is necessary to somehow start the required number of Jmeter servers and distribute the final number of VUs between them. This part lies with the JLTC in the part called controller / provision .
In essence, the algorithm is as follows:
- We divide the desired number of VU threads_num into 200-300 threads and based on the more or less adequate size -Xmsm -Xmxm we determine the required memory value for one jmeter-server required_memory_for_jri (JRI - I call Jmeter remote instance, instead of Jmeter-server).
- From threads_num and required_memory_for_jri we find the total number of jmeter-server: target_amount_jri and the total value of the required memory: required_memory_total .
- We sort through all the loadgeneratorN generators one by one and start the maximum number of jmeter-servers based on the available memory on it. As long as the number of running current_amount_jri instances is not equal to target_amount_jri.
- (If the number of generators and the total memory is not enough, add a new one to the pool)
- We connect to each generator, using netstat we remember all the busy ports, and run on random ports (which are unoccupied) the required number of jmeter-servers:
netstat_cmd= 'netstat -tulpn | grep LISTEN' stdin, stdout, stderr = ssh.exec_command(cmd1) used_ports = [] netstat_output = str(stdout.readlines()) ports = re.findall('\d+\.\d+\.\d+\.\d+\:(\d+)', netstat_output) ports_ipv6 = re.findall('\:\:\:(\d+)', netstat_output) p.wait() for port in ports: used_ports.append(int(port)) for port in ports_ipv6: used_ports.append(int(port)) ssh.close() for i in range(1, possible_jris_on_host + 1): port = int(random.randint(10000, 20000)) while port in used_ports: port = int(random.randint(10000, 20000)) # ... Запускаем Jmeter-сервер на найденном рандомном порту - We collect all running jmeter-servers in one time in the format address: port, for example generator13: 15576, generator9: 14015, generator11: 19152, generator14: 12125, generator2: 17602
- The resulting list and threads_per_host are sent to the JMeter-client when the test starts:
REMOTE_TESTING_FLAG=" -R $REMOTE_HOSTS_STRING"
java -jar -Xms7g -Xmx7g -Xss228k $JMETER_DIR/bin/ApacheJMeter.jar -Jserver.rmi.ssl.disable=true -n -t $TEST_PLAN -j $WORKSPACE/loadtest.log -GTHREAD_COUNT=$THREADS_PER_HOST $OTHER_VARS $REMOTE_TESTING_FLAG -Jjmeter.save.saveservice.default_delimiter=,
In our case, the test took place simultaneously from 300 Jmeter servers, 500 threads each, the launch format of one Jmeter server with Java parameters looked like this:
nohup java -server -Xms1200m -Xmx1200m -Xss228k -XX:+DisableExplicitGC -XX:+CMSClassUnloadingEnabled -XX:+UseCMSInitiatingOccupancyOnly -XX:CMSInitiatingOccupancyFraction=70 -XX:+ScavengeBeforeFullGC -XX:+CMSScavengeBeforeRemark -XX:+UseConcMarkSweepGC -XX:+CMSParallelRemarkEnabled -Djava.net.preferIPv6Addresses=true -Djava.net.preferIPv4Stack=false -jar "/tmp/jmeter-JwKse5nY/bin/ApacheJMeter.jar" -Jserver.rmi.ssl.disable=true "-Djava.rmi.server.hostname=generator12.loadtest.ig.local" -Duser.dir=/tmp/jmeter-JwKse5nY/bin/ -Dserver_port=13114 -s -Jpoll=49 > /dev/null 2>&150ms
The task is to determine how much our database can withstand, rather than overloading it and the entire system as a whole to a critical state. With so many Jmeter servers, you need to somehow maintain the load at a certain level and not kill the whole system. The TARGET_RESPONSE_TIME parameter specified when starting the test is responsible for this . We agreed that 50ms is the optimal response time for which the system should be responsible.
In JMeter, by default, there are many different timers that allow you to control throughput, but it is not known where to get it in our case. But there is JSR223-Timer with which you can come up with something using the current system response time . The timer itself is in the main unitBehavior :
// Изначальные параметры и значение таймера = 0
vars.put('samples', '20');
vars.putObject('respAvg', ${TARGET_RESPONSE_TIME}.0);
vars.putObject('sleep', 0.0);
// В JSR223-Timer в зависимости от среднего времени отклика понижаем или повышаем время "засыпания"
double sleep = vars.getObject('sleep');
double respAvg = vars.getObject('respAvg');
double previous = sleep;
double target = ${TARGET_RESPONSE_TIME};
if (respAvg < target) {
	sleep /= 1.5;
}
if (respAvg > target) {
	sleep *= 1.1;
}
sleep = Math.max(10, sleep);
// Чтоб не ждали дольше таймаута
sleep = Math.min(20000, sleep);
vars.putObject('sleep', sleep);
return (int)sleep;
Analysis of the results (daemon)
In addition to the graphs in Grafana, you must also have aggregated test results so that the tests can be subsequently compared in JLTC.
One such test generates 16k-20k requests per second, it is easy to calculate that in 4 hours it generates a CSV file of a couple of hundred GB in size, so it was necessary to come up with a job that parses data every minute, sends it to the database and cleans the main file.
The algorithm is as follows:
- We read the data from the CSV file result.jtl generated by the jmeter-client , save it and clean the file (you need to clean it correctly, otherwise the empty-looking file will have the same FD with the same size):
with open(jmeter_results_file, 'r+') as f: rows = f.readlines() f.seek(0) f.truncate(0) f.writelines(rows[-1]) - We write the read data to the temporary file temp_result.jtl :
rows_num = len(rows) open(temp_result_filename, 'w').writelines(rows[0:rows_num]) # avoid last line - We read the file temp_result.jtl . We distribute the read data "in minutes":
for r in f.readlines(): row = r.split(',') if len(row[0]) == 13: ts_c = int(row[0]) dt_c = datetime.datetime.fromtimestamp(ts_c/1000) minutes_data.setdefault(dt_c.strftime('%Y_%m_%d_%H_%M'), []).append(r) - The data for each minute from minutes_data is written to the corresponding file in the to_parse / folder . (thus, at the moment, every minute of the test has its own data file, then during aggregation it will not matter in what order the data came into each file):
for key, value in minutes_data.iteritems(): # В качестве имени файла используем timestamp (key) temp_ts_file = os.path.join(temp_to_parse_path, key) open(temp_ts_file, 'a+').writelines(value) - Along the way, we analyze the files in the to_parse folder and if any of them did not change within a minute, then this file is a candidate for data analysis, aggregation and sending to the JLTC database:
for filename in os.listdir(temp_to_parse_path): data_file = os.path.join(temp_to_parse_path, filename) file_mod_time = os.stat(data_file).st_mtime last_time = (time.time() - file_mod_time) if last_time > 60: logger.info('[DAEMON] File {} was not modified since 1min, adding to parse list.'.format(data_file)) files_to_parse.append(data_file) - If there are such files (one or several), then we send them parsed to the parse_csv_data function (each file in parallel):
for f in files_to_parse:
           logger.info('[DAEMON THREAD] Parse {}.'.format(f))
           t = threading.Thread(
           target=parse_csv_data, args=(
               f,
               jmeter_results_file_fields, test, data_resolution))
           t.start()
           threads.append(t)
       for t in threads:
           t.join()
Daemon itself starts in cron.d every minute:
daemon starts every minute with cron.d:
* * * * * root sleep 21 && /usr/bin/python /var/lib/jltc/manage.py daemonThus, the file with the results does not swell to inconceivable sizes, but is analyzed on the fly and cleared.
results
The app
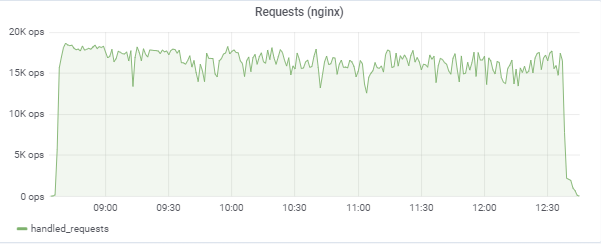
Our 150,000 virtual players:
The test tries to “match” the response time of 50ms, so the load itself constantly jumps in the region between 16k-18k requests / c:
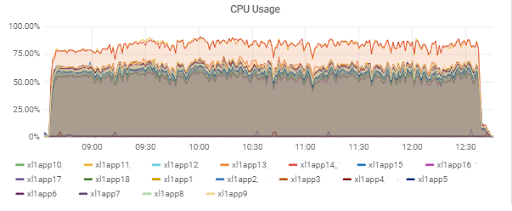
Load application servers (15 app). Two servers were “unlucky" to end up on the slower M620:
Database response time (for app servers):
Database
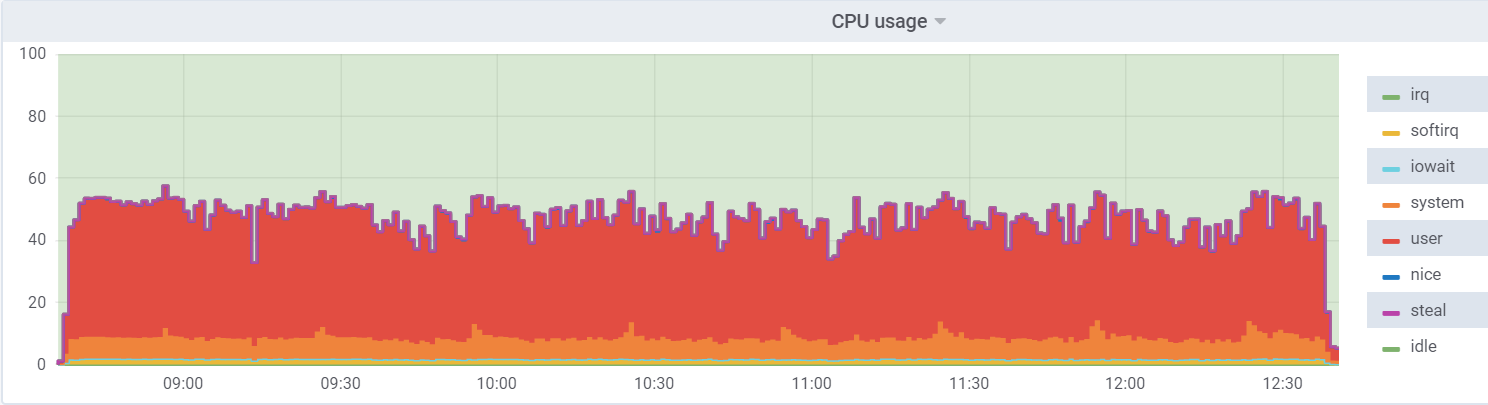
CPU util on db1 (VM):
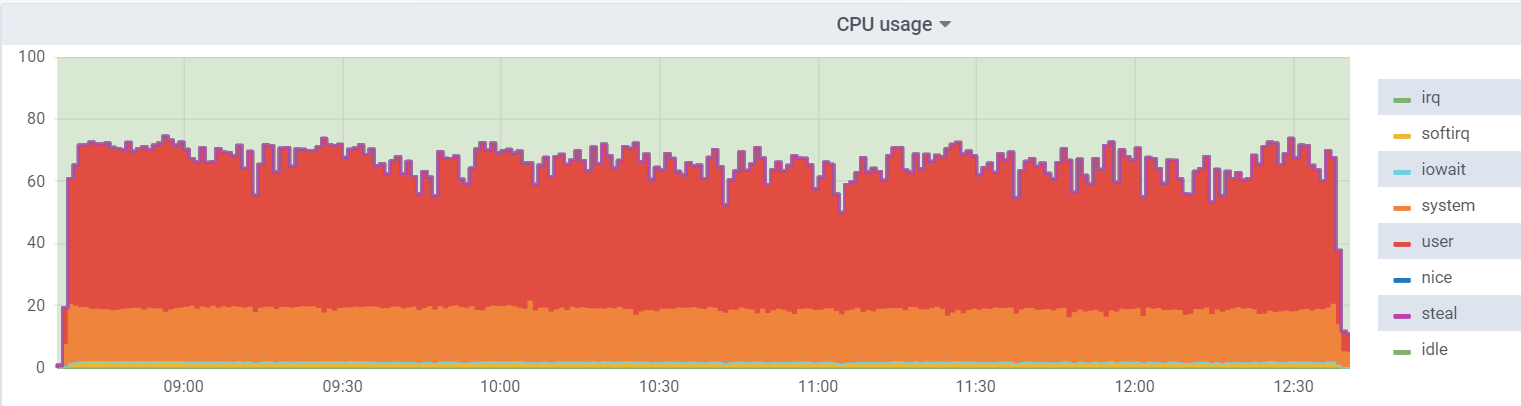
CPU util on the hypervisor:
The load on the virtual machine is lower because it believes that it has 48 real cores at its disposal, in fact there are 24 hyperthreading cores on the hypervisor .
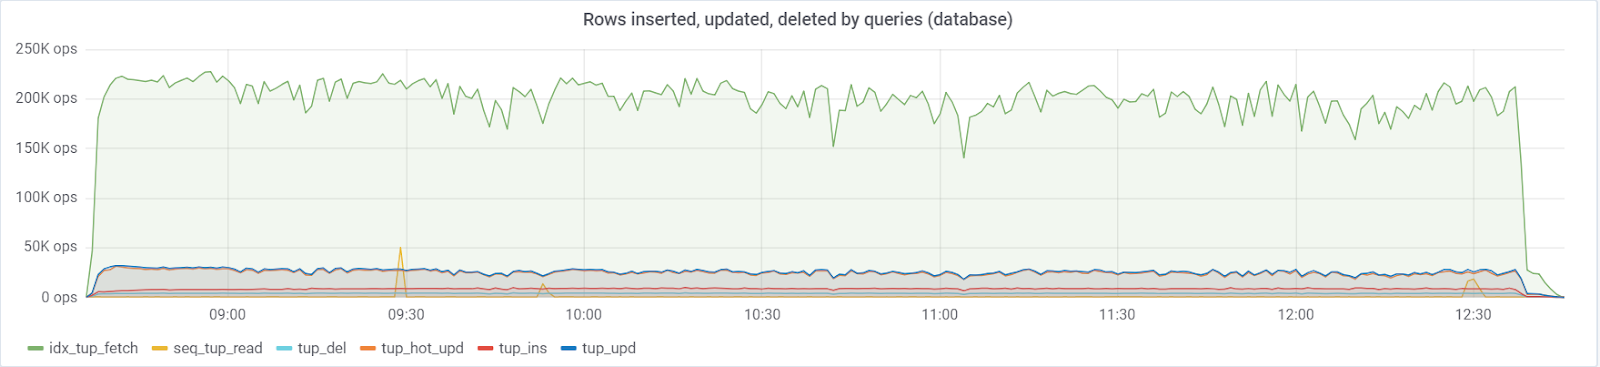
A maximum of ~ 250K queries / s goes to the database , consisting of (83% selects, 3% - inserts, 11.6% - updates (90% HOT), 1.6% deletes):
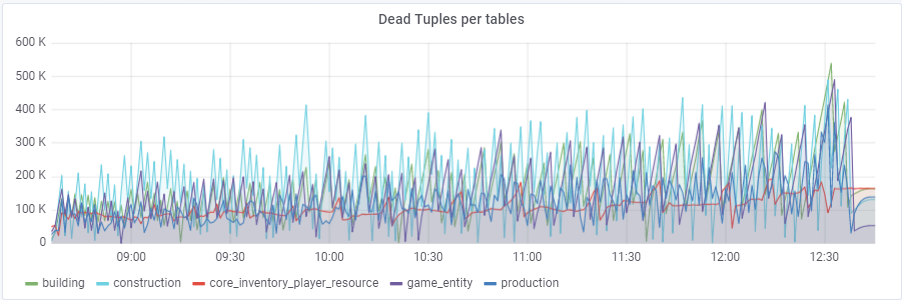
With the default value autovacuum_vacuum_scale_factor= 0.2, the number of dead tuples grew very rapidly during the test (with an increase in the size of the tables), which led several times to short problems with database performance, which several times ruined the entire test. I had to “tame” this growth for some tables by assigning personal values to this parameter autovacuum_vacuum_scale_factor:
ALTER TABLE ... SET (autovacuum_vacuum_scale_factor = ...)
ALTER TABLE construction SET (autovacuum_vacuum_scale_factor = 0.10);
ALTER TABLE production SET (autovacuum_vacuum_scale_factor = 0.01);
ALTER TABLE game_entity SET (autovacuum_vacuum_scale_factor = 0.01);
ALTER TABLE game_entity SET (autovacuum_analyze_scale_factor = 0.01);
ALTER TABLE building SET (autovacuum_vacuum_scale_factor = 0.01);
ALTER TABLE building SET (autovacuum_analyze_scale_factor = 0.01);
ALTER TABLE core_inventory_player_resource SET (autovacuum_vacuum_scale_factor = 0.10);
ALTER TABLE survivor SET (autovacuum_vacuum_scale_factor = 0.01);
ALTER TABLE survivor SET (autovacuum_analyze_scale_factor = 0.01);
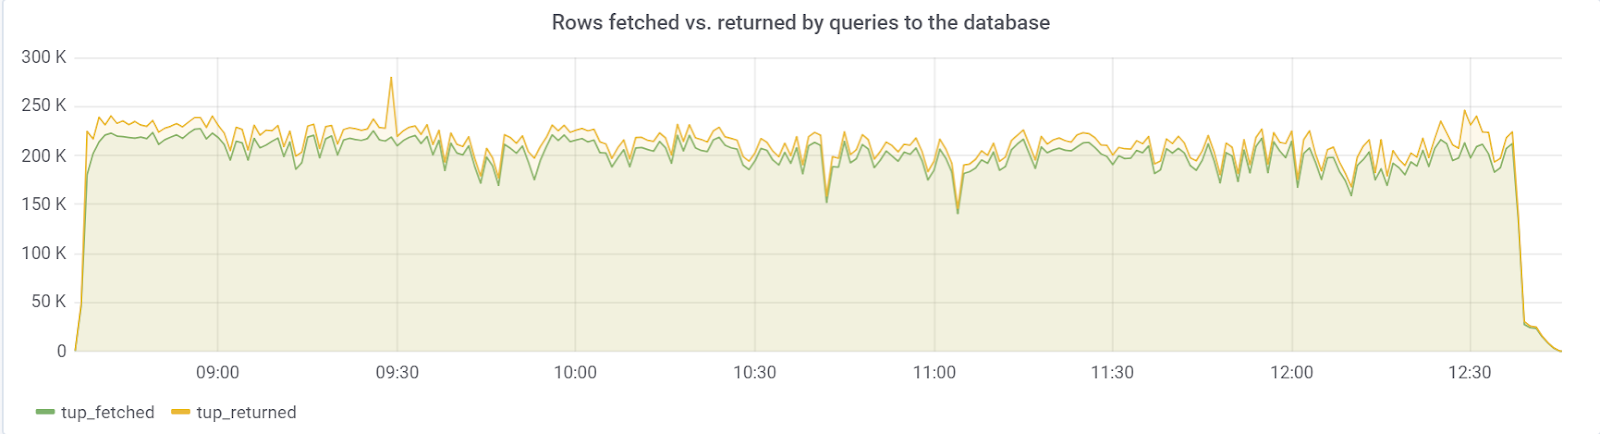
Ideally, rows_fetched should be close to rows_returned, which we, fortunately, we observe:
hot_standby_feedback
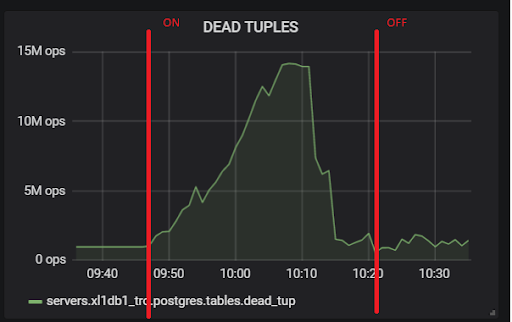
The problem was with the hot_standby_feedback parameter , which can greatly affect the performance of the main server if its standby servers do not have time to apply changes from WAL files. The documentation (https://postgrespro.ru/docs/postgrespro/11/runtime-config-replication) states that it “determines whether the hot standby server will notify the master or higher slave about the requests that it is currently executing.” it defaults to off, but was turned on in our config. Which led to sad consequences, if there are 2 standby servers and the replication lag during the load is different from zero (for various reasons), you can observe such a picture, which can lead to the collapse of the entire test:
All due to the fact that when the hot_standby_feedback the VACUUM does not want to remove the "dead" tuples, if the standby server behind in their transaction id, to prevent replication conflicts. Detailed article What hot_standby_feedback in PostgreSQL really does :
xl1_game=# VACUUM VERBOSE core_inventory_player_resource;
INFO: vacuuming "public.core_inventory_player_resource"
INFO: scanned index "core_inventory_player_resource_pkey" to remove 62869 row versions
DETAIL: CPU: user: 1.37 s, system: 0.58 s, elapsed: 4.20 s
………...
INFO: "core_inventory_player_resource": found 13682 removable, 7257082 nonremovable row versions in 71842 out of 650753 pages
DETAIL: 3427824 dead row versions cannot be removed yet, oldest xmin: 3810193429
There were 1920498 unused item pointers.
Skipped 8 pages due to buffer pins, 520953 frozen pages.
0 pages are entirely empty.
CPU: user: 4.55 s, system: 1.46 s, elapsed: 11.74 s.
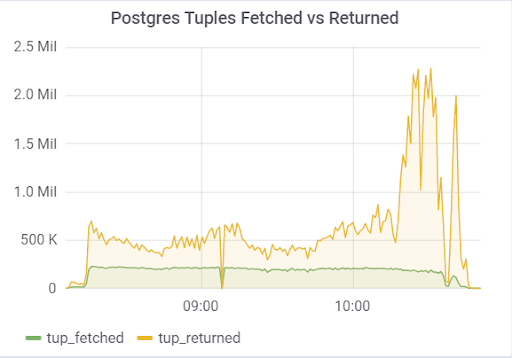
Such a large number of dead tuples leads to the picture shown above. Here are two tests, with hot_standby_feedback turned on and off:
And this is our replication lag during the test, with which you will need to do something in the future:
Conclusion
This test, fortunately (or unfortunately for the content of the article) showed that at this stage of the prototype of the game it is quite possible to absorb the desired load on the part of users, which is enough to give green light for further prototyping and development. In the subsequent stages of development, it is necessary to follow the basic rules (to keep simplicity of the executed queries, to prevent an overabundance of indexes, as well as non-indexed readings, etc.) and most importantly, test the project at each significant stage of development to find and fix problems as can be earlier. Perhaps soon, I will write an article as we have already solved specific problems.
Good luck everyone!
Our GitHub just in case;)