A brief history of one “smart tape”

Social networks are one of the most popular Internet products today and one of the main data sources for analysis. Inside the social networks themselves, the most difficult and interesting task in the field of data science is considered to be the formation of a news feed. Indeed, in order to satisfy the increasing demands of the user for the quality and relevance of the content, it is necessary to learn how to collect information from many sources, calculate the forecast of the user’s reaction and balance between dozens of competing metrics in the A / B test. And large amounts of data, high workloads and stringent requirements for response speed make the task even more interesting.
It would seem that today the tasks of ranking have already been studied along and across, but if you look closely, it is not so simple. The content in the feed is very heterogeneous - this is a photo of friends, and memos, viral videos, long reads and scientific pop. In order to put everything together, you need knowledge from various fields: computer vision, working with texts, recommendation systems, and, without fail, modern highly loaded storage and data processing tools. Finding one person with all the skills is extremely difficult today, so sorting the tape is really a team task.
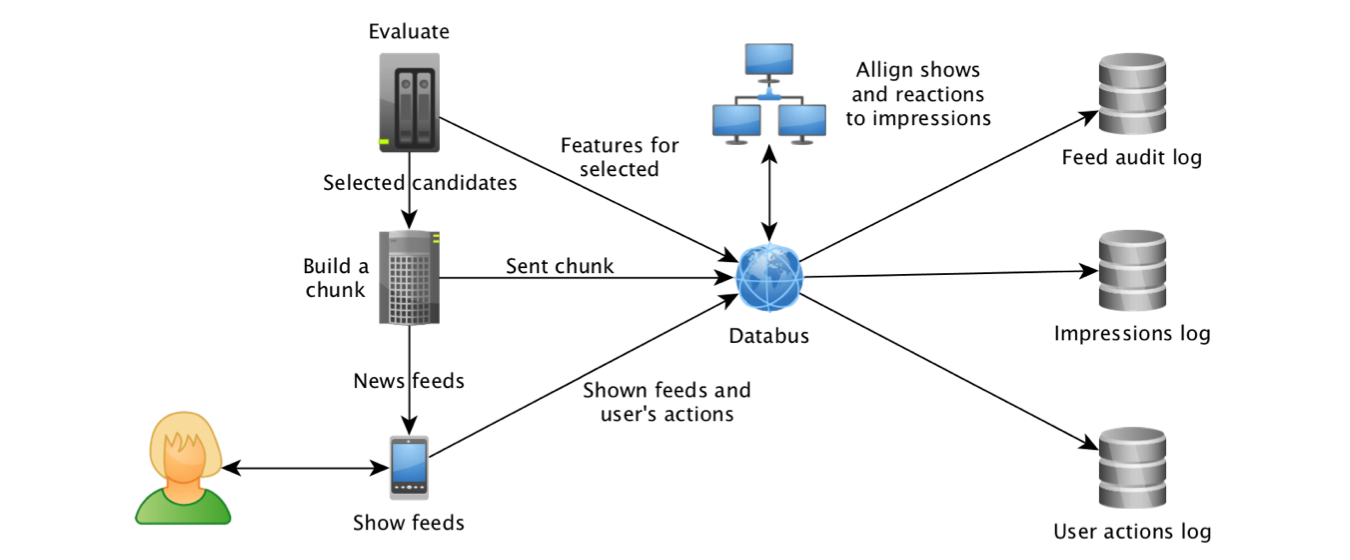
With different ribbon ranking algorithms in OdnoklassnikiThey started experimenting back in 2012, and in 2014, machine learning also joined this process. This was made possible, first of all, thanks to the progress in the field of technologies for working with data streams. Just starting to collect object displays and their attributes in Kafka and aggregating logs using Samza , we were able to build a dataset for training models and calculate the most “pulling” features: Click Through Rate objects and forecasts of the recommendation system "based on" the work of colleagues from LinkedIn .
It quickly became clear that the workhorse of logistic regression cannot take out the tape alone, because the user can have a very diverse reaction: class, comment, click, hiding, etc., and the content can be very different - photo a friend, a group post, or a vidosik inscribed by a friend. Each reaction for each type of content has its own specificity and its own business value. As a result, we came to the concept of a “ matrix of logistic regressions ”: a separate model is built for each type of content and each reaction, and then their forecasts are multiplied by a weight matrix formed by hands based on current business priorities.
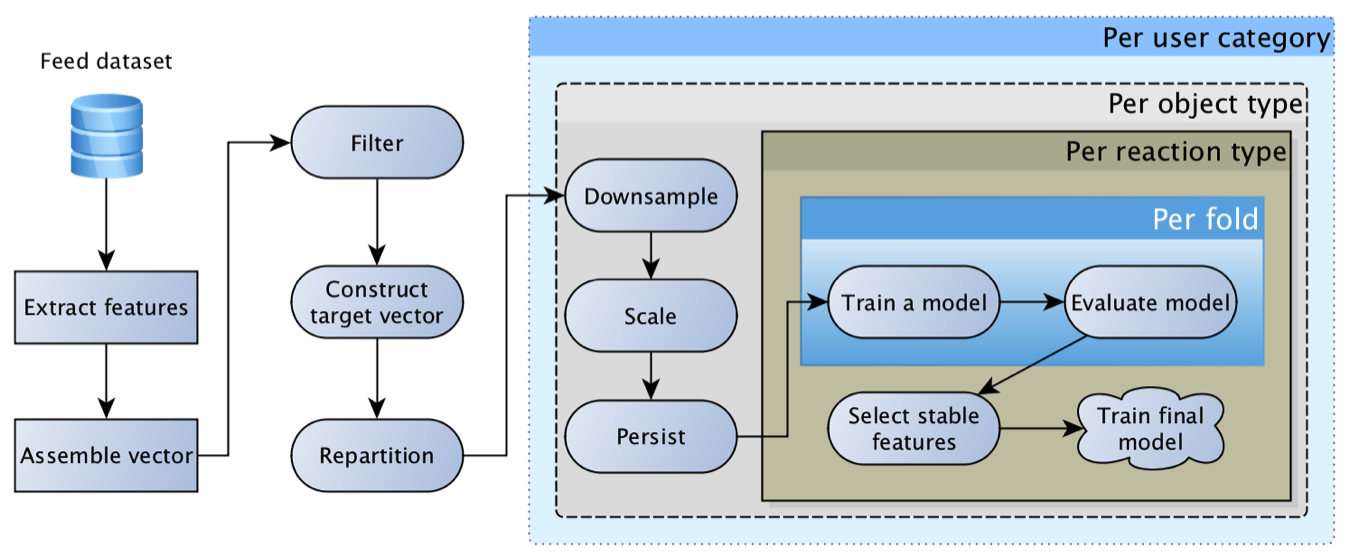
This model was extremely viable and for a long time was the main one. Over time, it acquired more and more interesting features: for objects, for users, for authors, for the user's relationship with the author, for those who interacted with the object, etc. As a result, the first attempts to replace the regression with a neural network ended in a sad "features we have are too crap, the mesh does not give a boost."
In this case, often the most tangible boost from the point of view of user activity was provided by technical rather than algorithmic improvements: scoop up more candidates for ranking, more accurately track the facts of the show, optimize the response speed of the algorithm, and deepen the browsing history. Such improvements often yielded units, and sometimes even tens of percent increase in activity, while updating the model and adding a feature often gave tenths of a percent increase.

A separate difficulty in the experiments with updating the model was creating a rebalance of content - the distribution of forecasts of the “new” model often could significantly differ from its predecessor, which led to a redistribution of traffic and feedback. As a result, it is difficult to assess the quality of the new model, since first you need to calibrate the balance of the content (repeat the process of setting the matrix weights for business purposes). Having studied the experience of colleagues from Facebook , we realized that the model needs to be calibrated , and isotonic regression was added on top of the logistic regression :).
Often in the process of preparing new content attributes, we experienced frustration - a simple model using basic collaborative techniques can give 80%, or even 90% of the result, while a fashionable neural network, trained for a week on super-expensive GPUs, perfectly detects cats and cars, but gives an increase metrics only in the third digit. A similar effect can often be seen when implementing thematic models, fastText, and other embeddings. We managed to overcome the frustration by looking at validation from the right angle: the performance of collaborative algorithms improves significantly as information about the object accumulates, while for “fresh” objects the content attributes give a tangible boost.
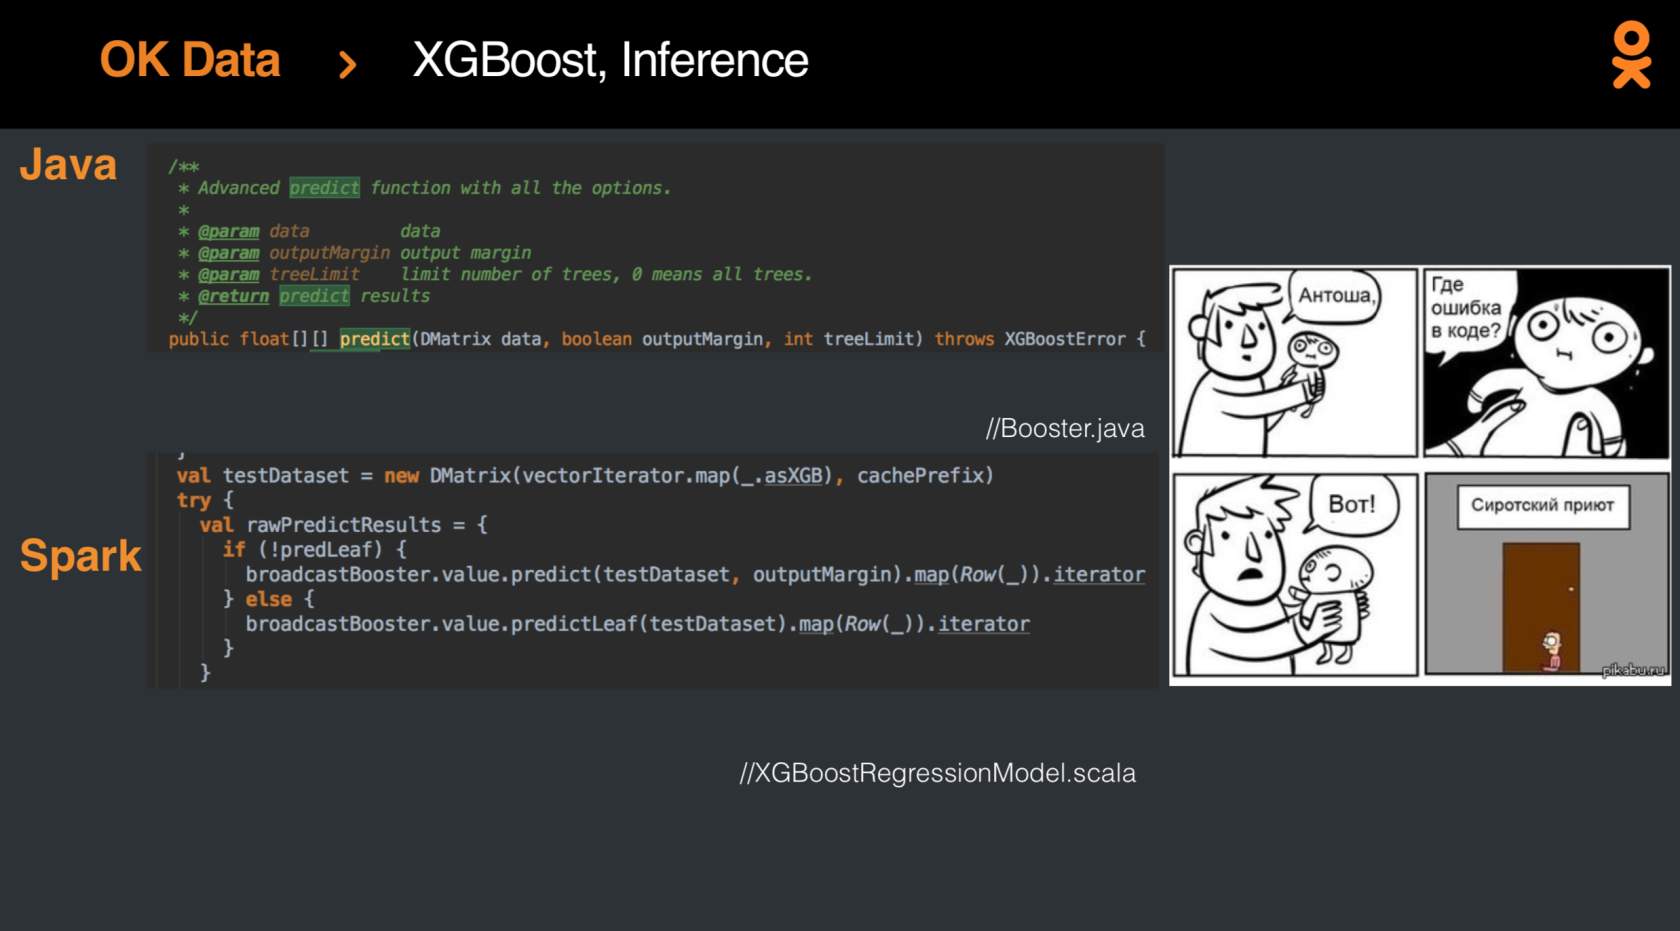
But, of course, someday the results of the logistic regression were to be improved, and progress was achieved by applying the recently released XGBoost-Spark . Integration was not easy , but in the end, the model finally became fashionable and youth, and the metrics grew by percent.
Surely, you can extract much more knowledge from the data and bring the ranking of the tape to a new height - and today everyone has the opportunity to try their hand at this non-trivial task at the SNA Hackathon 2019 competition. The competition takes place in two stages: from February 7 to March 15, download the solution to one of three tasks. After March 15, intermediate results will be summed up, and 15 people from the leaderboard top for each task will receive invitations to the second stage, which will be held from March 30 to April 1 in the Moscow office of Mail.ru Group. In addition, the invitation to the second stage will receive three people who are in the lead of the rating at the end of February 23.
Why are there three tasks? As part of the online phase, we offer three sets of data, each of which presents only one of the aspects: image, text, or information about a variety of collaborative attributes. And only at the second stage, when experts in different fields come together, will the general dataset be revealed, allowing you to find points for the synergy of different methods.
Interested in a task? Join SNA Hackathon :)