Key Application Metrics - Mobile Landmarks 2018 Report
At the end of February, Adjust released the Mobile Landmarks 2018 report. It covers important metrics and key performance indicators for applications. The basis of the report is data from 11,000 applications, 10.7 billion installations and 1.29 trillion events that occurred from January 1 to December 31, 2017. They are the ones who set the guidelines for how the application economy will work in 2018.
User return is one of the fundamental metrics that determines how much users liked the application after downloading. The base of loyal users is built on the returns to the application, they include your ability to increase the income of the application and increase LTV.
Refunds show how many percent of users return to the application on a specific day after installation. A higher return rate means that the application is more successful: more active and loyal users, more opportunities for monetization.
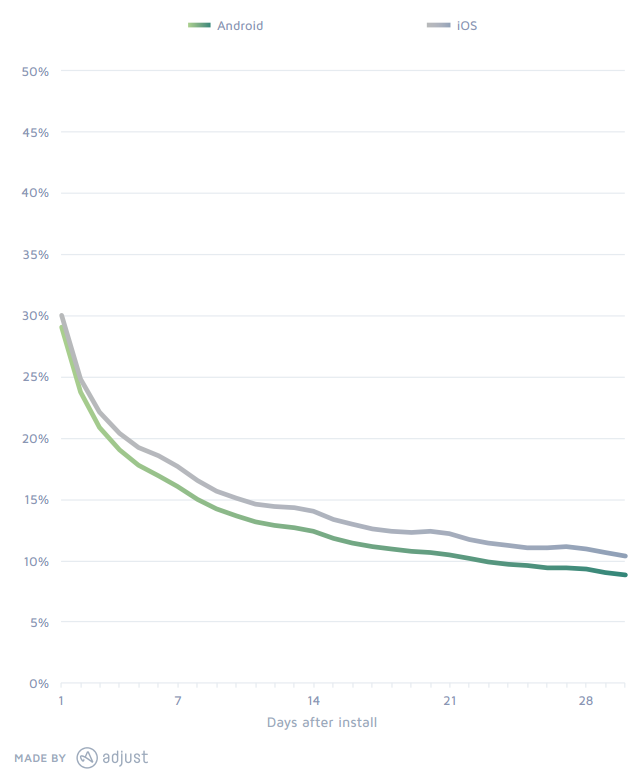
Here's what the average returns in applications across platforms look like: iOS and Android start at Day 1 at about the same level of 30%, by Day 7 they diverge by 2 percentage points (18% and 16% respectively) and continue to maintain this gap up to Day 30, when average returns fluctuate around 10%:
Now let's look at the statistics of returns in different markets. According to statistics, the most “responsible” users in Japan - their presence in applications on the 30th day is about 3% more than in the USA or in Russia. Another situation with the situation in China, here users return the least - on the 30th day you can see only about 3% of the people who originally installed the application:
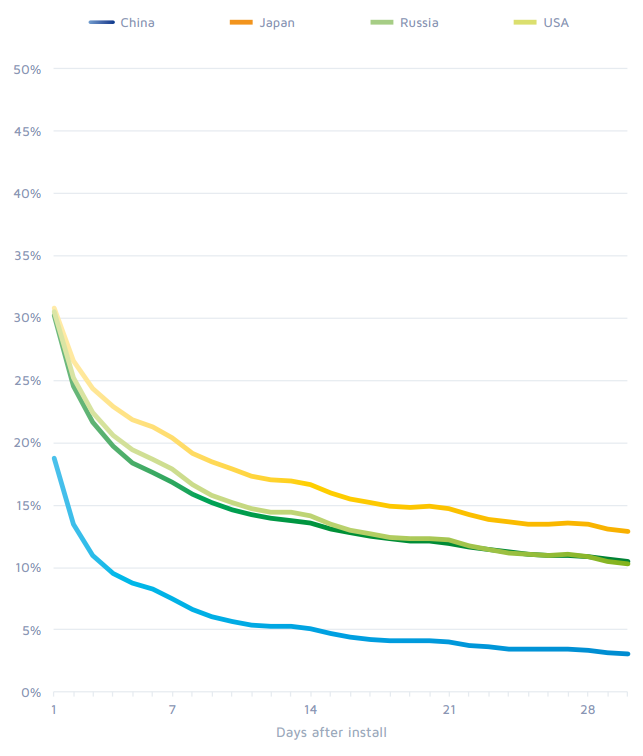
This can be explained by a large selection of applications in China, and the dominance of large platforms, such as WeChat.
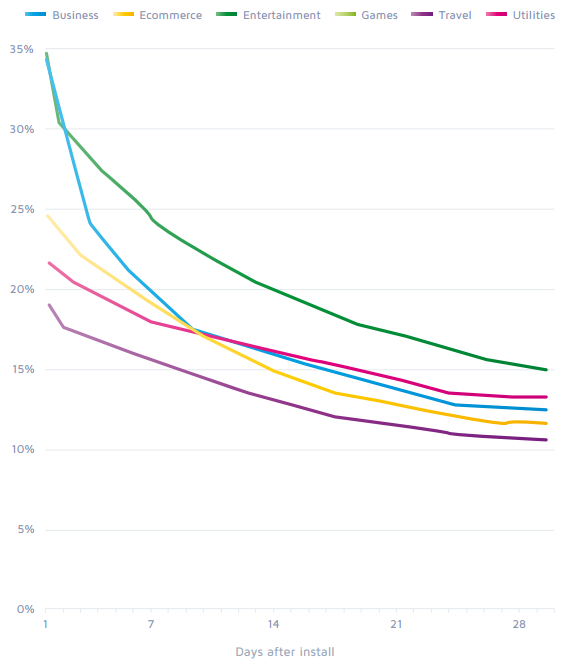
Let us analyze how users return to applications in different categories. Everything here also differs markedly, both on the first day and at the end of the month. Entertainment applications are more sticky with 35% on Day 1 and 15% on Day 30. It is logical enough that fewer people return to travel applications - less than 20% on Day and about 11% on Day 30:
These were “average market returns” . Top applications work much better - you can find information about their performance in the Adjust report.
Where to get the “right” users is the second most important question for the mobile developer and marketer.
This can be determined, for example, by the average number of sessions for users coming from a particular source. So, the users who generate the most sessions are the Google ad network, followed by Twitter and third Facebook:
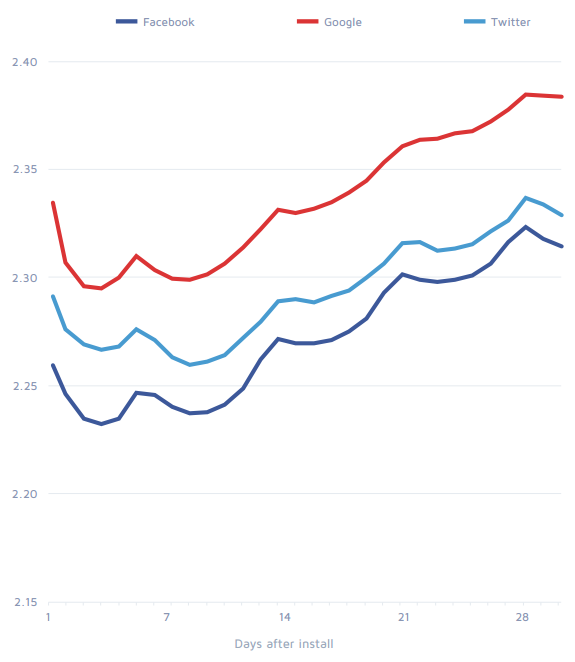
Each company defines a session in its own way. In this case, Adjust defines a session as a set of regular user actions within the application, separated by at least 30 minutes.
The metric of “average number of sessions per user” is often used along with returns to see how much users are interested in the application, as well as to understand what they really do in the product.
User sessions are not necessarily a key metric — it depends a lot on the structure of your application. For example, for a complex game with long sessions, multiple user visits every day are not necessary at all, especially if they have already been converted into paying players. However, for most applications, many sessions mean more interest.
Like any cohort indicator, it is useful to analyze sessions on specific days. As a rule, the number of sessions decreases over time, but it is interesting to consider this indicator in conjunction with others. Low returns, but many sessions? Your application is niche, but if you find your audience, then it will be very passionate for them. High returns, but few sessions? Most likely, users find your application useful, but only once or twice a day in the situation they need.
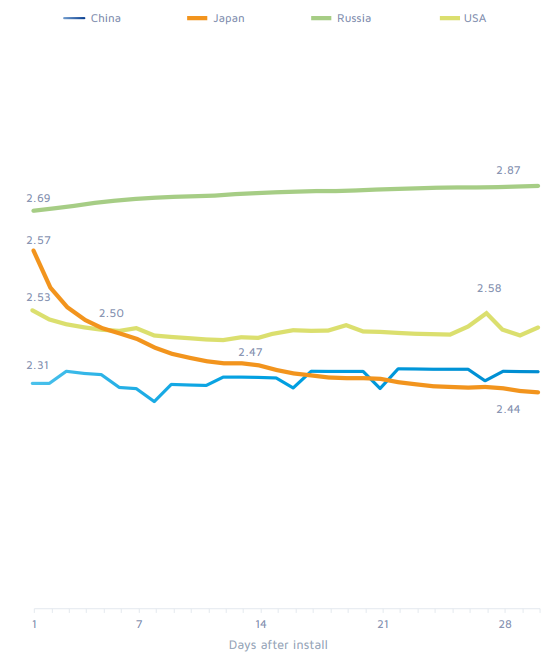
If you look at the number of sessions by country, then Russia is the leader - in our country the number of sessions over time is not only not falling, but constantly growing. Look at Japan - here is just the situation described above - good returns, but falling sessions, the audience is looking for useful applications:
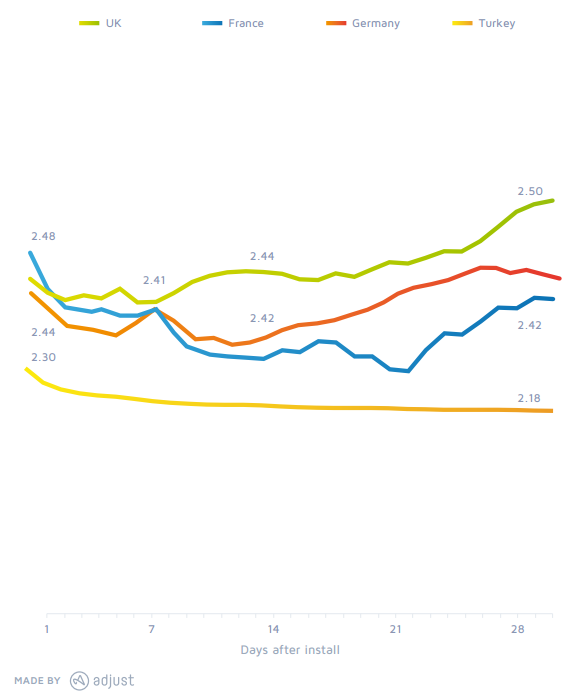
In the Eurozone, the leaders of the United Kingdom are:
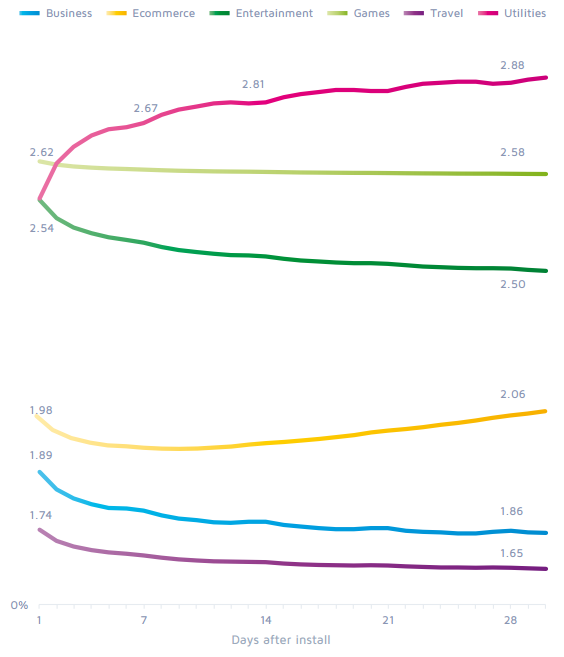
If you look at applications vertically, then the leaders of the Utility are obviously the most useful applications used every day. It is not difficult to assume that Travel will be at the bottom of the schedule - applications that are used literally several times a month:
Mobile advertising fraud has long been considered an easy task , because often a single campaign receives hundreds of thousands of clicks and a relatively small number of installations, which provides an ideal cover for potential scammers.
Until recently, the absence of sectoral measures to combat fraud meant that the offender would most likely not be caught, and therefore could act with a greater degree of impunity. How recent? Adjust was the first attribution provider to offer timely fraud protection.
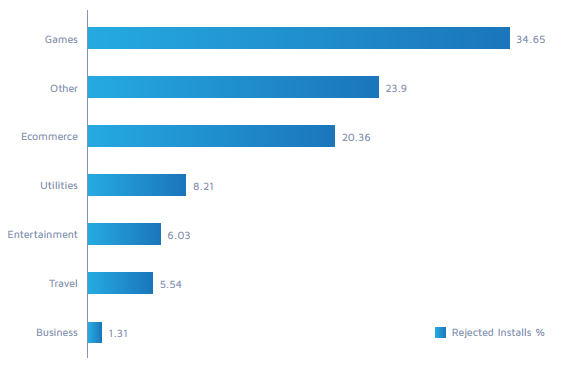
And the company now shares how many fraud there are in different categories - for example, more than a third of game installations are fraudulent:
Android applications are the most susceptible to fraud - in 2017, Adjust prevented twice as many cheating attempts on this platform than on iOS.
Returns and sessions are good, but the real goal of any marketer is to take actions that aim to pay, convert a user from free to paying.
Country events are in the lead of the United States, and China and we are closing the four:
Vertical events - eCommerce has few returns, but for events this category is obvious in the undisputed leaders. Games are many times behind, but if the number of events at stores decreases over time, then in games it is growing steadily.
In the report you can also find data for each month on returns in different categories and countries, the number of sessions and events by country.
You can download the entire report here .
User Retention
User return is one of the fundamental metrics that determines how much users liked the application after downloading. The base of loyal users is built on the returns to the application, they include your ability to increase the income of the application and increase LTV.
Refunds show how many percent of users return to the application on a specific day after installation. A higher return rate means that the application is more successful: more active and loyal users, more opportunities for monetization.
Here's what the average returns in applications across platforms look like: iOS and Android start at Day 1 at about the same level of 30%, by Day 7 they diverge by 2 percentage points (18% and 16% respectively) and continue to maintain this gap up to Day 30, when average returns fluctuate around 10%:
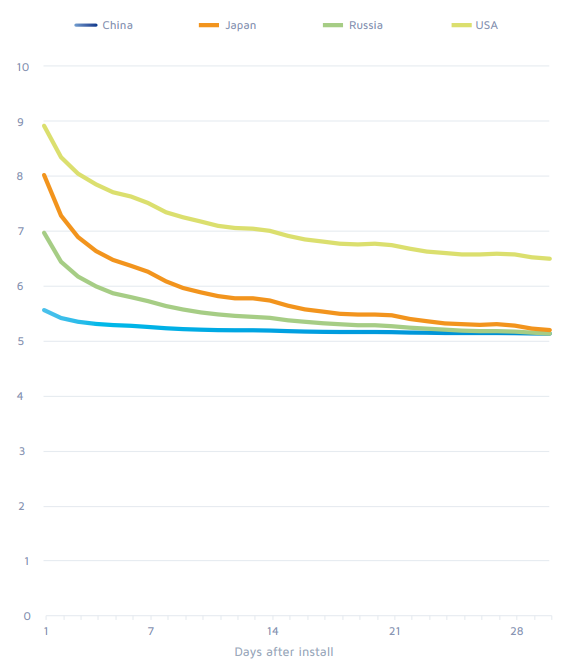
Now let's look at the statistics of returns in different markets. According to statistics, the most “responsible” users in Japan - their presence in applications on the 30th day is about 3% more than in the USA or in Russia. Another situation with the situation in China, here users return the least - on the 30th day you can see only about 3% of the people who originally installed the application:
This can be explained by a large selection of applications in China, and the dominance of large platforms, such as WeChat.
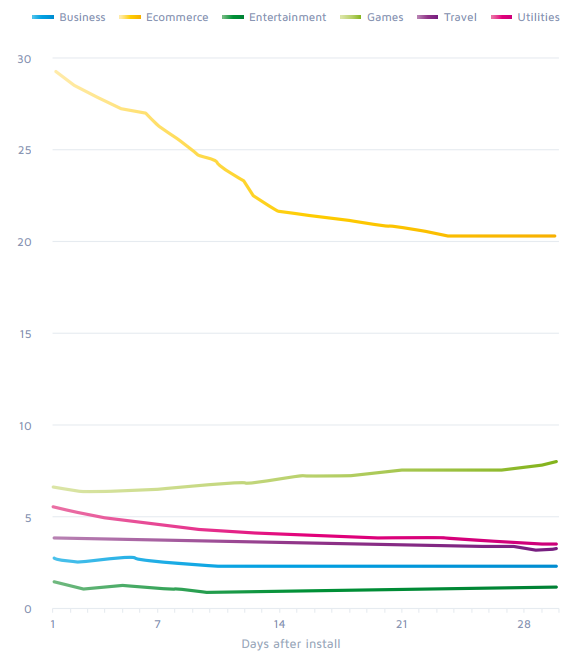
Let us analyze how users return to applications in different categories. Everything here also differs markedly, both on the first day and at the end of the month. Entertainment applications are more sticky with 35% on Day 1 and 15% on Day 30. It is logical enough that fewer people return to travel applications - less than 20% on Day and about 11% on Day 30:
These were “average market returns” . Top applications work much better - you can find information about their performance in the Adjust report.
User Sources
Where to get the “right” users is the second most important question for the mobile developer and marketer.
This can be determined, for example, by the average number of sessions for users coming from a particular source. So, the users who generate the most sessions are the Google ad network, followed by Twitter and third Facebook:
Sessions
Each company defines a session in its own way. In this case, Adjust defines a session as a set of regular user actions within the application, separated by at least 30 minutes.
The metric of “average number of sessions per user” is often used along with returns to see how much users are interested in the application, as well as to understand what they really do in the product.
User sessions are not necessarily a key metric — it depends a lot on the structure of your application. For example, for a complex game with long sessions, multiple user visits every day are not necessary at all, especially if they have already been converted into paying players. However, for most applications, many sessions mean more interest.
Like any cohort indicator, it is useful to analyze sessions on specific days. As a rule, the number of sessions decreases over time, but it is interesting to consider this indicator in conjunction with others. Low returns, but many sessions? Your application is niche, but if you find your audience, then it will be very passionate for them. High returns, but few sessions? Most likely, users find your application useful, but only once or twice a day in the situation they need.
If you look at the number of sessions by country, then Russia is the leader - in our country the number of sessions over time is not only not falling, but constantly growing. Look at Japan - here is just the situation described above - good returns, but falling sessions, the audience is looking for useful applications:
In the Eurozone, the leaders of the United Kingdom are:
If you look at applications vertically, then the leaders of the Utility are obviously the most useful applications used every day. It is not difficult to assume that Travel will be at the bottom of the schedule - applications that are used literally several times a month:
Fraud
Mobile advertising fraud has long been considered an easy task , because often a single campaign receives hundreds of thousands of clicks and a relatively small number of installations, which provides an ideal cover for potential scammers.
Until recently, the absence of sectoral measures to combat fraud meant that the offender would most likely not be caught, and therefore could act with a greater degree of impunity. How recent? Adjust was the first attribution provider to offer timely fraud protection.
And the company now shares how many fraud there are in different categories - for example, more than a third of game installations are fraudulent:
Android applications are the most susceptible to fraud - in 2017, Adjust prevented twice as many cheating attempts on this platform than on iOS.
Events and Conversion
Returns and sessions are good, but the real goal of any marketer is to take actions that aim to pay, convert a user from free to paying.
Country events are in the lead of the United States, and China and we are closing the four:
Vertical events - eCommerce has few returns, but for events this category is obvious in the undisputed leaders. Games are many times behind, but if the number of events at stores decreases over time, then in games it is growing steadily.
In the report you can also find data for each month on returns in different categories and countries, the number of sessions and events by country.
You can download the entire report here .