It’s hard about the simple: how to measure the time it takes to open a page and not make enemies
You are a developer and want to see that your page has opened faster after all optimizations. Or you need to prove to your superiors that you are not a camel and have really accelerated everything. Or maybe you want to make sure that your users will not suffer from slowly opening pages. Or, as in our case, you are a tester who is now responsible for swearing client productivity, and missed production brakes do not let you sleep at night.
Measuring client performance is not a trivial task. Especially if you have hundreds of pages in a lot of stands in your project. Each is filled with js code, and hundreds of developers optimize, change, recreate them every day. It is necessary to design a system for collecting, processing and storing data. Which storage to choose? How to design a database, and in which DBMS? Many interesting tasks that fade before the laconic "how long did the page open?" For us, the search for the answer to this question resulted in a quest with detective investigations, heated debate and the search for truth. His most interesting points are in this article.
In the old days, before web 2.0, determining the end of page loading was relatively simple: a document arrived from the server ± several ms, and we believe that the page loaded. Then, the number of queries loading images, styles, and other resources increased. Finding the end of page loading became a little more difficult: now you had to wait for all resources to load, everyone began to be tied to various js events, for example window.onload. The Internet has evolved, pages have become heavy and previous approaches have stopped working. Now loading the page after receiving all the resources did not stop. There were requests that are executed directly from js, preloading and other mechanisms appeared that greatly blurred the very point that can be considered the end of the page loading. And now you can meet different options for determining the end of the page load. Let us briefly go through each of them.
Network activity.From the definition itself (the end of the page loading) we see that we need to wait for the moment when the page has stopped fulfilling requests, i.e. we have no requests in the "pending" state, and for some time new requests have not been executed. It’s not difficult to determine this, and the wording is clear. But that's just not working for most sites. After loading a document, it can take a lot of time to initialize js, which will increase the page construction time. And that notorious “page loaded” will take place for the user much later than the end of the download. Also, an unpleasant surprise may be preloading, which is triggered after the page loads and can last several seconds. In addition, it is not uncommon for various mechanisms on the page to exchange information with the server without interruption.
Events. Now it’s right to say not “page loaded”, but “page built”. Since the already mentioned window.onload, new events have been added to which you can bind not only the triggering of the js code, but also the full opening of our page. As a logical continuation, in 2012, work begins on the standard . Here a whole series of events related to the process of loading the page is displayed. But in practice, it turns out that these events are triggered before the full page construction occurs. This is seen in synthetic tests., and with a knee test. Yes, in theory, you can create some kind of artificial event that would show that the page has finally loaded. But then we would need to do this for all pages separately. Plus, with any changes, double-check the correctness of the new approach. This all again leads to the original task - how to understand that the page has loaded.
Visual changes. Client performance, one way or another, revolves around the user. Those. what matters to us is how a person feelswhen working with our product. And here you can, without thinking, rush forward, put a living person and instruct him to determine “by eye” the page load time. The idea is doomed to failure, because a person can determine whether the page is slow or not slow, but it’s unlikely to say how much it slows down on a 10-point scale. However, here we understand that visual changes are perhaps one of the best indicators that a page has loaded. We can constantly monitor the page display and, as soon as we have stopped the visual changes, assume that the page has loaded. But are all page changes equally important?
This is the first time we have a page drawn, here a frame appeared, text appeared, pictures were loaded, counters, social buttons, comments, etc. began to be loaded. In different situations, the different steps involved in loading a page are important. Somewhere, the first rendering is important, but for someone it is important to know when the user saw the comments. But, as a rule, in most cases it is important for us to download the main content. It is the visual appearance of the main content that is considered to be the “page loaded”. Therefore, ceteris paribus, we can build on this event, evaluating the page loading speed. In order to work with the page comprehensively, there is a wonderful approach called “speed index”, which is described here .
The idea is this: we are trying to understand how evenly the page loaded. Two versions of one page could open in 2 seconds, but in the first 90% of visual changes occurred a second after opening, and the second after 1.7 seconds. With an equal opening time to the user, the first page will seem much faster than the second.
Operability. So, we now understand exactly what a “page has opened”. Can we stop there? But no. The page has loaded, we click on the button for adding a new comment and ... the pants do not turn into anything - the page ignores our clicks. What to do? Add another metric. We need to select the target element. And then find out when it will become available for interaction. As will be described later, this is the most difficult task.
It seems they figured out what to consider the end of the page loading. And what about the beginning of the opening? Here, everything seems to be clear - we think from the moment we gave the browser a command to open the page, but again the damn details. There are events like beforeunload. The code that fires when they occur can significantly affect the time the page opens. Of course, we can always switch to about: blank in advance, but in this case we can skip this problem. And with the excellent performance of our tests, users will complain about the brakes. Again, choose based on your specifics. For comparative measurements, we always start with a blank page. And we catch problems with transitions from page to page as part of measuring the working time of critical business scenarios.
Is it important to measure one to one as customers? Maybe. But will there be immediate benefits to development and acceleration? Not a fact. Here is an excellent article that says that it’s important to simply select at least one metric and build on it to estimate the time it takes to open pages. It will be much easier to work with one selected indicator, track optimizations, and build trends. And only then, if there are resources for that, supplement with auxiliary metrics.

Great, now everyone in the company speaks the same language. Developers, testers, managers by page opening time mean the time of displaying the main content on the page. We even created a tool that accurately performs these measurements. We have fairly stable results, the measure of scatter is minimal. We publish our first report and ... get a lot of dissatisfied comments. The most popular of them is “but I tried it here, and everything is different with me!” Even if we assume that the measurement methodology was followed and the same tool was used, it turns out that everyone has completely different results. We start digging and find out that someone took measurements via Wi-Fi, someone had a computer with 32 cores, and someone opened the site from the phone. It turns out that the problem of measurements is no longer multifaceted, but multidimensional.
The question arose: what factors affect the time a page opens? In haste, such an associative map was drawn up .
Something about 60-70 different factors turned out. And a series of experiments began, which sometimes presented us with very interesting results.
Cache or not cache - that’s the question.The first anomaly we encountered was discovered in the very first reports. We took measurements with an empty cache and with a full one. Part of the pages with full cache was delivered no faster than with empty. And some pages take longer. At the same time, the volume of traffic at the first opening was measured in megabytes, and at the second it was less than 100 KB. We open DevTools (by the way, DevTools itself can have a strong influence on measurements, but for comparative research this is what you need), start the data collection and open the page. And we get this picture:
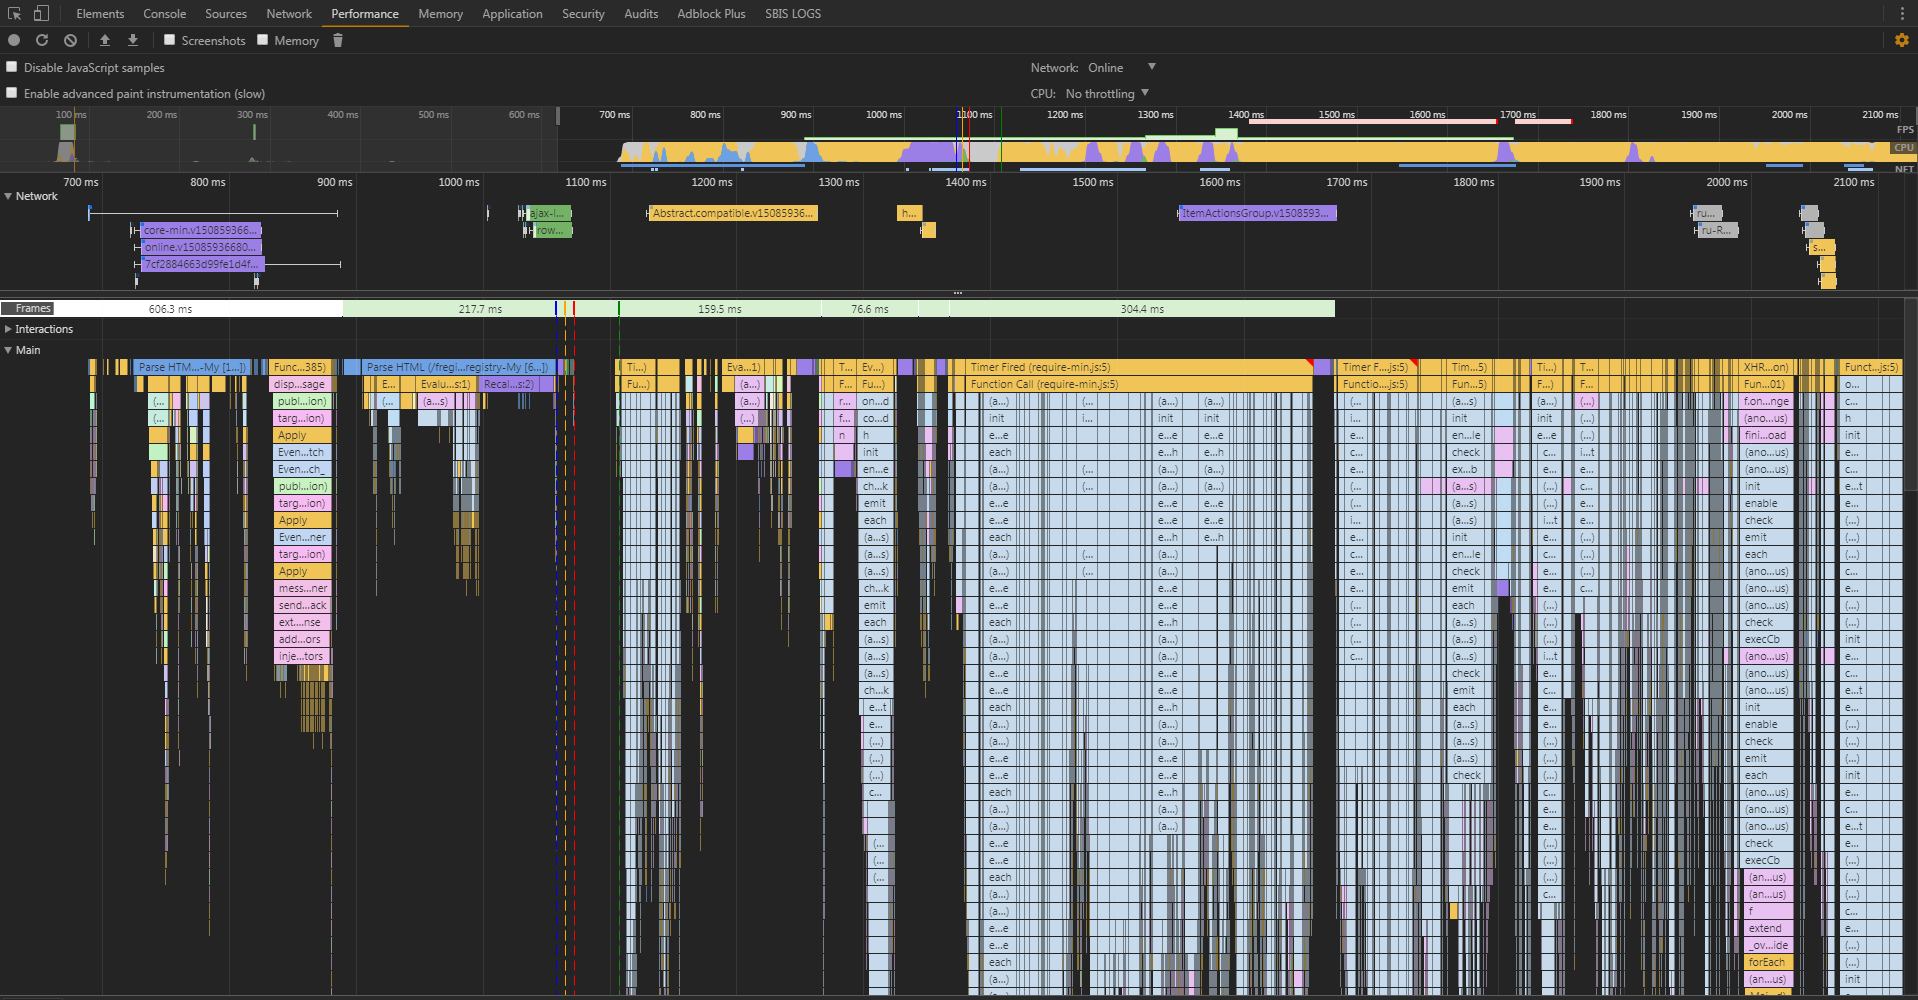
It is clearly seen here that most of the time the browser was parsing / initializing js files. Those. we have so much js code, and the browser uses the time it takes to receive files over the network so optimally that for the most part we depend on the speed of initialization of js modules than on the speed of receiving them. Network traffic is very important, but in view of the ideal connection (we measure it from the inside of the network), we get exactly this picture. This problem has already been highlighted, for example, by Eddie Osmani .
So, OK, with pages that in our report practically did not accelerate with filling the cache, everything is clear. And why did some of the pages begin to open even longer? Then I had to carefully look at the Network tab, on which the problem was discovered. Trying to reduce the number of requests, we combined almost all js modules with extra dependencies into one large file. And on one page, this file began to weigh as much as 3 MB. The disk was not an SSD, but a channel with zero ping. In addition, Chrome very curiously works with the disk cache, sometimes creating brakes out of the blue. Therefore, the file took longer from the cache than it flew over the network. Which, ultimately, led to an increase in total time.
Yes, page size is critical and needs to be reduced. But now, data structure optimization is no less important. What is the use of reducing the size of a small file by 10% through the new compression algorithm if the user spends the extra 50 ms to decompress? And if you look at the statistics from the site httparchive.org, we will see that a similar situation can only get worse: the
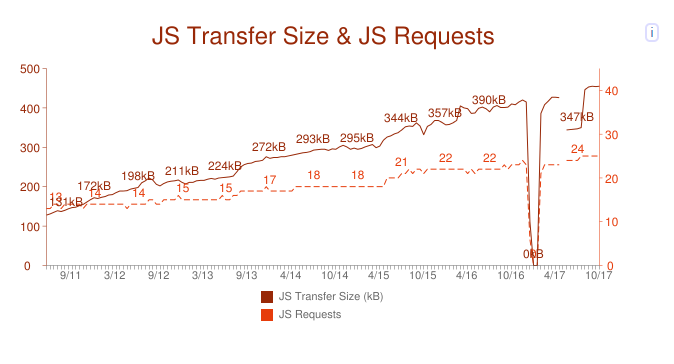
lower scale is the months and years, the left scale is the average js volume per page, and the right scale is the number of requests per page in average.
About network conditions.Although it was said above that we measure mainly on the ideal channel, sometimes it becomes necessary to study what the user experiences when they open our pages via Wi-Fi or 3G. Or maybe there’s a dial-up somewhere, and you want to understand whether, in principle, your page will open with Baba Frosi from the village of Kukuevo. And here we, of course, can put one of the nodes for measurements in the same village or emulate a bad channel. The latter draws on a separate article or even an entire book, so we restrict ourselves to a stack of tools that are successfully used with us.
Firstly, these are various http proxies: BrowserMobProxy (in light mode), Fiddler, mitm, etc. Of course, they do not emulate a bad channel, but simply create delays every n KB. But as practice shows, for applications working on http in general, this is enough. When we really want to emulate, netem and clumsy come to the rescue .
With such testing, it is desirable to understand how the network affects the performance of web applications. If this is not so important for obtaining results, then for their interpretation it’s worth really understanding this, so as not to show “it slows down” in the bug report. One of the best books on this subject is “High Performance Browser Networking” by Ilya Grigorik .
BrowsersUndoubtedly, the browsers themselves play a very important role in the opening time of a page. And now we are not even talking about those benchmark tests that every browser maker designs for themselves in order to show that their horse is the fastest on the planet. Now we are talking about various features of the engines or the browsers themselves, which ultimately affect the time the page opens. So, for example, Chrome initializes large js files as it is received in a separate stream. But what the authors mean by “large files” is not specified anywhere. But if you look at the source of Chromium , it turns out that we are talking about 30 KB.
And so it turns out that sometimes, by slightly increasing the js module, we can speed up the page loading time. True, it’s not so finite that now it’s just that way to increase all js modules in a row.
This is a small detail. And if you look more broadly, then we have various browser settings, open tabs, various plugins, different state of storage and cache. And all this, one way or another, participates in the browser and can affect how quickly this or that page opens for a particular user.
We found that there are many factors that have a significant or small impact on our measurements. What to do about it? Iterate over all combinations? Then we get a combinatorial explosion and do not have time to really measure even one page per release. The right decision is to choose one configuration for the main continuous measurements, as reproducibility of test results is of utmost importance.
As for the rest of the situations, then we decided to conduct separate individual experiments. In addition, all our assumptions about users may not be true, and it is advisable to learn how to collect indicators directly ( RUM ).
There are a lot of tools devoted to measurements and web performance in general (gmetrix, pingdom, webpagetest, etc.). If we arm ourselves with Google and try a dozen of them, we can draw the following conclusions:
Next, the most practical.
WebPageTest Of all the variety of tools, WebPageTest stands out positively . This is a hefty multi-harvester, constantly evolving and delivering excellent results.
One of the main advantages of this tool:
About the last plus it is worth saying separately. Here, perhaps, almost all the methods are really collected. The most interesting are Speed Index and First Interactive. About the first mentioned before. And the second tells us how long after the appearance of the page will begin to respond to our actions. And suddenly the insidious developer began to generate pictures on the server and send them to us (I hope not).
If you deploy such a solution locally, then you will cover almost all of your performance testing needs. But, alas, not all. If you still want to get the exact time of the appearance of the main content, add the ability to execute entire scripts using convenient frameworks, you have to make your own tool. What we at one time did.
SeleniumMore out of habit than consciously, Selenium was chosen for the first pancake. Without taking into account small details, the whole essence of the solution looked like this: We
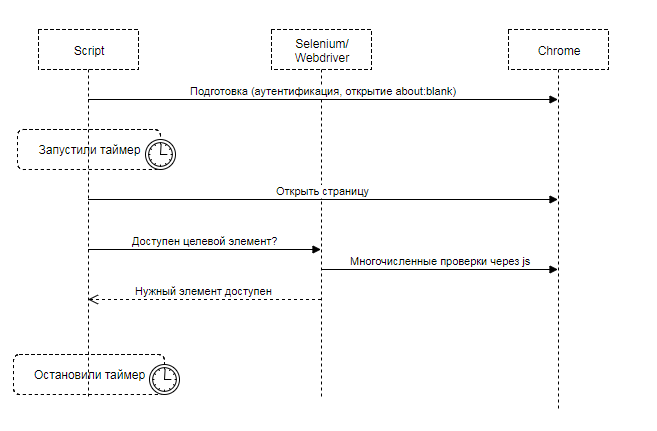
translate the browser into the desired state, open the page, and begin to wait for Selenium to consider the target element accessible and visible to the user. The target element is what the user expects to see: message text, article text, picture, etc.
All these measurements were carried out 10 times, and averaged results were calculated (eg median, arithmetic mean, ...). In general, from time to time a more or less stable result was obtained. It seems to be happiness, but our long-suffering forehead is again faced with a universal rake. It turned out that although it was stable with one invariable page, it started to jump unreasonably when changing this page. The video helped us figure this out. We compared two versions of the same page. By video recording, the pages opened almost simultaneously (± 100 ms). And measurements through Selenium persistently told us that the page began to open one and a half seconds longer. And stably longer.
The investigation led to the implementation of is_displayed in Selenium. The calculation of this property consisted of checking several js properties of the element, for example, that it is in the DOM tree, that it is visible, has a non-zero size, and so on. Moreover, all these checks are also carried out recursively for all parent elements. Not only can we have a very large DOM tree, but the checks themselves, being implemented on js, can take a very long time at the moment of opening the page due to the initialization processes of js modules and execution of other js code.
As a result, we decided to replace Selenium with something else. At first it was WebPageTest, but after a series of experiments we implemented our simple and working solution.

Since we mainly wanted to measure the time of the visual appearance of the main content on the page, we also chose measurements for the tool by taking screenshots at a frequency of 60 fps. The measurement mechanism itself is as follows:
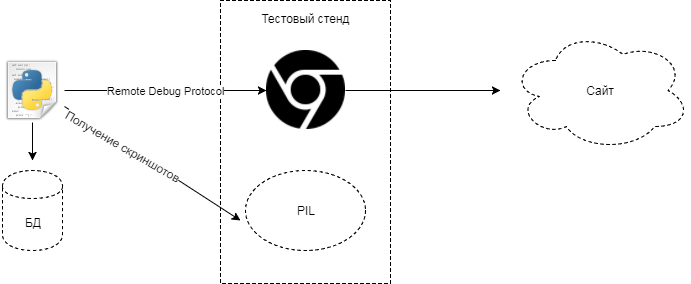
Through the debug mode, we connect to the Chrome browser, add the necessary cookies, check the environment and start taking screenshots via PIL in parallel on the same machine . We open the page we need in the test application (UAT). Then we wait for the termination of significant network and visual activity lasting 10 seconds. After that, we save the results and artifacts: screenshots, HAR files, Navigation Timing API and more.
As a result, we get several hundred screenshots and process them.
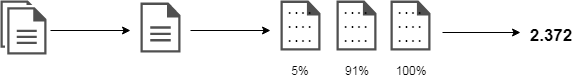
Usually, after removing all duplicates from hundreds of screenshots, no more than 8 pieces remain. Now we need to calculate some diff between neighboring screenshots. The diff in the simplest case is, for example, the number of changed pixels. For greater reliability, we do not consider the difference of all screenshots, but only some . After which, summing up all the diffs, we get the total number of changes (100%). Now we just have to find a screenshot, after which> 90% of page changes occurred. The time taken to get this screenshot will be the time the page opens.
Instead of connecting to Chrome via a debug protocol, Selenium can be used just as well. Because since version 63, Chrome supports multiple remote debugging, we still have access to the entire data set, and not just what Selenium gives us.
As soon as we had the first version of such a solution, we started a series of tedious, painstaking, but very necessary tests. Yes, tools for testing your products also need to be tested.
For testing, we used two main approaches:
We carry out tests regularly, as the tool itself changes, the tested applications change. When writing this article, I took one of the stable pages (the server part runs almost instantly) and conducted a series of 100 tests through 3 different approaches. Through the video I measured 10 times and calculated the median.
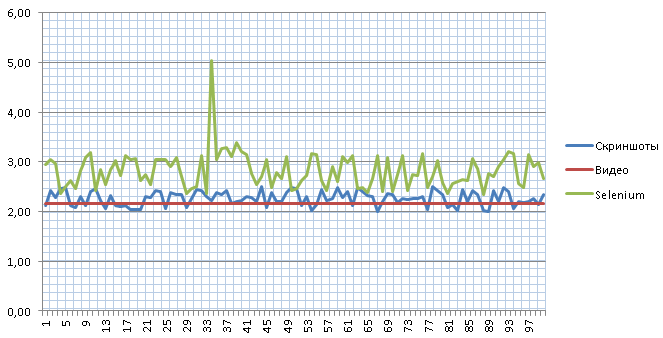
As we see, through the screenshots we get a result close to reality within 10 ms of the error. But through Selenium we have a rather strong spread with an incomprehensible emission of up to 5 seconds.
Yes, again about a spherical horse in a vacuum, this is not a universal method. Such an algorithm works with us, with our products, but it can easily not work for other sites. Moreover, as with many previous approaches, he is not devoid of the observer paradoxlike in quantum physics. We cannot see the result, guaranteed to not affect it. You can only reduce the degree of error.
At a minimum, PIL also utilizes some resources. But, nevertheless, such a solution has been successfully used in the company for the last year. It is regularly updated, but the basic idea remains unchanged.
Author Sergey Dokuchaev
Measuring client performance is not a trivial task. Especially if you have hundreds of pages in a lot of stands in your project. Each is filled with js code, and hundreds of developers optimize, change, recreate them every day. It is necessary to design a system for collecting, processing and storing data. Which storage to choose? How to design a database, and in which DBMS? Many interesting tasks that fade before the laconic "how long did the page open?" For us, the search for the answer to this question resulted in a quest with detective investigations, heated debate and the search for truth. His most interesting points are in this article.
What is the “page opened”?
In the old days, before web 2.0, determining the end of page loading was relatively simple: a document arrived from the server ± several ms, and we believe that the page loaded. Then, the number of queries loading images, styles, and other resources increased. Finding the end of page loading became a little more difficult: now you had to wait for all resources to load, everyone began to be tied to various js events, for example window.onload. The Internet has evolved, pages have become heavy and previous approaches have stopped working. Now loading the page after receiving all the resources did not stop. There were requests that are executed directly from js, preloading and other mechanisms appeared that greatly blurred the very point that can be considered the end of the page loading. And now you can meet different options for determining the end of the page load. Let us briefly go through each of them.
Network activity.From the definition itself (the end of the page loading) we see that we need to wait for the moment when the page has stopped fulfilling requests, i.e. we have no requests in the "pending" state, and for some time new requests have not been executed. It’s not difficult to determine this, and the wording is clear. But that's just not working for most sites. After loading a document, it can take a lot of time to initialize js, which will increase the page construction time. And that notorious “page loaded” will take place for the user much later than the end of the download. Also, an unpleasant surprise may be preloading, which is triggered after the page loads and can last several seconds. In addition, it is not uncommon for various mechanisms on the page to exchange information with the server without interruption.
Events. Now it’s right to say not “page loaded”, but “page built”. Since the already mentioned window.onload, new events have been added to which you can bind not only the triggering of the js code, but also the full opening of our page. As a logical continuation, in 2012, work begins on the standard . Here a whole series of events related to the process of loading the page is displayed. But in practice, it turns out that these events are triggered before the full page construction occurs. This is seen in synthetic tests., and with a knee test. Yes, in theory, you can create some kind of artificial event that would show that the page has finally loaded. But then we would need to do this for all pages separately. Plus, with any changes, double-check the correctness of the new approach. This all again leads to the original task - how to understand that the page has loaded.
Visual changes. Client performance, one way or another, revolves around the user. Those. what matters to us is how a person feelswhen working with our product. And here you can, without thinking, rush forward, put a living person and instruct him to determine “by eye” the page load time. The idea is doomed to failure, because a person can determine whether the page is slow or not slow, but it’s unlikely to say how much it slows down on a 10-point scale. However, here we understand that visual changes are perhaps one of the best indicators that a page has loaded. We can constantly monitor the page display and, as soon as we have stopped the visual changes, assume that the page has loaded. But are all page changes equally important?
This is the first time we have a page drawn, here a frame appeared, text appeared, pictures were loaded, counters, social buttons, comments, etc. began to be loaded. In different situations, the different steps involved in loading a page are important. Somewhere, the first rendering is important, but for someone it is important to know when the user saw the comments. But, as a rule, in most cases it is important for us to download the main content. It is the visual appearance of the main content that is considered to be the “page loaded”. Therefore, ceteris paribus, we can build on this event, evaluating the page loading speed. In order to work with the page comprehensively, there is a wonderful approach called “speed index”, which is described here .
The idea is this: we are trying to understand how evenly the page loaded. Two versions of one page could open in 2 seconds, but in the first 90% of visual changes occurred a second after opening, and the second after 1.7 seconds. With an equal opening time to the user, the first page will seem much faster than the second.
Operability. So, we now understand exactly what a “page has opened”. Can we stop there? But no. The page has loaded, we click on the button for adding a new comment and ... the pants do not turn into anything - the page ignores our clicks. What to do? Add another metric. We need to select the target element. And then find out when it will become available for interaction. As will be described later, this is the most difficult task.
It seems they figured out what to consider the end of the page loading. And what about the beginning of the opening? Here, everything seems to be clear - we think from the moment we gave the browser a command to open the page, but again the damn details. There are events like beforeunload. The code that fires when they occur can significantly affect the time the page opens. Of course, we can always switch to about: blank in advance, but in this case we can skip this problem. And with the excellent performance of our tests, users will complain about the brakes. Again, choose based on your specifics. For comparative measurements, we always start with a blank page. And we catch problems with transitions from page to page as part of measuring the working time of critical business scenarios.
Is it important to measure one to one as customers? Maybe. But will there be immediate benefits to development and acceleration? Not a fact. Here is an excellent article that says that it’s important to simply select at least one metric and build on it to estimate the time it takes to open pages. It will be much easier to work with one selected indicator, track optimizations, and build trends. And only then, if there are resources for that, supplement with auxiliary metrics.
Why do I have a different result?
Great, now everyone in the company speaks the same language. Developers, testers, managers by page opening time mean the time of displaying the main content on the page. We even created a tool that accurately performs these measurements. We have fairly stable results, the measure of scatter is minimal. We publish our first report and ... get a lot of dissatisfied comments. The most popular of them is “but I tried it here, and everything is different with me!” Even if we assume that the measurement methodology was followed and the same tool was used, it turns out that everyone has completely different results. We start digging and find out that someone took measurements via Wi-Fi, someone had a computer with 32 cores, and someone opened the site from the phone. It turns out that the problem of measurements is no longer multifaceted, but multidimensional.
The question arose: what factors affect the time a page opens? In haste, such an associative map was drawn up .
Something about 60-70 different factors turned out. And a series of experiments began, which sometimes presented us with very interesting results.
Cache or not cache - that’s the question.The first anomaly we encountered was discovered in the very first reports. We took measurements with an empty cache and with a full one. Part of the pages with full cache was delivered no faster than with empty. And some pages take longer. At the same time, the volume of traffic at the first opening was measured in megabytes, and at the second it was less than 100 KB. We open DevTools (by the way, DevTools itself can have a strong influence on measurements, but for comparative research this is what you need), start the data collection and open the page. And we get this picture:
It is clearly seen here that most of the time the browser was parsing / initializing js files. Those. we have so much js code, and the browser uses the time it takes to receive files over the network so optimally that for the most part we depend on the speed of initialization of js modules than on the speed of receiving them. Network traffic is very important, but in view of the ideal connection (we measure it from the inside of the network), we get exactly this picture. This problem has already been highlighted, for example, by Eddie Osmani .
So, OK, with pages that in our report practically did not accelerate with filling the cache, everything is clear. And why did some of the pages begin to open even longer? Then I had to carefully look at the Network tab, on which the problem was discovered. Trying to reduce the number of requests, we combined almost all js modules with extra dependencies into one large file. And on one page, this file began to weigh as much as 3 MB. The disk was not an SSD, but a channel with zero ping. In addition, Chrome very curiously works with the disk cache, sometimes creating brakes out of the blue. Therefore, the file took longer from the cache than it flew over the network. Which, ultimately, led to an increase in total time.
Yes, page size is critical and needs to be reduced. But now, data structure optimization is no less important. What is the use of reducing the size of a small file by 10% through the new compression algorithm if the user spends the extra 50 ms to decompress? And if you look at the statistics from the site httparchive.org, we will see that a similar situation can only get worse: the
lower scale is the months and years, the left scale is the average js volume per page, and the right scale is the number of requests per page in average.
About network conditions.Although it was said above that we measure mainly on the ideal channel, sometimes it becomes necessary to study what the user experiences when they open our pages via Wi-Fi or 3G. Or maybe there’s a dial-up somewhere, and you want to understand whether, in principle, your page will open with Baba Frosi from the village of Kukuevo. And here we, of course, can put one of the nodes for measurements in the same village or emulate a bad channel. The latter draws on a separate article or even an entire book, so we restrict ourselves to a stack of tools that are successfully used with us.
Firstly, these are various http proxies: BrowserMobProxy (in light mode), Fiddler, mitm, etc. Of course, they do not emulate a bad channel, but simply create delays every n KB. But as practice shows, for applications working on http in general, this is enough. When we really want to emulate, netem and clumsy come to the rescue .
With such testing, it is desirable to understand how the network affects the performance of web applications. If this is not so important for obtaining results, then for their interpretation it’s worth really understanding this, so as not to show “it slows down” in the bug report. One of the best books on this subject is “High Performance Browser Networking” by Ilya Grigorik .
BrowsersUndoubtedly, the browsers themselves play a very important role in the opening time of a page. And now we are not even talking about those benchmark tests that every browser maker designs for themselves in order to show that their horse is the fastest on the planet. Now we are talking about various features of the engines or the browsers themselves, which ultimately affect the time the page opens. So, for example, Chrome initializes large js files as it is received in a separate stream. But what the authors mean by “large files” is not specified anywhere. But if you look at the source of Chromium , it turns out that we are talking about 30 KB.
And so it turns out that sometimes, by slightly increasing the js module, we can speed up the page loading time. True, it’s not so finite that now it’s just that way to increase all js modules in a row.
This is a small detail. And if you look more broadly, then we have various browser settings, open tabs, various plugins, different state of storage and cache. And all this, one way or another, participates in the browser and can affect how quickly this or that page opens for a particular user.
We found that there are many factors that have a significant or small impact on our measurements. What to do about it? Iterate over all combinations? Then we get a combinatorial explosion and do not have time to really measure even one page per release. The right decision is to choose one configuration for the main continuous measurements, as reproducibility of test results is of utmost importance.
As for the rest of the situations, then we decided to conduct separate individual experiments. In addition, all our assumptions about users may not be true, and it is advisable to learn how to collect indicators directly ( RUM ).
Instruments
There are a lot of tools devoted to measurements and web performance in general (gmetrix, pingdom, webpagetest, etc.). If we arm ourselves with Google and try a dozen of them, we can draw the following conclusions:
- all tools have a different understanding of what “page open time” is
- there are not so many hosts from which the page is opened. And for Russia - even less.
- Authenticated sites are very difficult to measure. In few places there is a way to overcome this problem.
- reports for the most part without details, everything is limited to a ladder of queries and simple statistics
- the results are not always stable, and sometimes it’s completely unclear why
Next, the most practical.
WebPageTest Of all the variety of tools, WebPageTest stands out positively . This is a hefty multi-harvester, constantly evolving and delivering excellent results.
One of the main advantages of this tool:
- the ability to deploy a local node and test your sites from the corporate network
- amazing detailed reports (including screenshots and videos)
- good API
- many ways to determine when to open a page
About the last plus it is worth saying separately. Here, perhaps, almost all the methods are really collected. The most interesting are Speed Index and First Interactive. About the first mentioned before. And the second tells us how long after the appearance of the page will begin to respond to our actions. And suddenly the insidious developer began to generate pictures on the server and send them to us (I hope not).
If you deploy such a solution locally, then you will cover almost all of your performance testing needs. But, alas, not all. If you still want to get the exact time of the appearance of the main content, add the ability to execute entire scripts using convenient frameworks, you have to make your own tool. What we at one time did.
SeleniumMore out of habit than consciously, Selenium was chosen for the first pancake. Without taking into account small details, the whole essence of the solution looked like this: We
translate the browser into the desired state, open the page, and begin to wait for Selenium to consider the target element accessible and visible to the user. The target element is what the user expects to see: message text, article text, picture, etc.
All these measurements were carried out 10 times, and averaged results were calculated (eg median, arithmetic mean, ...). In general, from time to time a more or less stable result was obtained. It seems to be happiness, but our long-suffering forehead is again faced with a universal rake. It turned out that although it was stable with one invariable page, it started to jump unreasonably when changing this page. The video helped us figure this out. We compared two versions of the same page. By video recording, the pages opened almost simultaneously (± 100 ms). And measurements through Selenium persistently told us that the page began to open one and a half seconds longer. And stably longer.
The investigation led to the implementation of is_displayed in Selenium. The calculation of this property consisted of checking several js properties of the element, for example, that it is in the DOM tree, that it is visible, has a non-zero size, and so on. Moreover, all these checks are also carried out recursively for all parent elements. Not only can we have a very large DOM tree, but the checks themselves, being implemented on js, can take a very long time at the moment of opening the page due to the initialization processes of js modules and execution of other js code.
As a result, we decided to replace Selenium with something else. At first it was WebPageTest, but after a series of experiments we implemented our simple and working solution.
Own bike
Since we mainly wanted to measure the time of the visual appearance of the main content on the page, we also chose measurements for the tool by taking screenshots at a frequency of 60 fps. The measurement mechanism itself is as follows:
Through the debug mode, we connect to the Chrome browser, add the necessary cookies, check the environment and start taking screenshots via PIL in parallel on the same machine . We open the page we need in the test application (UAT). Then we wait for the termination of significant network and visual activity lasting 10 seconds. After that, we save the results and artifacts: screenshots, HAR files, Navigation Timing API and more.
As a result, we get several hundred screenshots and process them.
Usually, after removing all duplicates from hundreds of screenshots, no more than 8 pieces remain. Now we need to calculate some diff between neighboring screenshots. The diff in the simplest case is, for example, the number of changed pixels. For greater reliability, we do not consider the difference of all screenshots, but only some . After which, summing up all the diffs, we get the total number of changes (100%). Now we just have to find a screenshot, after which> 90% of page changes occurred. The time taken to get this screenshot will be the time the page opens.
Instead of connecting to Chrome via a debug protocol, Selenium can be used just as well. Because since version 63, Chrome supports multiple remote debugging, we still have access to the entire data set, and not just what Selenium gives us.
As soon as we had the first version of such a solution, we started a series of tedious, painstaking, but very necessary tests. Yes, tools for testing your products also need to be tested.
For testing, we used two main approaches:
- Creating a reference page whose loading time is known in advance.
- Using alternatives to determine when to open pages and performing a large number (> 100 for each page) of measurements. Most of all, the screen video came up here.
We carry out tests regularly, as the tool itself changes, the tested applications change. When writing this article, I took one of the stable pages (the server part runs almost instantly) and conducted a series of 100 tests through 3 different approaches. Through the video I measured 10 times and calculated the median.
As we see, through the screenshots we get a result close to reality within 10 ms of the error. But through Selenium we have a rather strong spread with an incomprehensible emission of up to 5 seconds.
Yes, again about a spherical horse in a vacuum, this is not a universal method. Such an algorithm works with us, with our products, but it can easily not work for other sites. Moreover, as with many previous approaches, he is not devoid of the observer paradoxlike in quantum physics. We cannot see the result, guaranteed to not affect it. You can only reduce the degree of error.
At a minimum, PIL also utilizes some resources. But, nevertheless, such a solution has been successfully used in the company for the last year. It is regularly updated, but the basic idea remains unchanged.
Author Sergey Dokuchaev