Allure 2: next generation test reports
The last eight years, Artem Eroshenko has been engaged in test automation. During this time, he managed to interact with different teams in different positions, but for most of his career he worked in the development team of testing tools. In this team, the Allure Auto-Test Reporting tool was born, which they oversensored.
There are people who do not know about this tool. Therefore, we will start with a brief introduction to the Allure report.
The basis of this material was the presentation by Artem Eroshenko at the Heisenbag 2017 Piter conference. At the Moscow conference on December 8-9, Artyom will deliver a new report.
First of all, the Allure framework is a tool for building understandable auto-test reports.
What problems does Allure solve? First, it shows what happens in your test.
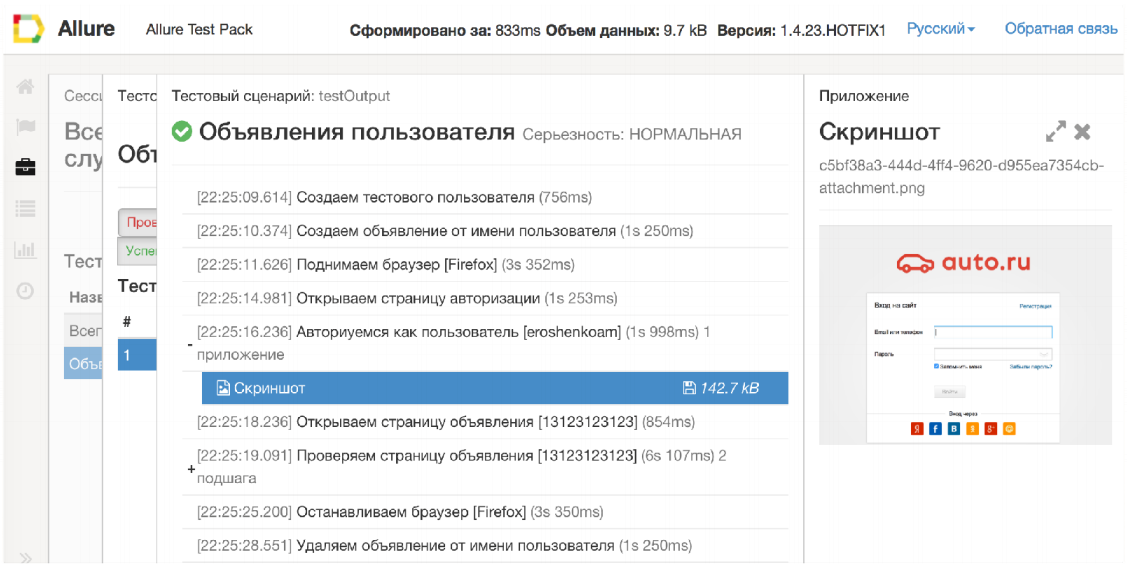
To solve this problem, Allure applies a detailed execution script for each test, including attachment, step, etc.
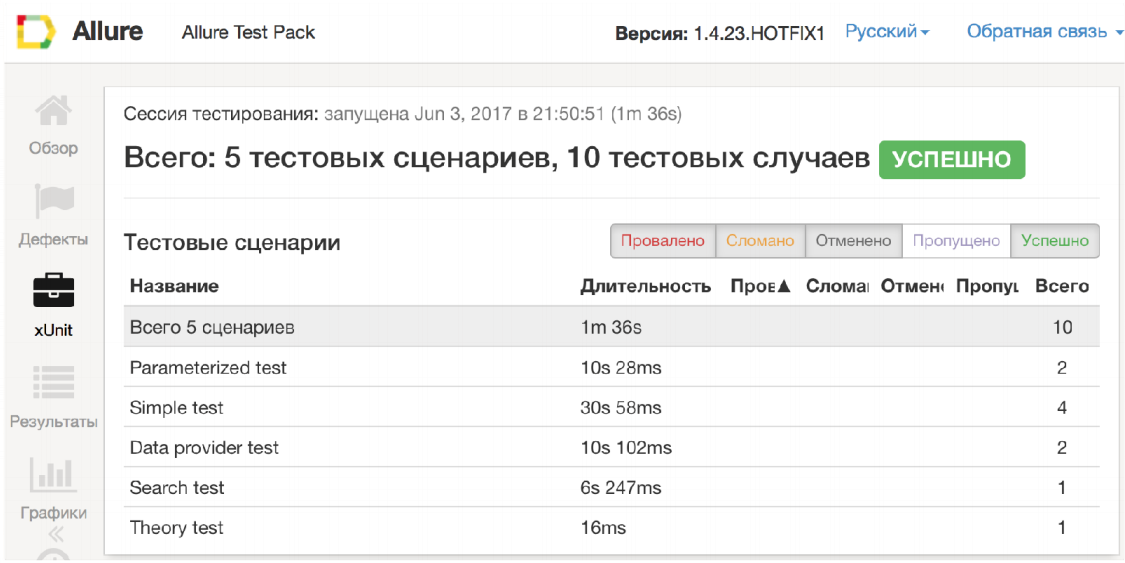
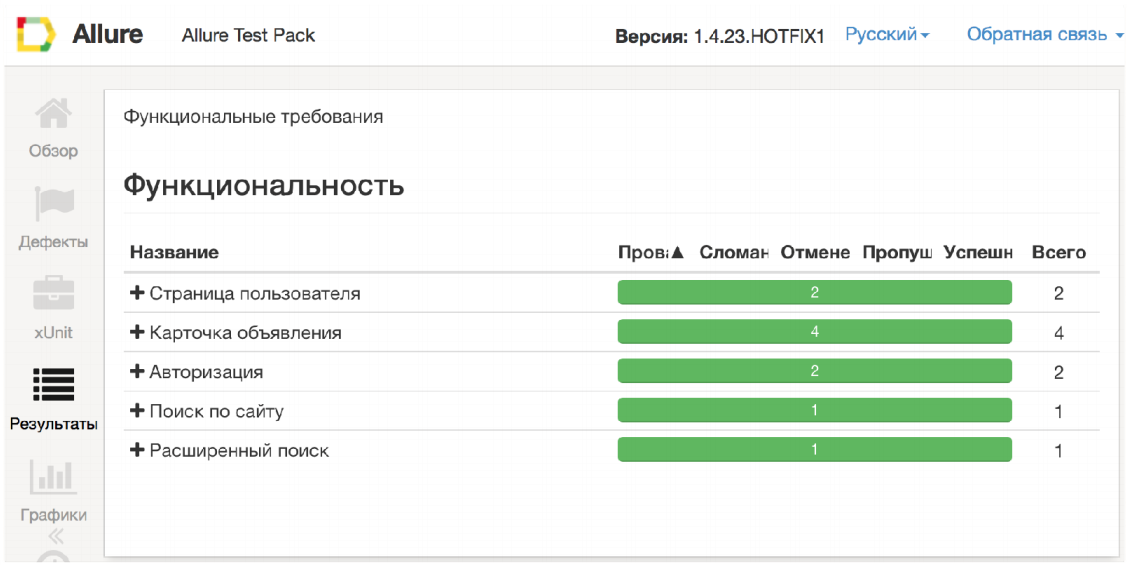
Secondly, different roles in the team present different requirements for displaying the test results in general. For example, it is much more convenient for a developer to see a grouping of tests by test classes. He wonders in which test class and method the error occurred. On the other hand, the manager is much more interested in the presentation of features. It is closer to functionality. He is interested to know which feature does not work and for what reason. Allure solves this problem.
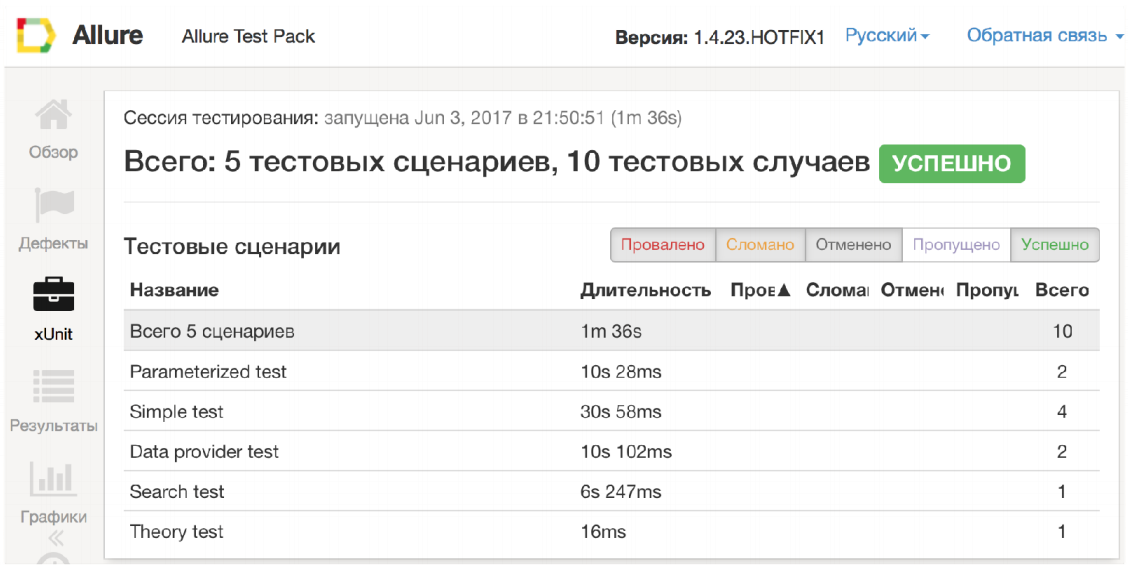
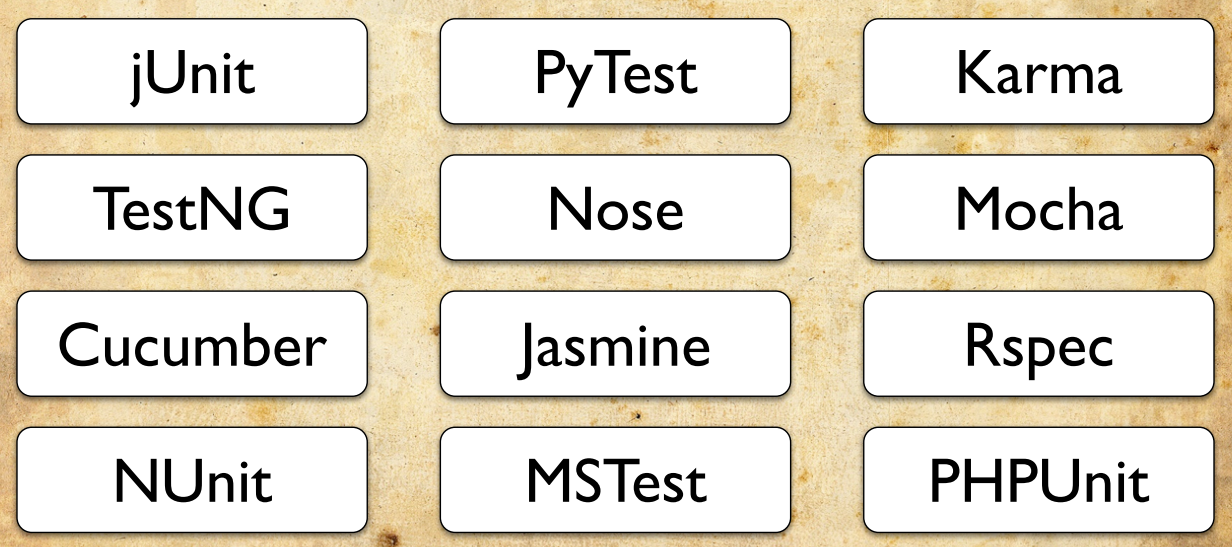
Well, the third problem that Allure solves is the browser zoo. You can always build a single report - no matter which framework you use.
This is the Allure Report.
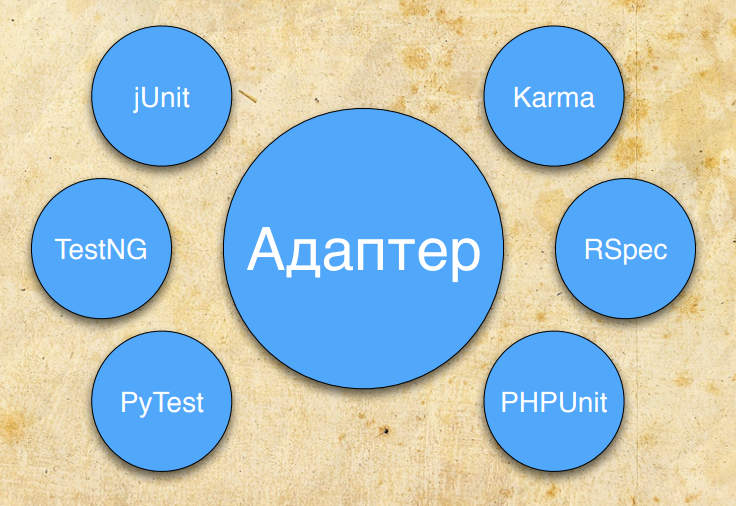
In general, Allure seems to be pretty cool. From the limitations, I see that he always has one data source - the so-called adapter. Here's how this mythical adapter works.
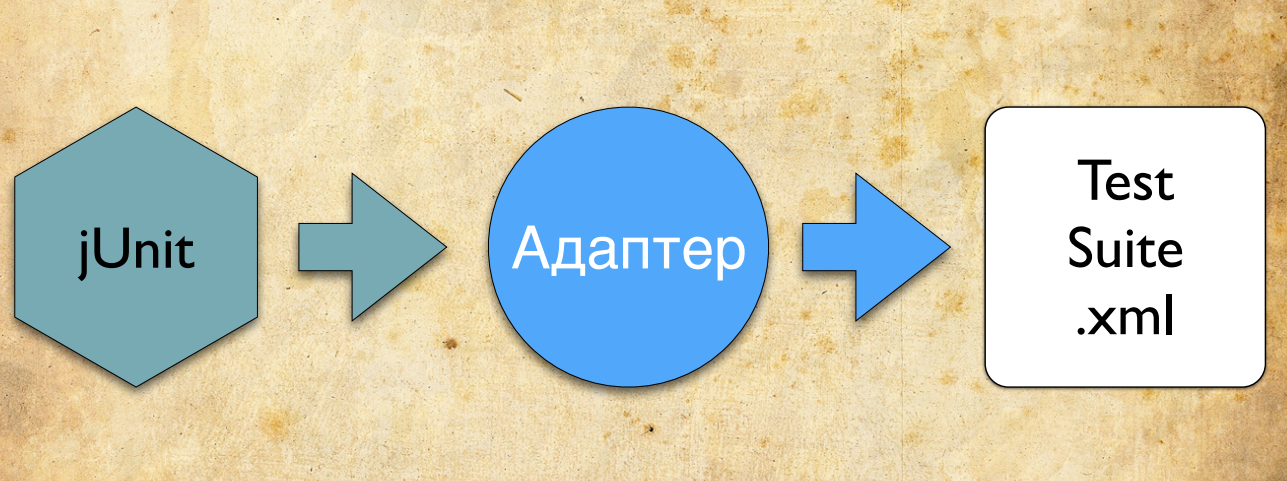
Imagine that you are writing tests in jUnit. You connect the Allure jUnit adapter to it. During the execution of your tests, the adapter collects all the necessary information. He understands when the test began, when the test ended, with what error fell. It also collects detailed information about your test script.
After running the tests, the adapter saves the data as xml. This is his task.
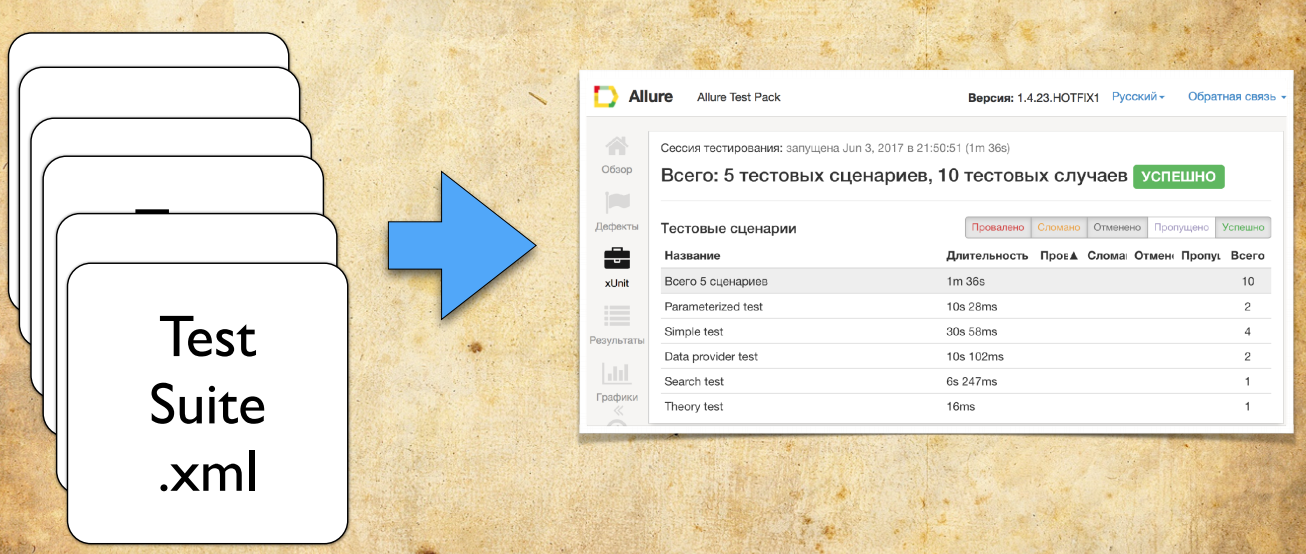
Based on several such xml files, the Allure report is built.
A separate adapter is written for each testing framework.
But not all information is in the adapter. Those. it’s impossible to remove all the information from the adapter, because it is very close to a specific framework.
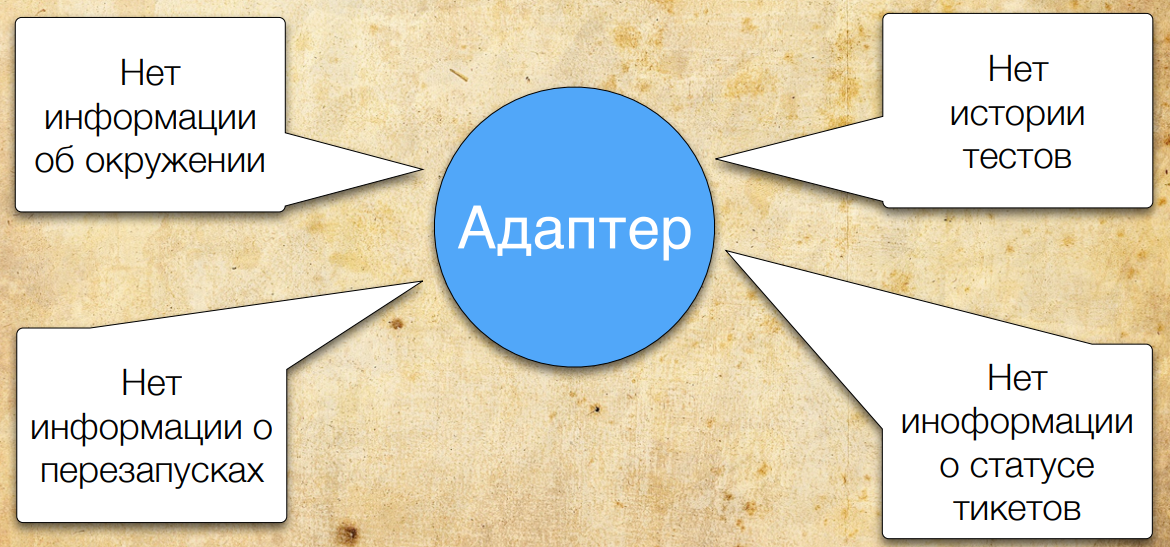
For example, the adapter does not have information regarding configurations - what exactly are you testing; no historical data - when tests were started, when they were restarted, etc. Also in the adapter there is no information about open and closed issues. That is why the new version of Allure provides many data sources.
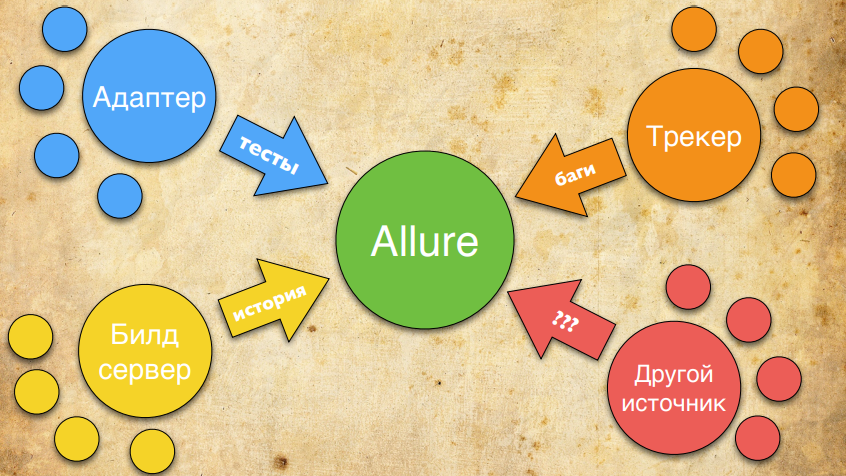
For example, we will still take information about the test from the adapter. This is normal information, it has a script, and so on. Information about the history of the test — when it was last run, with what error it fell, and so on — we will take from the CI server. We can take information about open tickets, statuses, and product errors from Jira. And, if necessary, you can implement an extension that already supports some of your adapters and adds the necessary information to Allure. Those. The new version of Allure is primarily configured to have multiple data sources. We will expand the number of sources and supplement the report so that it contains all the necessary information, and you can quickly understand what your problem is: in the product or in the test.
Next I will tell:
We are pleased with the greatly upgraded test execution scripts.
What appeared there?

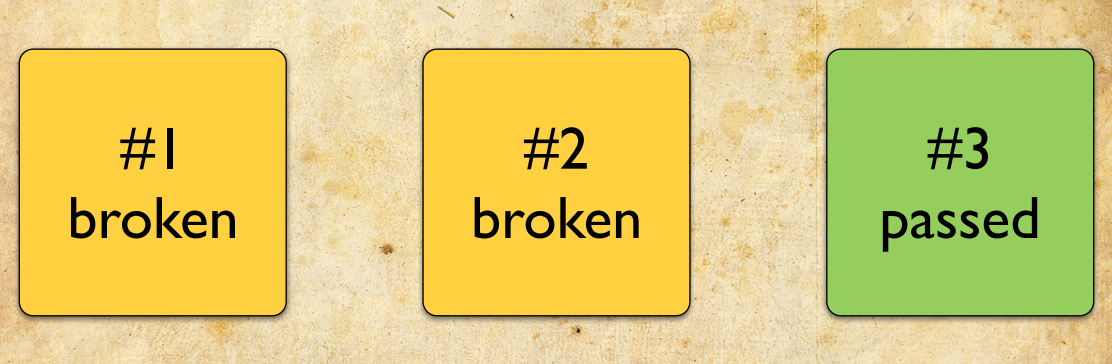
Tests are not always perfect. The environment of the test infrastructure is especially imperfect. And often there is a situation where you need to restart the tests. That is, you ran the test once, it broke, you restarted - it broke again, and the third time you started - everything is fine. And the restarts were due to some kind of infrastructure problem. Previously, Allure was not able to glue these tests together. He thought it was 3 different tests.
In order not to spoil the statistics, testers usually using custom adapters changed the status of broken tests to skipped - that is, they supposedly are not needed. However, this still spoiled the statistics. It was not 100% green tests, but 90% green tests and 10% skipped. Plus, these tests in the tree were visible - they interfered with the look.
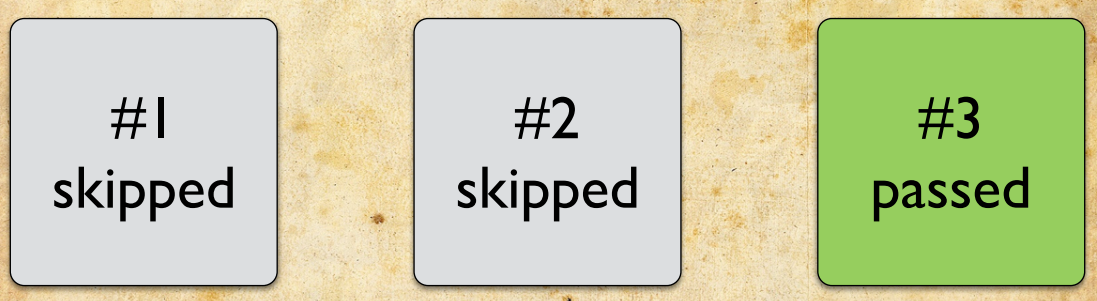
The new Allure can automatically recognize retries (restarts) and glue them into one test.
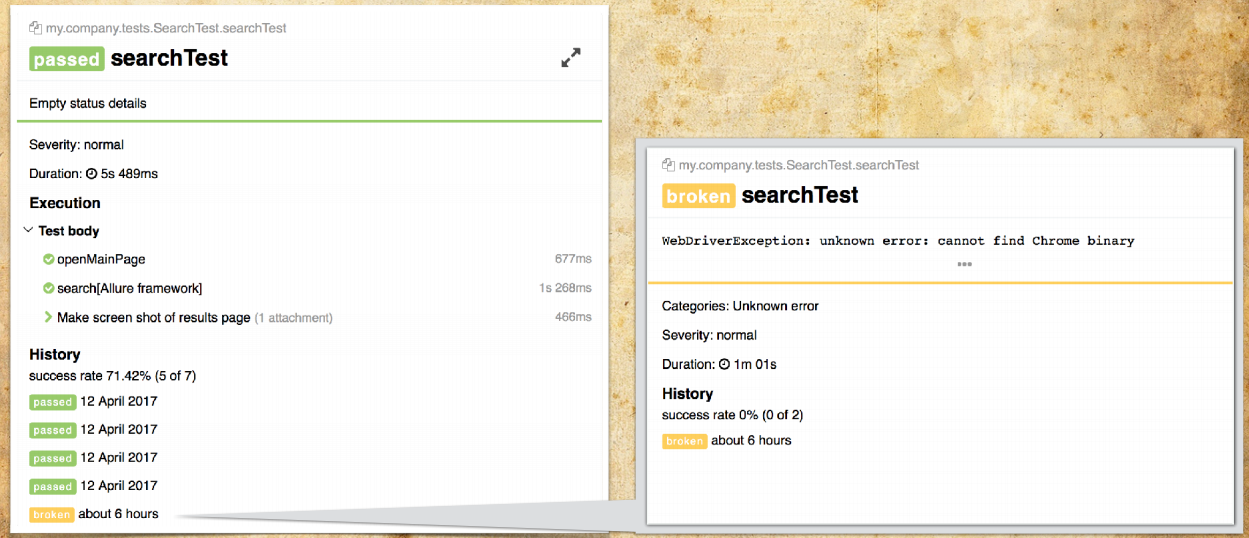
How does this happen? We can analyze classes, methods and test parameters. Based on this, the so-called history ID is generated - a unique test key by which we can perform gluing. On this key, tests are collected, ordered by time. The last status is determined from the last test (by time).
It looks like this:
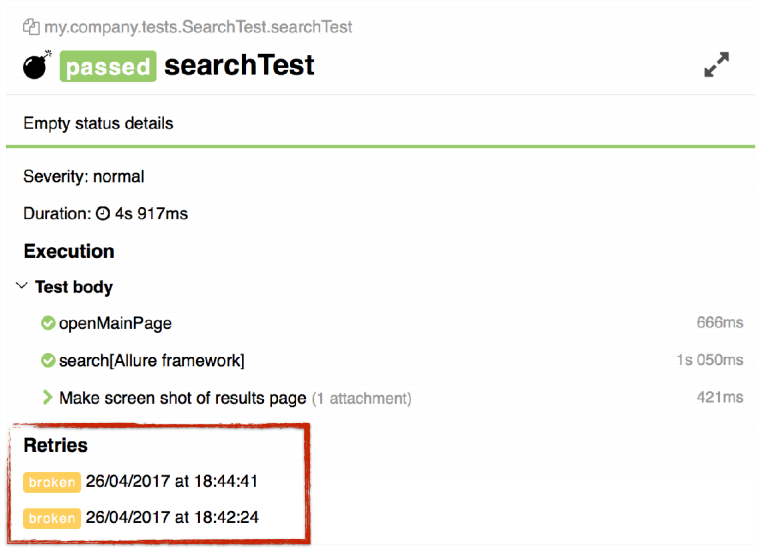
A special block called retries appears at the bottom of the test. It contains information about restarting the tests. I note that these tests, except in this block, are not displayed anywhere else. They do not spoil statistics, do not appear in the tree.
Links to tests are clickable: you can click on the links and see why the test fell last time.

In my opinion, such tests are not very good, because they are unstable. It turns out that at first the test fell with an error, then you did something there and the test passed. We place such tests on the side with a bomb indicating that he should not be trusted. A similar icon is displayed in the tree. Those. you won’t lose such tests - just open the tree and immediately see all the tests for which you need to analyze the causes of the crash.
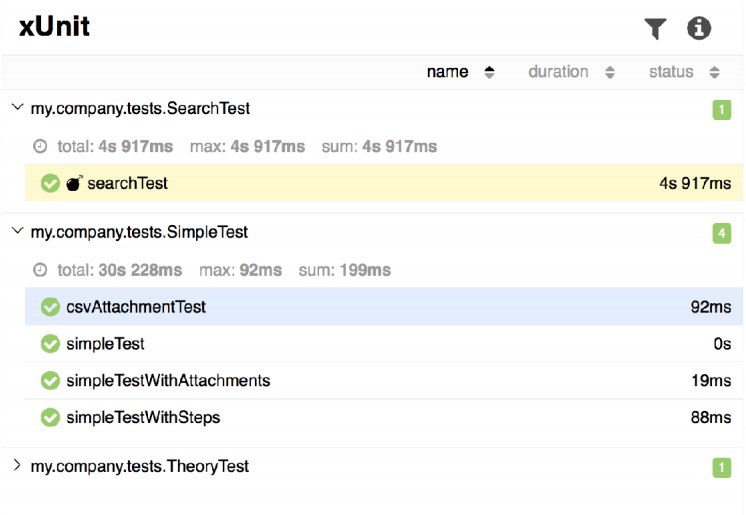
However, such tests will not affect the overall performance statistics.
This feature is a consequence of the functionality described above. It allows you to combine multiple launches into one.
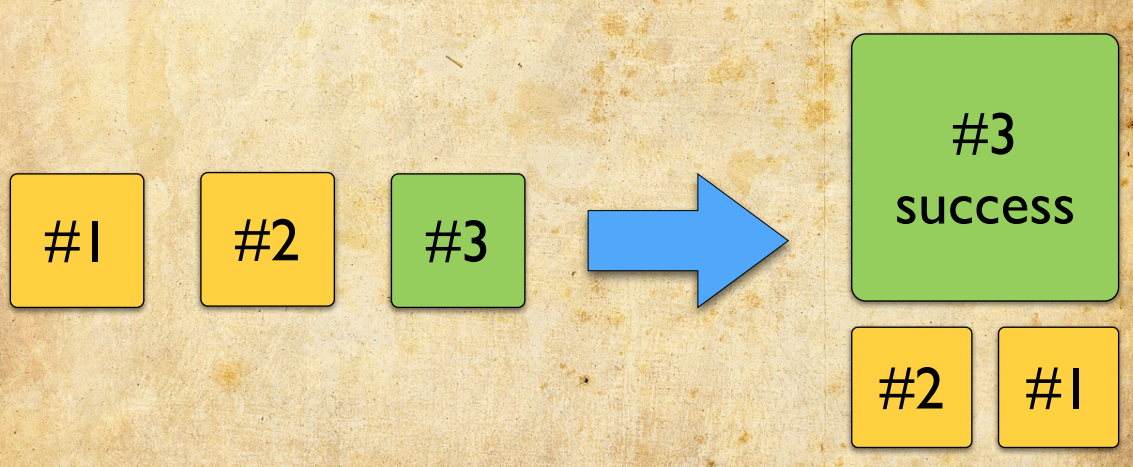
Imagine that you ran tests and some of them fell due to infrastructure problems. Then you restarted the tests, again some part fell. In the end, you repaired your tests, and you want to see a report that shows that the tests you actually passed. Yes, the last time they fell, and there is some “red” information that some tests were broken.
You can do this with one command:
You do allure generate, give it three directories (first, second and third run), and it marks all the tests that were in retries, i.e. he glues together all the tests that were run, takes the last time result (maybe it is not green, but red), and he puts all the other tests into retries.
This mechanism allows you to generate a summary report based on several starts or restarts.
I really like this feature, because it allows you to parse and analyze reports much faster.
As you know, Allure has 4 completion statuses:
This:
We were often asked to add additional statuses, for example, “error creating user for testing” or “Selenium error”, “problem with selectors” and so on. We decided not to expand the number of statuses, but to add some orthogonal concept - a category of errors.
To use categories, you need to prepare a configuration file called categories.json. This file contains information about the categories of errors that you will use:
For example, you create a category called “obsolete tests” - these are outdated tests that need to be fixed. All errors that satisfy the pattern will be added to it (in our case, if the element is not found on the page), selectors will definitely need to be edited here. After that we say that all tests with the broken status should be included here.
We can also track down problems in the cluster of browsers and put the timeout there.
After you generate the report, you will have a new tab.
Previously, this tab was called Defects, that is, there was information about product defects and tests. Now more data is appearing there, in particular, information about our categories: “Problems in the cluster of browsers” - one problem, “Outdated tests” - the second problem. Then the problems found and new problems in the tests that need to be disassembled. Thus, after running your tests, you can quickly figure out what really happened in the tests and for what reason they fell using this tab.
The error category is displayed in each test.
You can see a new block showing which category of errors this test belongs to. There may be several such categories - the test may fall due to several problems, respectively, you will have several categories here.
We have just started working on the categories of errors, and we have a lot of plans where we can develop. In particular, I really want to add categorization to BDD and suites. I would like to understand something like this: we did not check the authorization, because everything fell on Selenium problems, we also did not check the creation of the client, because we do not have a contract created. That is, we want us to operate with additional data in the report. So that we are not limited to information such as “some feature does not work” for 5 test cases, but understand that it does not specifically work in this functionality. The second thing I want to understand is some statistics by category. It’s very interesting to come to your infrastructure support team and say: “I have 20% of the tests constantly falling due to Selenium errors. Let's do something about it. ” We will work on this,
The most interesting point that we were asked a lot about is the test history.
Ordered - get it. Test history is now officially maintained by Allure through communication with the CI server, which is the data source. Jenkins, TeamCity and Bamboo are now supported. You can also easily adapt your framework and make generation through Allure.
It is very important to understand that this all works out of the box. Allure has not acquired a database; it is still the same simple, easy and reliable tool. It essentially generates a static report, but just during generation it pulls up data from CI servers about when which tests were run.
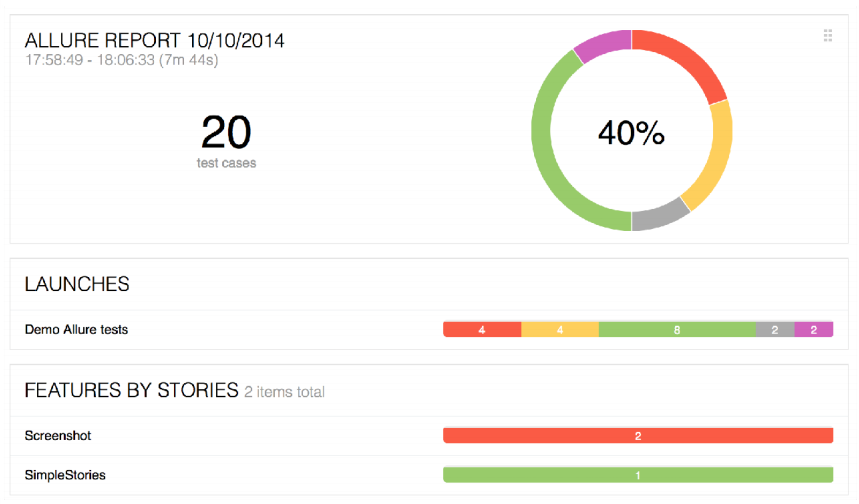
The first thing you will see when you use Allure 2 is trend information.
You will see a graph of the last 20 starts - when what tests were run. You can click on this chart, and you will switch to previous builds.
The story is also displayed on the test case page.
She looks like a Retries block now. The lines there are also clickable. If you click on the line, then go back to history to the previous build for a specific result.
You can easily switch and quickly analyze specific problems.
Stories are also just the beginning. In the future, I really want to work out the mechanism of precisely new tests: “how many tests were added this week”, “and if for people - how many tests were added by one tester, how many tests were added by the second tester”, “and how stable we have new tests - which new ones tests success rate indicators "and so on. We will move in this direction - in Allure there will be information about new tests, what problems are in these tests.
In addition, I want to work out the issue on the basis of historical data about known problems. I would like to immediately show that such a problem has already been encountered, where it has been encountered, and so on. And this will also be done on the basis of historical data.
Another feature that itself suggested itself was data export. It is now supported as such, i.e. There is a possibility to export data, but features with data export are not yet ready. Nevertheless, I really want to talk about them.
The first feature is a summary report.
Allure has long been asking for a report that can be sent by e-mail. This is especially true for any CI-server when you have passed the tests, and CI can simply say: "You had some problems in the build." We will generate some consolidated report, which can be attached to the build and sent by mail.
In addition, I want to do some export of summary statistics in CSV and PDF formats. You can print Allure to transfer to a friend or customer so that he does not have to click on the report.
This is the end of the talk about the big features of Allure. We began to collect data for the report from various sources and will continue to develop in this direction.
Now I want to talk about how you can customize Allure for yourself. It’s not just called a framework. You should be able to add something to it.
Allure has a pretty good extension system, in my opinion. Extensions are written using Java and JavaScript (Allure itself is written in Java and JavaScript - the muzzle is written in JavaScript and the kernel in Java).
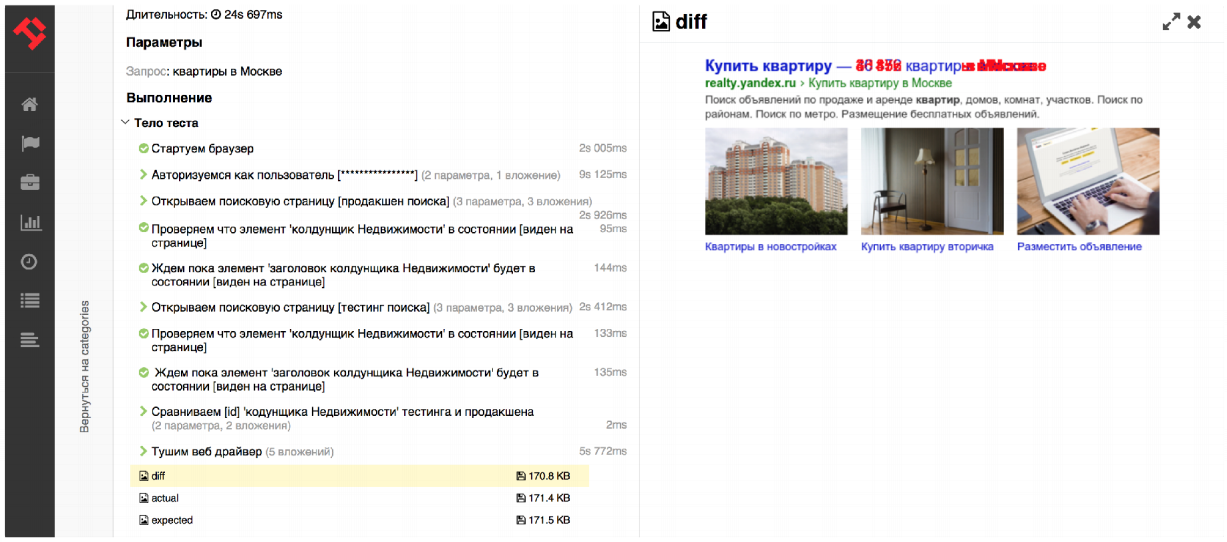
As an example, let's write a small extension that will help to display a comparison of screenshots directly on the test case page, i.e. will add an additional block there. I think that every tester who deals with the web interface has faced such a problem. By comparing screenshots, you can quickly roll up the initial tests for the functionality of the service. You take a screenshot of the elements in testing, take a screenshot of the elements in production and check the Diff, which will look like this:

So you very quickly have a large set of tests.
Screenshots used to be added as attachments. To reach them, you had to first open the test case, then the test, then go to execution, click on the screenshot link and then it will be displayed.
Now it is possible to add blocks directly in the test execution script - directly on the main page.

How to make such an extension?
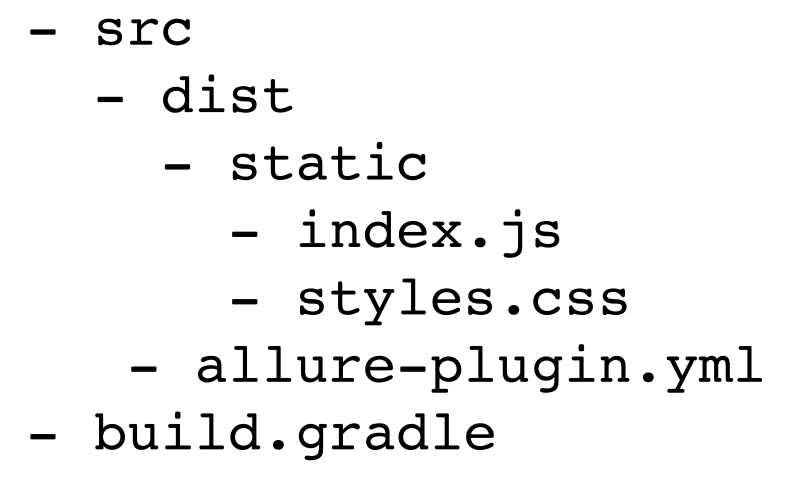
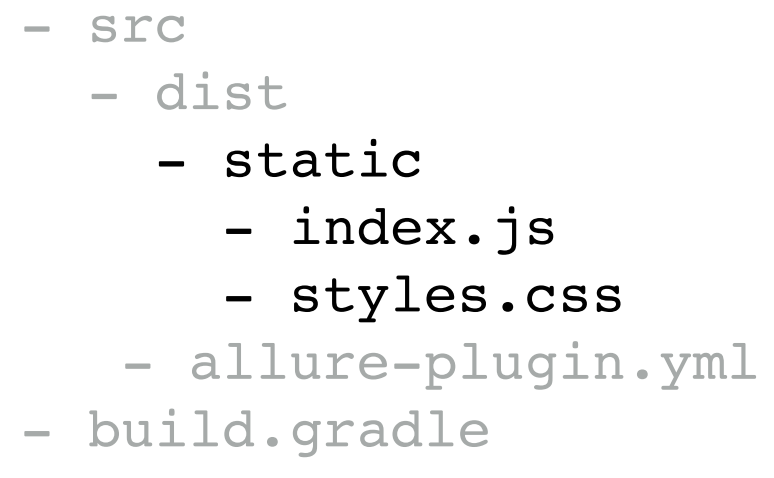
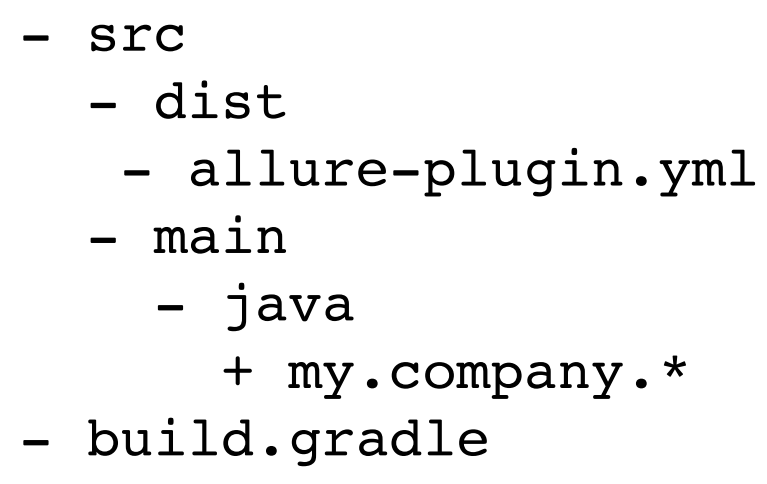
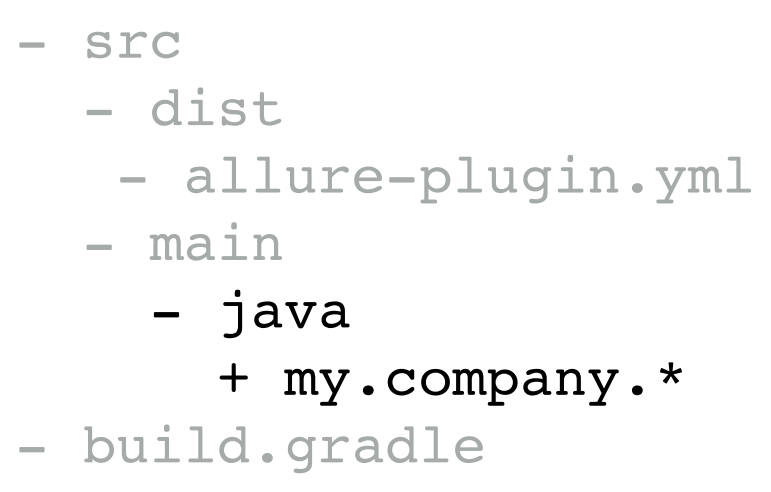
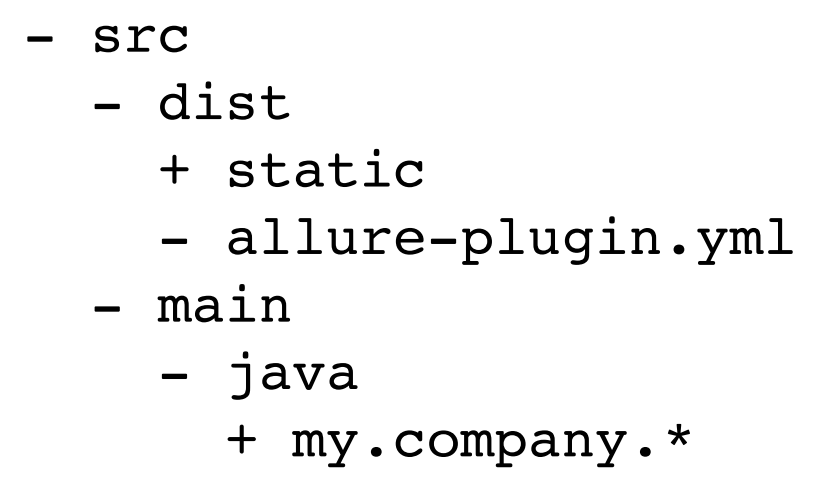
First, we use gradle as a project build system.
I won’t talk more about the insides, I want to concentrate on the extension itself. To do this, we need to write a piece of JavaScript that simply sticks the necessary information into execution.
First, we will make a function that renders image.
After that we extend Marionette.View to them, that is, we will make such an additional extension in which you can add JavaScript logic. For example, press the button - it shows production, press the button - it shows the test, press the button - it shows Diff. After that, we call the Allure API and add the block directly to the test result. As a result, you will display it directly on the main page.
The second extension I want to talk about is support for its format. It happens that you have all the necessary information in the framework - about starting a test, all features, actions, and so on. And you don’t want to connect some of our adapter or, for example, the necessary adapter does not exist. In this case, if you already have the results, you can simply read them out, at the time of building the report, converting them into Allure results. That is, you can, in principle, pass the stage of connecting the adapter. This will be useful, for example, to read out already standard formats. Here TeamCity supports the format mst, testng and so on. After some time, Allure will support these formats by default, i.e. we can generate a report without connecting an adapter. This report will be minimalistic, but for people
What does this extension look like?
There is no JavaScript in this extension, this is purely Java logic: we need to read the results, after which we convert them to Allure. We are interested in the Java part:
To support its own format, there is an interface called Reader.
The configuration is fed to the input (here you will find the entire confederation regarding Allure), then you get some Visitor to the input. It allows you to add new tests to the Allure Report. And the last one is the directory that we will analyze.
As we write the new extension:
First we read all the files from this directory. Then we put all these files into some kind of your object. After that, we convert your data structure to Allure Results and add them to Visitor. In principle, there’s nothing complicated - you just need to convert your format to Allure Results.
With these extensions, you can support your frameworks, which can no longer creep into. For example, if there are no listeners.
As you know, Allure has the first categorization - by test cases (i.e. you see the package, and it has a specific test case), and the second categorization - by feature story (first, all tests are grouped by features, then all tests are grouped by story).
To make an arbitrary tree, you need to perform 2 points:
Let's analyze the structure of the solution in order.
Let's start with the Java part. To collect information on test categories, it is necessary to extend abstract or agregator. He needs to implement the name of the file, in which you will have information about the categories, and a list of categories. That is, first we collect information on the component, after that - modulo.
Then this information should be displayed already in the Allure report itself.
To do this, we pull the Allure API, add a Tab called custom. We fill in the title, icon and route into it (i.e. all requests that will go to the custom ID will be sent to this tab).
Using standard Allure components, you draw a new tree. You can add arbitrary information, in particular, new graphs or widgets. For this we have a library of components that you can use at home.
After starting Allure and connecting the extension, a custom tab will appear, in which the grouping according to your settings will be implemented.
This solution is suitable for companies that already have some kind of test structuring, for example, that came from the past (for example, you are not using or want to use feature story yet).
Now the distribution of such extensions is not yet ready. There is no mechanism through which you can select a new extension and load it into Allure (extension market). Nevertheless, we are working on this and hope that after some time we will have a set of extensions, and we will be able to flexibly load them into Allure. That is, you can directly specify in the configuration that I need this and this extension. I would like to see as much new functionality as possible in Allure.
I tried to fit almost every extension onto one slide. It’s clear that in reality this is too cool - I skipped a lot of code because I wanted to show the possibilities. In fact, only fairly experienced users who can program in Java and in JavaScript, Backbone and so on can write the extension. In my opinion, it is not as simple as it seems. But you can try. If you have any ideas how to make any extensions that will be useful to the entire community, we will be happy to hear from you and write these extensions yourself. Send us your ideas about what information you can add to the report, to the repository.
Let's talk about how to migrate to the new Allure and what migration is.
Allure is fully backward compatible. You can now download version 2.1.0, put it to yourself and build a report already according to current data. No need to change anything except the version of Allure Report itself.
For example, you can do this for Jenkins like this:
You had Allure 1.5.4 before. You pumped it out of Maven Central. You add a new tool - Allure 2.1.0, specify the URL (unfortunately, now there will be such a long URL - I already sent a request to Jenkins, and they should install it in the near future, then it will be available as before through the drop-down menu).
After adding a new URL, you configure some of your job, where you have the opportunity to switch from 1.5.4 to 2.1.0, and everything works.
At the same time, you immediately get the chips discussed above: restarts, consolidating reports, history, the ability to add new blocks to test cases, and so on.
Why then update the adapters?
We try to collect information from the tests as much as possible. For example, in the latest version, we begin to integrate more tightly with all sorts of standard solutions. The first thing we will do now is custom attachments for http samples, for http client, for retrofit, etc. If you use one of these technologies, you simply connect Allure retrofit to yourself, and you will immediately have detailed scripts with logs, requests and answers in Allure.
We will carry out further integration with ready-made frameworks and make bindings around them.

If you use Allure and want to keep abreast of the latest developments, join our community.
The first thing you can do is to follow us on Github . There are all the repositories and integrations that are in Allure. Come, subscribe to the integration you are interested in. And you will be aware of what is happening there.
If you have any kind of emergency problem, if you don’t understand what’s going on, visit us on Gitter: here and here . This is an online chat. We constantly in real time answer there all the questions. If you encounter any problem that you cannot quickly solve, and you need a quick solution, write to us there, we will respond to you promptly and help you figure it out.
Follow us on Twitter: eroshenkoam (I) and @QametaSoftware (twitter, where we will post about new versions of Allure, adapters, etc.).
If you want to click on some demo, I made a link . By clicking on it, you can find out what's new in Allure.
Artem Eroshenko is preparing an interesting new report specifically for the Heisenbag 2017 Moscow , which will be held in Moscow. The program is still being formed, but some key reports are already known . Detailed information on the event and conditions for participation are available on the conference website .
There are people who do not know about this tool. Therefore, we will start with a brief introduction to the Allure report.
The basis of this material was the presentation by Artem Eroshenko at the Heisenbag 2017 Piter conference. At the Moscow conference on December 8-9, Artyom will deliver a new report.
What is the Allure framework?
First of all, the Allure framework is a tool for building understandable auto-test reports.
What problems does Allure solve? First, it shows what happens in your test.
To solve this problem, Allure applies a detailed execution script for each test, including attachment, step, etc.
Secondly, different roles in the team present different requirements for displaying the test results in general. For example, it is much more convenient for a developer to see a grouping of tests by test classes. He wonders in which test class and method the error occurred. On the other hand, the manager is much more interested in the presentation of features. It is closer to functionality. He is interested to know which feature does not work and for what reason. Allure solves this problem.
Well, the third problem that Allure solves is the browser zoo. You can always build a single report - no matter which framework you use.
This is the Allure Report.
In general, Allure seems to be pretty cool. From the limitations, I see that he always has one data source - the so-called adapter. Here's how this mythical adapter works.
Imagine that you are writing tests in jUnit. You connect the Allure jUnit adapter to it. During the execution of your tests, the adapter collects all the necessary information. He understands when the test began, when the test ended, with what error fell. It also collects detailed information about your test script.
After running the tests, the adapter saves the data as xml. This is his task.
Based on several such xml files, the Allure report is built.
A separate adapter is written for each testing framework.
But not all information is in the adapter. Those. it’s impossible to remove all the information from the adapter, because it is very close to a specific framework.
For example, the adapter does not have information regarding configurations - what exactly are you testing; no historical data - when tests were started, when they were restarted, etc. Also in the adapter there is no information about open and closed issues. That is why the new version of Allure provides many data sources.
For example, we will still take information about the test from the adapter. This is normal information, it has a script, and so on. Information about the history of the test — when it was last run, with what error it fell, and so on — we will take from the CI server. We can take information about open tickets, statuses, and product errors from Jira. And, if necessary, you can implement an extension that already supports some of your adapters and adds the necessary information to Allure. Those. The new version of Allure is primarily configured to have multiple data sources. We will expand the number of sources and supplement the report so that it contains all the necessary information, and you can quickly understand what your problem is: in the product or in the test.
Allure 2
Next I will tell:
- What appeared the main big features for Allure as a whole (not specific to a specific framework);
- how you can customize Allure for yourself, for this there is a wonderful extension mechanism;
- how to migrate to Allure.
What is new?
Test execution scripts
We are pleased with the greatly upgraded test execution scripts.
What appeared there?
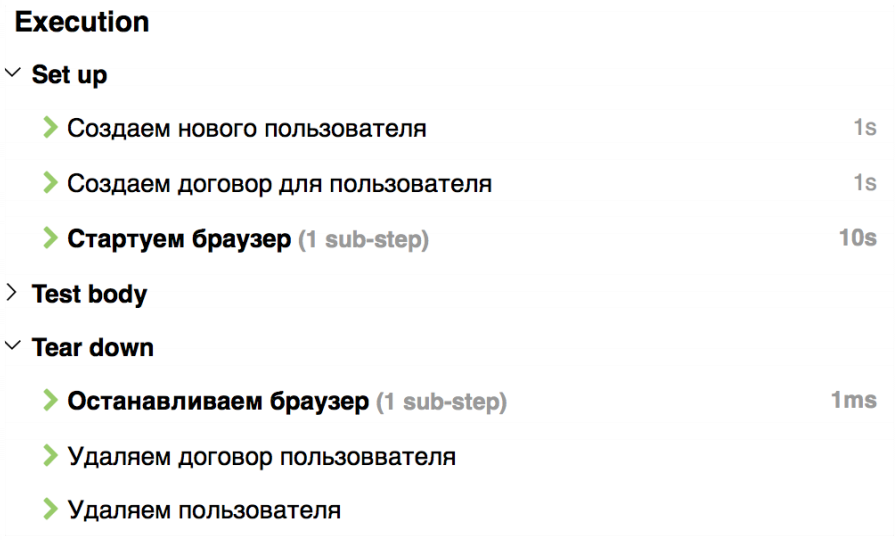
- test fixture support. Now you can see what code was run before the test (before, before class) and after the test (after, after class). Information on preparing and clearing the configuration is now in the set up and tear down blocks;
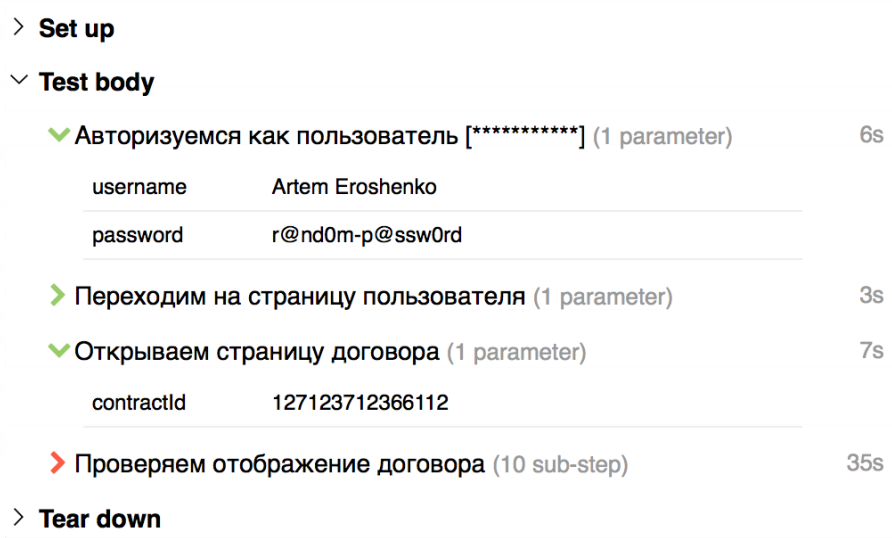
- we added parameters to the steps. Now there is no need to print all the parameters in tittle, you can just print only the necessary parameter, for example, username. And all other parameters will be in a convenient label:
- Now you can add custom blocks to the test execution script. For example, if you use the screenshot comparison mechanism, you can add Diff directly to the test script and you will immediately understand that such and such a problem has occurred, because your screenshots differ;
Test restarts
Tests are not always perfect. The environment of the test infrastructure is especially imperfect. And often there is a situation where you need to restart the tests. That is, you ran the test once, it broke, you restarted - it broke again, and the third time you started - everything is fine. And the restarts were due to some kind of infrastructure problem. Previously, Allure was not able to glue these tests together. He thought it was 3 different tests.
In order not to spoil the statistics, testers usually using custom adapters changed the status of broken tests to skipped - that is, they supposedly are not needed. However, this still spoiled the statistics. It was not 100% green tests, but 90% green tests and 10% skipped. Plus, these tests in the tree were visible - they interfered with the look.
The new Allure can automatically recognize retries (restarts) and glue them into one test.
How does this happen? We can analyze classes, methods and test parameters. Based on this, the so-called history ID is generated - a unique test key by which we can perform gluing. On this key, tests are collected, ordered by time. The last status is determined from the last test (by time).
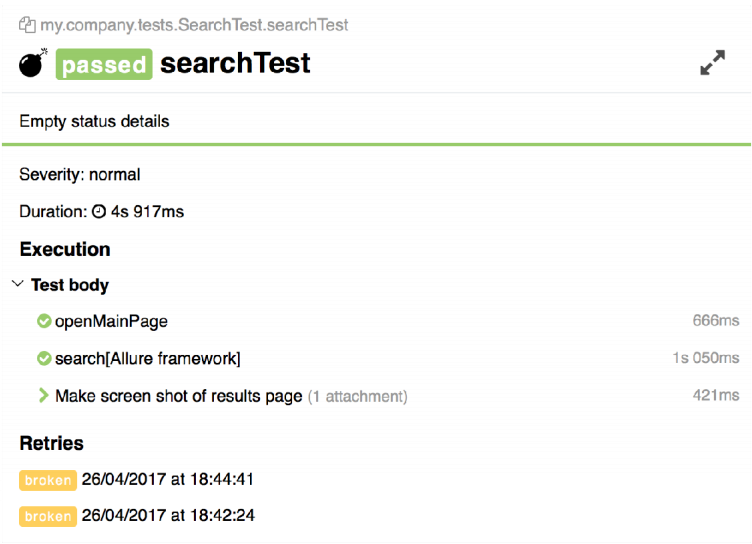
It looks like this:
A special block called retries appears at the bottom of the test. It contains information about restarting the tests. I note that these tests, except in this block, are not displayed anywhere else. They do not spoil statistics, do not appear in the tree.
Links to tests are clickable: you can click on the links and see why the test fell last time.
In my opinion, such tests are not very good, because they are unstable. It turns out that at first the test fell with an error, then you did something there and the test passed. We place such tests on the side with a bomb indicating that he should not be trusted. A similar icon is displayed in the tree. Those. you won’t lose such tests - just open the tree and immediately see all the tests for which you need to analyze the causes of the crash.
However, such tests will not affect the overall performance statistics.
Startup Combination
This feature is a consequence of the functionality described above. It allows you to combine multiple launches into one.
Imagine that you ran tests and some of them fell due to infrastructure problems. Then you restarted the tests, again some part fell. In the end, you repaired your tests, and you want to see a report that shows that the tests you actually passed. Yes, the last time they fell, and there is some “red” information that some tests were broken.
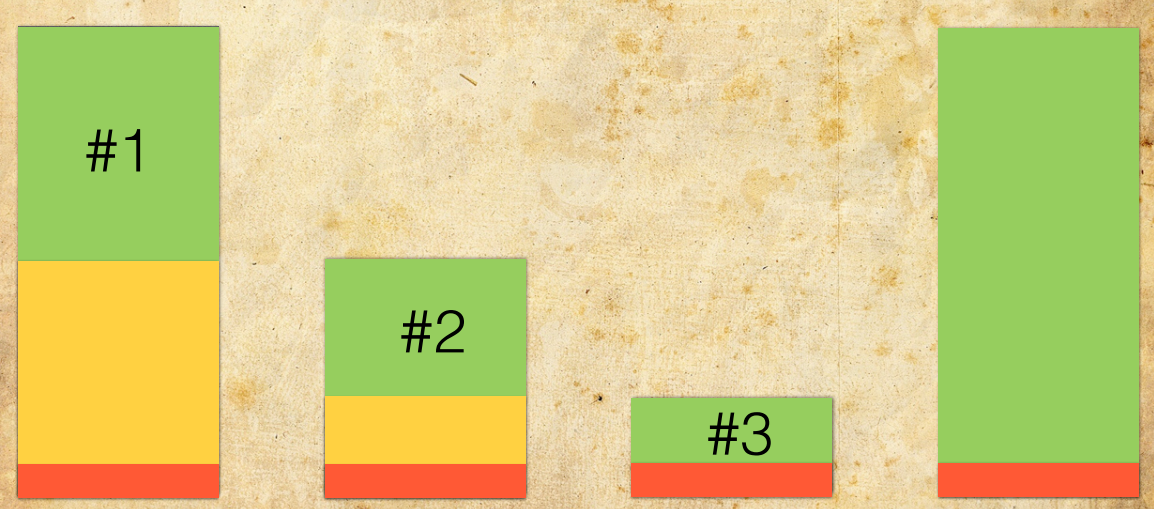
You can do this with one command:
$ allure generate \
#1 first-launch \
#2 second-launch \
#3 third-launch \
You do allure generate, give it three directories (first, second and third run), and it marks all the tests that were in retries, i.e. he glues together all the tests that were run, takes the last time result (maybe it is not green, but red), and he puts all the other tests into retries.
This mechanism allows you to generate a summary report based on several starts or restarts.
Error categories
I really like this feature, because it allows you to parse and analyze reports much faster.
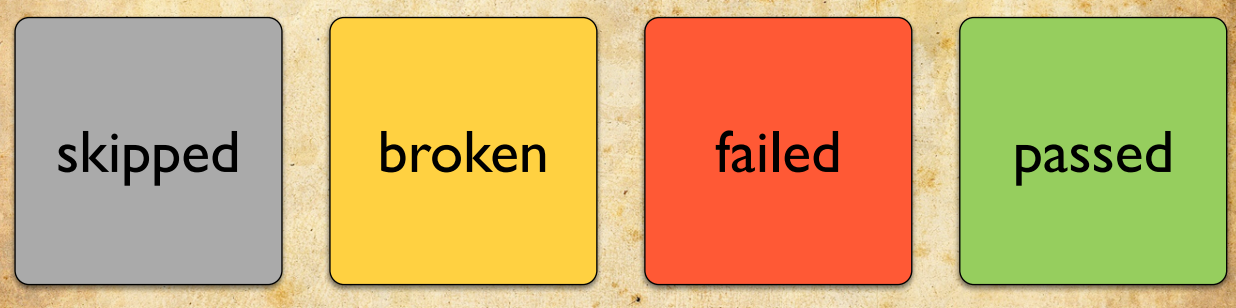
As you know, Allure has 4 completion statuses:
This:
- skipped
- broken
- failed (problem detected);
- passed (test passed).
We were often asked to add additional statuses, for example, “error creating user for testing” or “Selenium error”, “problem with selectors” and so on. We decided not to expand the number of statuses, but to add some orthogonal concept - a category of errors.
To use categories, you need to prepare a configuration file called categories.json. This file contains information about the categories of errors that you will use:
[
{
"name": "Устаревшие тесты (селекторы)",
"messageRegex": ".*Unable to locate element.*",
"matchedStatuses": ["broken"]
},
{
"name": "Проблемы в кластере браузеров",
"messageRegex": ".*Timed out .* from renderer.*",
"matchedStatuses": ["broken"]
}
]
For example, you create a category called “obsolete tests” - these are outdated tests that need to be fixed. All errors that satisfy the pattern will be added to it (in our case, if the element is not found on the page), selectors will definitely need to be edited here. After that we say that all tests with the broken status should be included here.
We can also track down problems in the cluster of browsers and put the timeout there.
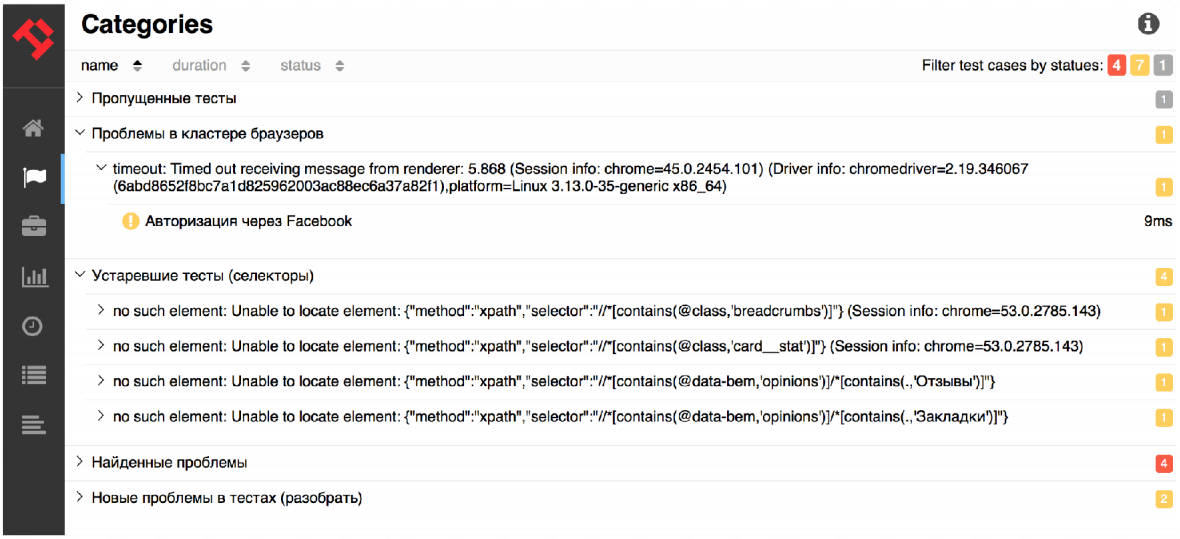
After you generate the report, you will have a new tab.
Previously, this tab was called Defects, that is, there was information about product defects and tests. Now more data is appearing there, in particular, information about our categories: “Problems in the cluster of browsers” - one problem, “Outdated tests” - the second problem. Then the problems found and new problems in the tests that need to be disassembled. Thus, after running your tests, you can quickly figure out what really happened in the tests and for what reason they fell using this tab.
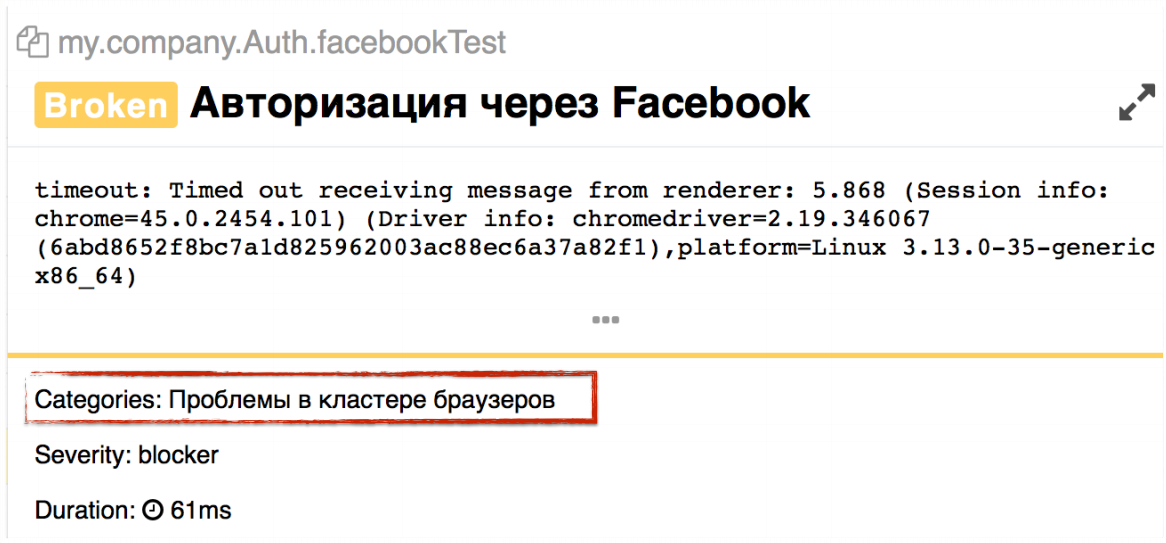
The error category is displayed in each test.
You can see a new block showing which category of errors this test belongs to. There may be several such categories - the test may fall due to several problems, respectively, you will have several categories here.
We have just started working on the categories of errors, and we have a lot of plans where we can develop. In particular, I really want to add categorization to BDD and suites. I would like to understand something like this: we did not check the authorization, because everything fell on Selenium problems, we also did not check the creation of the client, because we do not have a contract created. That is, we want us to operate with additional data in the report. So that we are not limited to information such as “some feature does not work” for 5 test cases, but understand that it does not specifically work in this functionality. The second thing I want to understand is some statistics by category. It’s very interesting to come to your infrastructure support team and say: “I have 20% of the tests constantly falling due to Selenium errors. Let's do something about it. ” We will work on this,
Test history
The most interesting point that we were asked a lot about is the test history.
Ordered - get it. Test history is now officially maintained by Allure through communication with the CI server, which is the data source. Jenkins, TeamCity and Bamboo are now supported. You can also easily adapt your framework and make generation through Allure.
It is very important to understand that this all works out of the box. Allure has not acquired a database; it is still the same simple, easy and reliable tool. It essentially generates a static report, but just during generation it pulls up data from CI servers about when which tests were run.
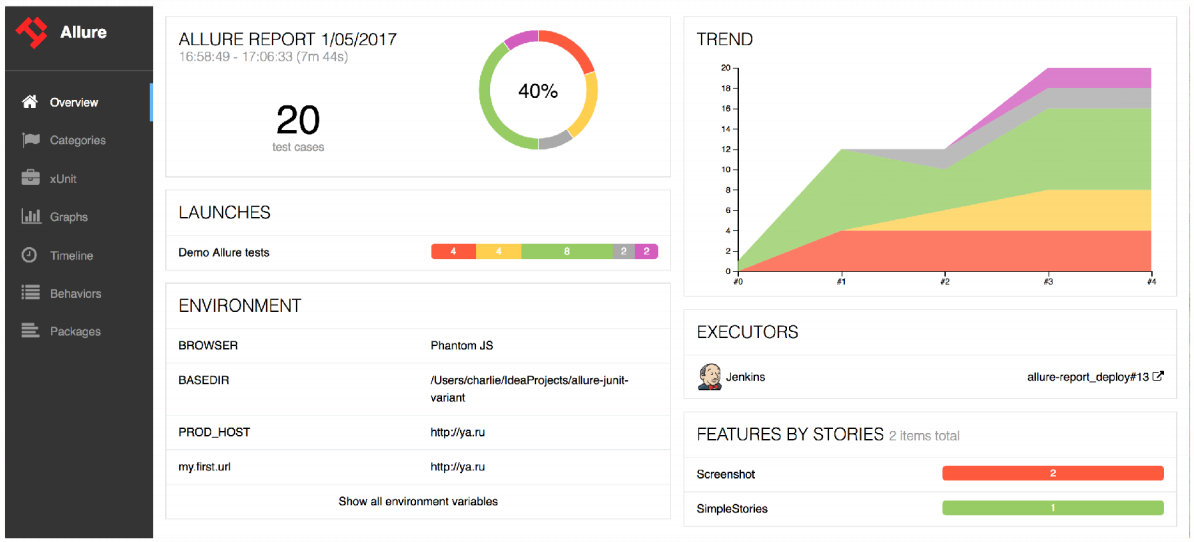
The first thing you will see when you use Allure 2 is trend information.
You will see a graph of the last 20 starts - when what tests were run. You can click on this chart, and you will switch to previous builds.
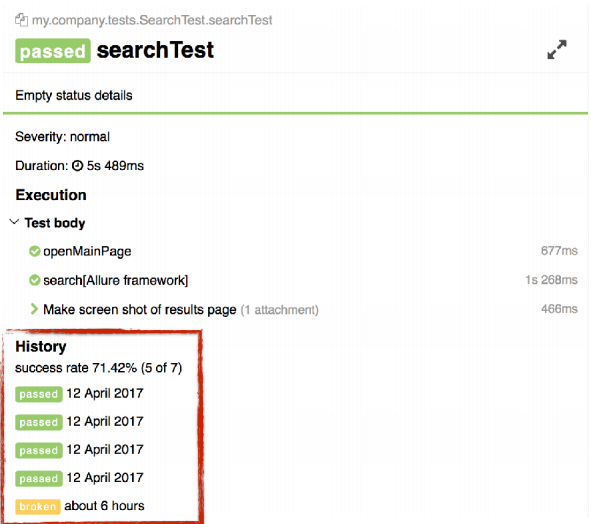
The story is also displayed on the test case page.
She looks like a Retries block now. The lines there are also clickable. If you click on the line, then go back to history to the previous build for a specific result.
You can easily switch and quickly analyze specific problems.
Stories are also just the beginning. In the future, I really want to work out the mechanism of precisely new tests: “how many tests were added this week”, “and if for people - how many tests were added by one tester, how many tests were added by the second tester”, “and how stable we have new tests - which new ones tests success rate indicators "and so on. We will move in this direction - in Allure there will be information about new tests, what problems are in these tests.
In addition, I want to work out the issue on the basis of historical data about known problems. I would like to immediately show that such a problem has already been encountered, where it has been encountered, and so on. And this will also be done on the basis of historical data.
Data export
Another feature that itself suggested itself was data export. It is now supported as such, i.e. There is a possibility to export data, but features with data export are not yet ready. Nevertheless, I really want to talk about them.
The first feature is a summary report.
Allure has long been asking for a report that can be sent by e-mail. This is especially true for any CI-server when you have passed the tests, and CI can simply say: "You had some problems in the build." We will generate some consolidated report, which can be attached to the build and sent by mail.
In addition, I want to do some export of summary statistics in CSV and PDF formats. You can print Allure to transfer to a friend or customer so that he does not have to click on the report.
This is the end of the talk about the big features of Allure. We began to collect data for the report from various sources and will continue to develop in this direction.
How to customize?
Now I want to talk about how you can customize Allure for yourself. It’s not just called a framework. You should be able to add something to it.
Allure has a pretty good extension system, in my opinion. Extensions are written using Java and JavaScript (Allure itself is written in Java and JavaScript - the muzzle is written in JavaScript and the kernel in Java).
Screenshot comparison
As an example, let's write a small extension that will help to display a comparison of screenshots directly on the test case page, i.e. will add an additional block there. I think that every tester who deals with the web interface has faced such a problem. By comparing screenshots, you can quickly roll up the initial tests for the functionality of the service. You take a screenshot of the elements in testing, take a screenshot of the elements in production and check the Diff, which will look like this:
So you very quickly have a large set of tests.
Screenshots used to be added as attachments. To reach them, you had to first open the test case, then the test, then go to execution, click on the screenshot link and then it will be displayed.
Now it is possible to add blocks directly in the test execution script - directly on the main page.
How to make such an extension?
First, we use gradle as a project build system.
I won’t talk more about the insides, I want to concentrate on the extension itself. To do this, we need to write a piece of JavaScript that simply sticks the necessary information into execution.
First, we will make a function that renders image.
function renderImage(src) {
return '' +
' ' +
'';
}
}
//Backbone.Marionette.View
var ScreenDiffView = View.extend({ … })
allure.api.addTestcaseBlock(
ScreenDiffView,
{position: ‘before'}
);
' +
'';
}
}
//Backbone.Marionette.View
var ScreenDiffView = View.extend({ … })
allure.api.addTestcaseBlock(
ScreenDiffView,
{position: ‘before'}
);
After that we extend Marionette.View to them, that is, we will make such an additional extension in which you can add JavaScript logic. For example, press the button - it shows production, press the button - it shows the test, press the button - it shows Diff. After that, we call the Allure API and add the block directly to the test result. As a result, you will display it directly on the main page.
Native format
The second extension I want to talk about is support for its format. It happens that you have all the necessary information in the framework - about starting a test, all features, actions, and so on. And you don’t want to connect some of our adapter or, for example, the necessary adapter does not exist. In this case, if you already have the results, you can simply read them out, at the time of building the report, converting them into Allure results. That is, you can, in principle, pass the stage of connecting the adapter. This will be useful, for example, to read out already standard formats. Here TeamCity supports the format mst, testng and so on. After some time, Allure will support these formats by default, i.e. we can generate a report without connecting an adapter. This report will be minimalistic, but for people
What does this extension look like?
There is no JavaScript in this extension, this is purely Java logic: we need to read the results, after which we convert them to Allure. We are interested in the Java part:
To support its own format, there is an interface called Reader.
interface Reader extends Extension {
     void readResults(
          Configuration configuration,
          ResultsVisitor visitor,
          Path resultsDirectory);
     //your code here
}
The configuration is fed to the input (here you will find the entire confederation regarding Allure), then you get some Visitor to the input. It allows you to add new tests to the Allure Report. And the last one is the directory that we will analyze.
As we write the new extension:
class CustomReader implements Reader {
     void readResults(config, visitor, results){
          listFiles(directory).stream()
          .map(this::readFileToCustomResult)
          .map(this::convertToAllureTestResult)
         .forEach(visitor::visitTestResult);
      }
}
First we read all the files from this directory. Then we put all these files into some kind of your object. After that, we convert your data structure to Allure Results and add them to Visitor. In principle, there’s nothing complicated - you just need to convert your format to Allure Results.
With these extensions, you can support your frameworks, which can no longer creep into. For example, if there are no listeners.
Custom tree
As you know, Allure has the first categorization - by test cases (i.e. you see the package, and it has a specific test case), and the second categorization - by feature story (first, all tests are grouped by features, then all tests are grouped by story).
To make an arbitrary tree, you need to perform 2 points:
- generate the data structure itself, i.e. some JSON in which you will have information about the assembled tree;
- embed this tree in Allure reports, i.e. make some kind of implementation directly into the web-interface.
Let's analyze the structure of the solution in order.
Let's start with the Java part. To collect information on test categories, it is necessary to extend abstract or agregator. He needs to implement the name of the file, in which you will have information about the categories, and a list of categories. That is, first we collect information on the component, after that - modulo.
class CustomTab extends AbstractTreeAggregator {
     @Override
     protected String getFileName() {
          return "custom.json";
     }
     protected List getGroups() {
          return Arrays.asList({
              allByLabel(result, "component")
              allByLabel(result, "module")
         })
     }
}
Then this information should be displayed already in the Allure report itself.
var components = allure.components;
allure.api.addTab(‘custom', {
     title: ‘Custom’, icon: ‘fa fa-list’
     route: ‘custom/(:/testcaseId)’
     onEnter: (function(){
         var routeParams=…
         return new components.TreeLayout({
               routeParams: routeParams,
               tabName: ‘Custom’,
               baseUrl: ‘custom’
               url: ‘data/custom.json’
          })
      })});
To do this, we pull the Allure API, add a Tab called custom. We fill in the title, icon and route into it (i.e. all requests that will go to the custom ID will be sent to this tab).
Using standard Allure components, you draw a new tree. You can add arbitrary information, in particular, new graphs or widgets. For this we have a library of components that you can use at home.
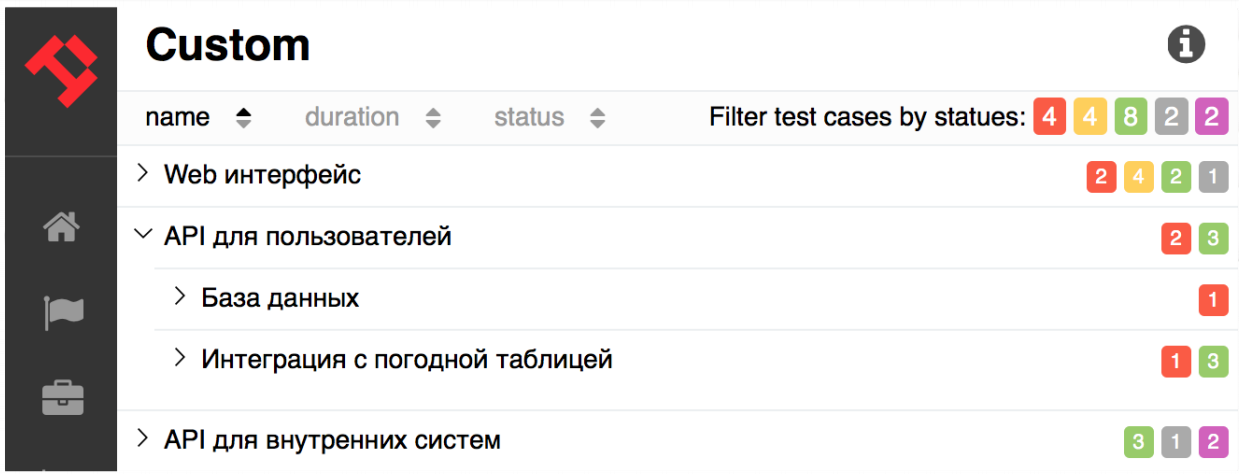
After starting Allure and connecting the extension, a custom tab will appear, in which the grouping according to your settings will be implemented.
This solution is suitable for companies that already have some kind of test structuring, for example, that came from the past (for example, you are not using or want to use feature story yet).
Extension Distribution
Now the distribution of such extensions is not yet ready. There is no mechanism through which you can select a new extension and load it into Allure (extension market). Nevertheless, we are working on this and hope that after some time we will have a set of extensions, and we will be able to flexibly load them into Allure. That is, you can directly specify in the configuration that I need this and this extension. I would like to see as much new functionality as possible in Allure.
Extension system
I tried to fit almost every extension onto one slide. It’s clear that in reality this is too cool - I skipped a lot of code because I wanted to show the possibilities. In fact, only fairly experienced users who can program in Java and in JavaScript, Backbone and so on can write the extension. In my opinion, it is not as simple as it seems. But you can try. If you have any ideas how to make any extensions that will be useful to the entire community, we will be happy to hear from you and write these extensions yourself. Send us your ideas about what information you can add to the report, to the repository.
How to migrate?
Let's talk about how to migrate to the new Allure and what migration is.
Allure is fully backward compatible. You can now download version 2.1.0, put it to yourself and build a report already according to current data. No need to change anything except the version of Allure Report itself.
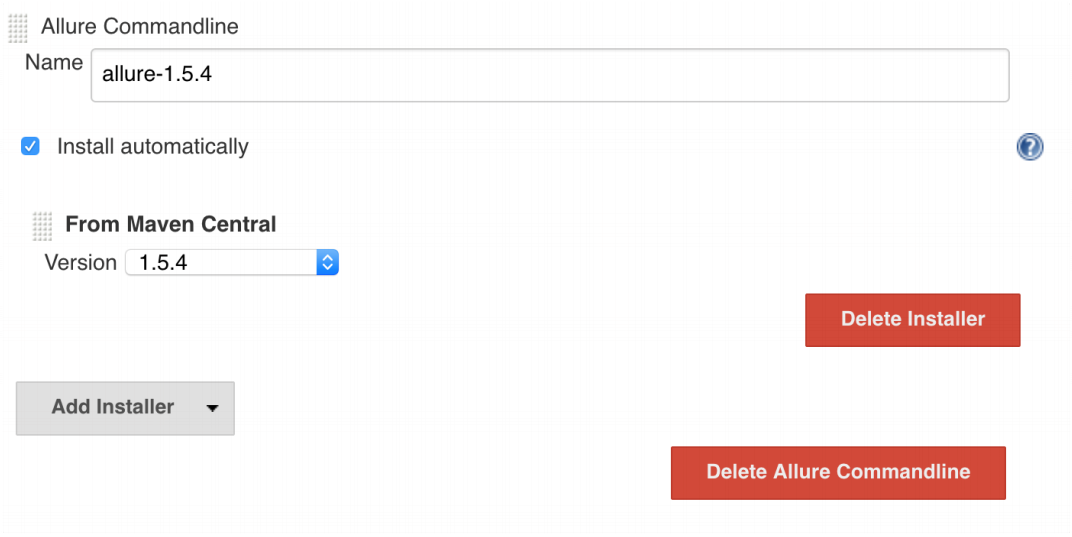
For example, you can do this for Jenkins like this:
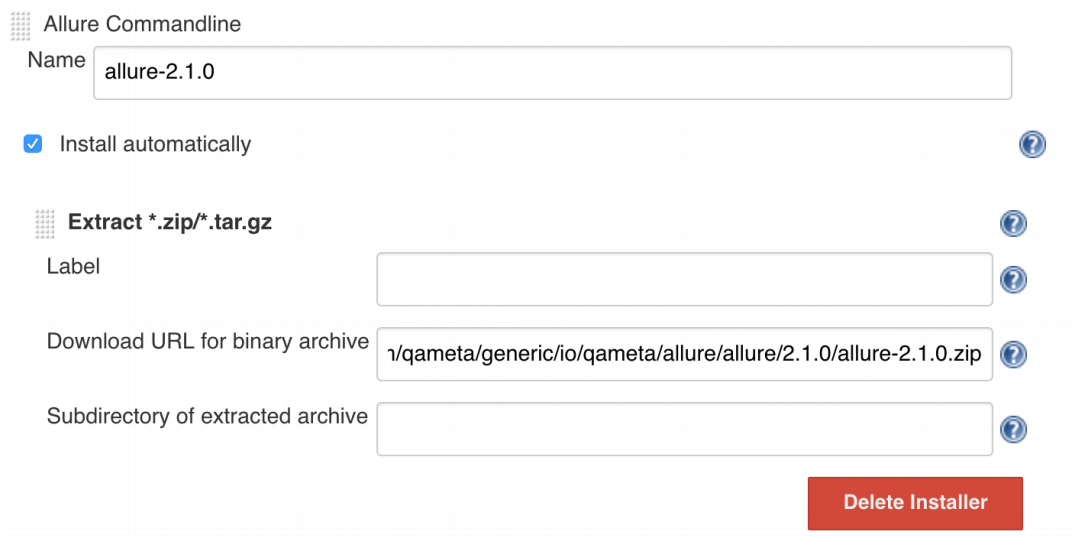
You had Allure 1.5.4 before. You pumped it out of Maven Central. You add a new tool - Allure 2.1.0, specify the URL (unfortunately, now there will be such a long URL - I already sent a request to Jenkins, and they should install it in the near future, then it will be available as before through the drop-down menu).
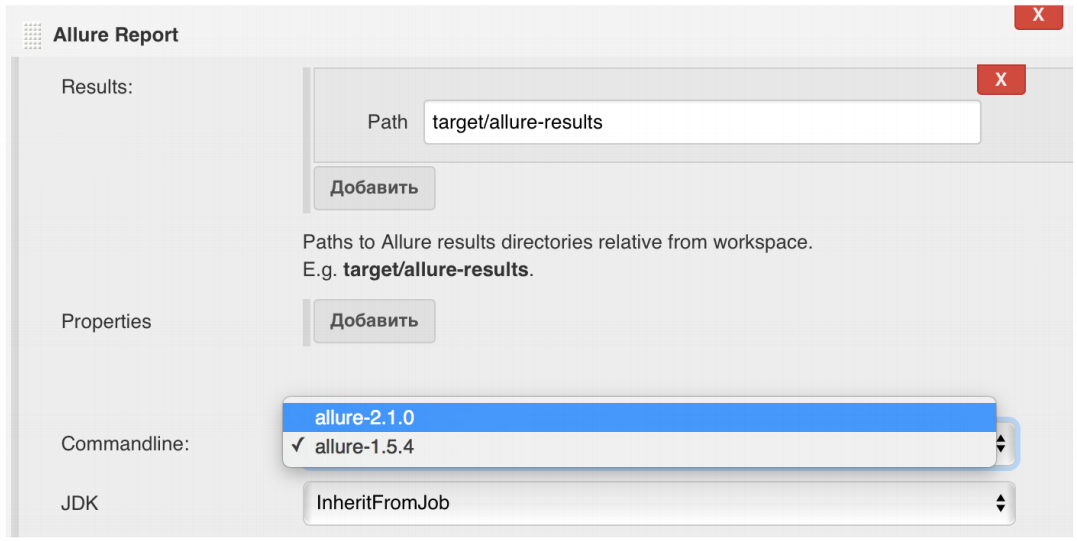
After adding a new URL, you configure some of your job, where you have the opportunity to switch from 1.5.4 to 2.1.0, and everything works.
At the same time, you immediately get the chips discussed above: restarts, consolidating reports, history, the ability to add new blocks to test cases, and so on.
Why then update the adapters?
We try to collect information from the tests as much as possible. For example, in the latest version, we begin to integrate more tightly with all sorts of standard solutions. The first thing we will do now is custom attachments for http samples, for http client, for retrofit, etc. If you use one of these technologies, you simply connect Allure retrofit to yourself, and you will immediately have detailed scripts with logs, requests and answers in Allure.
We will carry out further integration with ready-made frameworks and make bindings around them.
If you use Allure and want to keep abreast of the latest developments, join our community.
The first thing you can do is to follow us on Github . There are all the repositories and integrations that are in Allure. Come, subscribe to the integration you are interested in. And you will be aware of what is happening there.
If you have any kind of emergency problem, if you don’t understand what’s going on, visit us on Gitter: here and here . This is an online chat. We constantly in real time answer there all the questions. If you encounter any problem that you cannot quickly solve, and you need a quick solution, write to us there, we will respond to you promptly and help you figure it out.
Follow us on Twitter: eroshenkoam (I) and @QametaSoftware (twitter, where we will post about new versions of Allure, adapters, etc.).
If you want to click on some demo, I made a link . By clicking on it, you can find out what's new in Allure.
Artem Eroshenko is preparing an interesting new report specifically for the Heisenbag 2017 Moscow , which will be held in Moscow. The program is still being formed, but some key reports are already known . Detailed information on the event and conditions for participation are available on the conference website .