WebGL-wind and GPU programming. Lecture on FrontTalks 2018
To draw complex graphics on web pages, there is a Web Graphics Library, abbreviated WebGL. Interface developer Dmitry Vasilyev spoke about programming the GPU from the point of view of the layout designer, what WebGL is and how this technology solved the problem of visualizing large weather data.
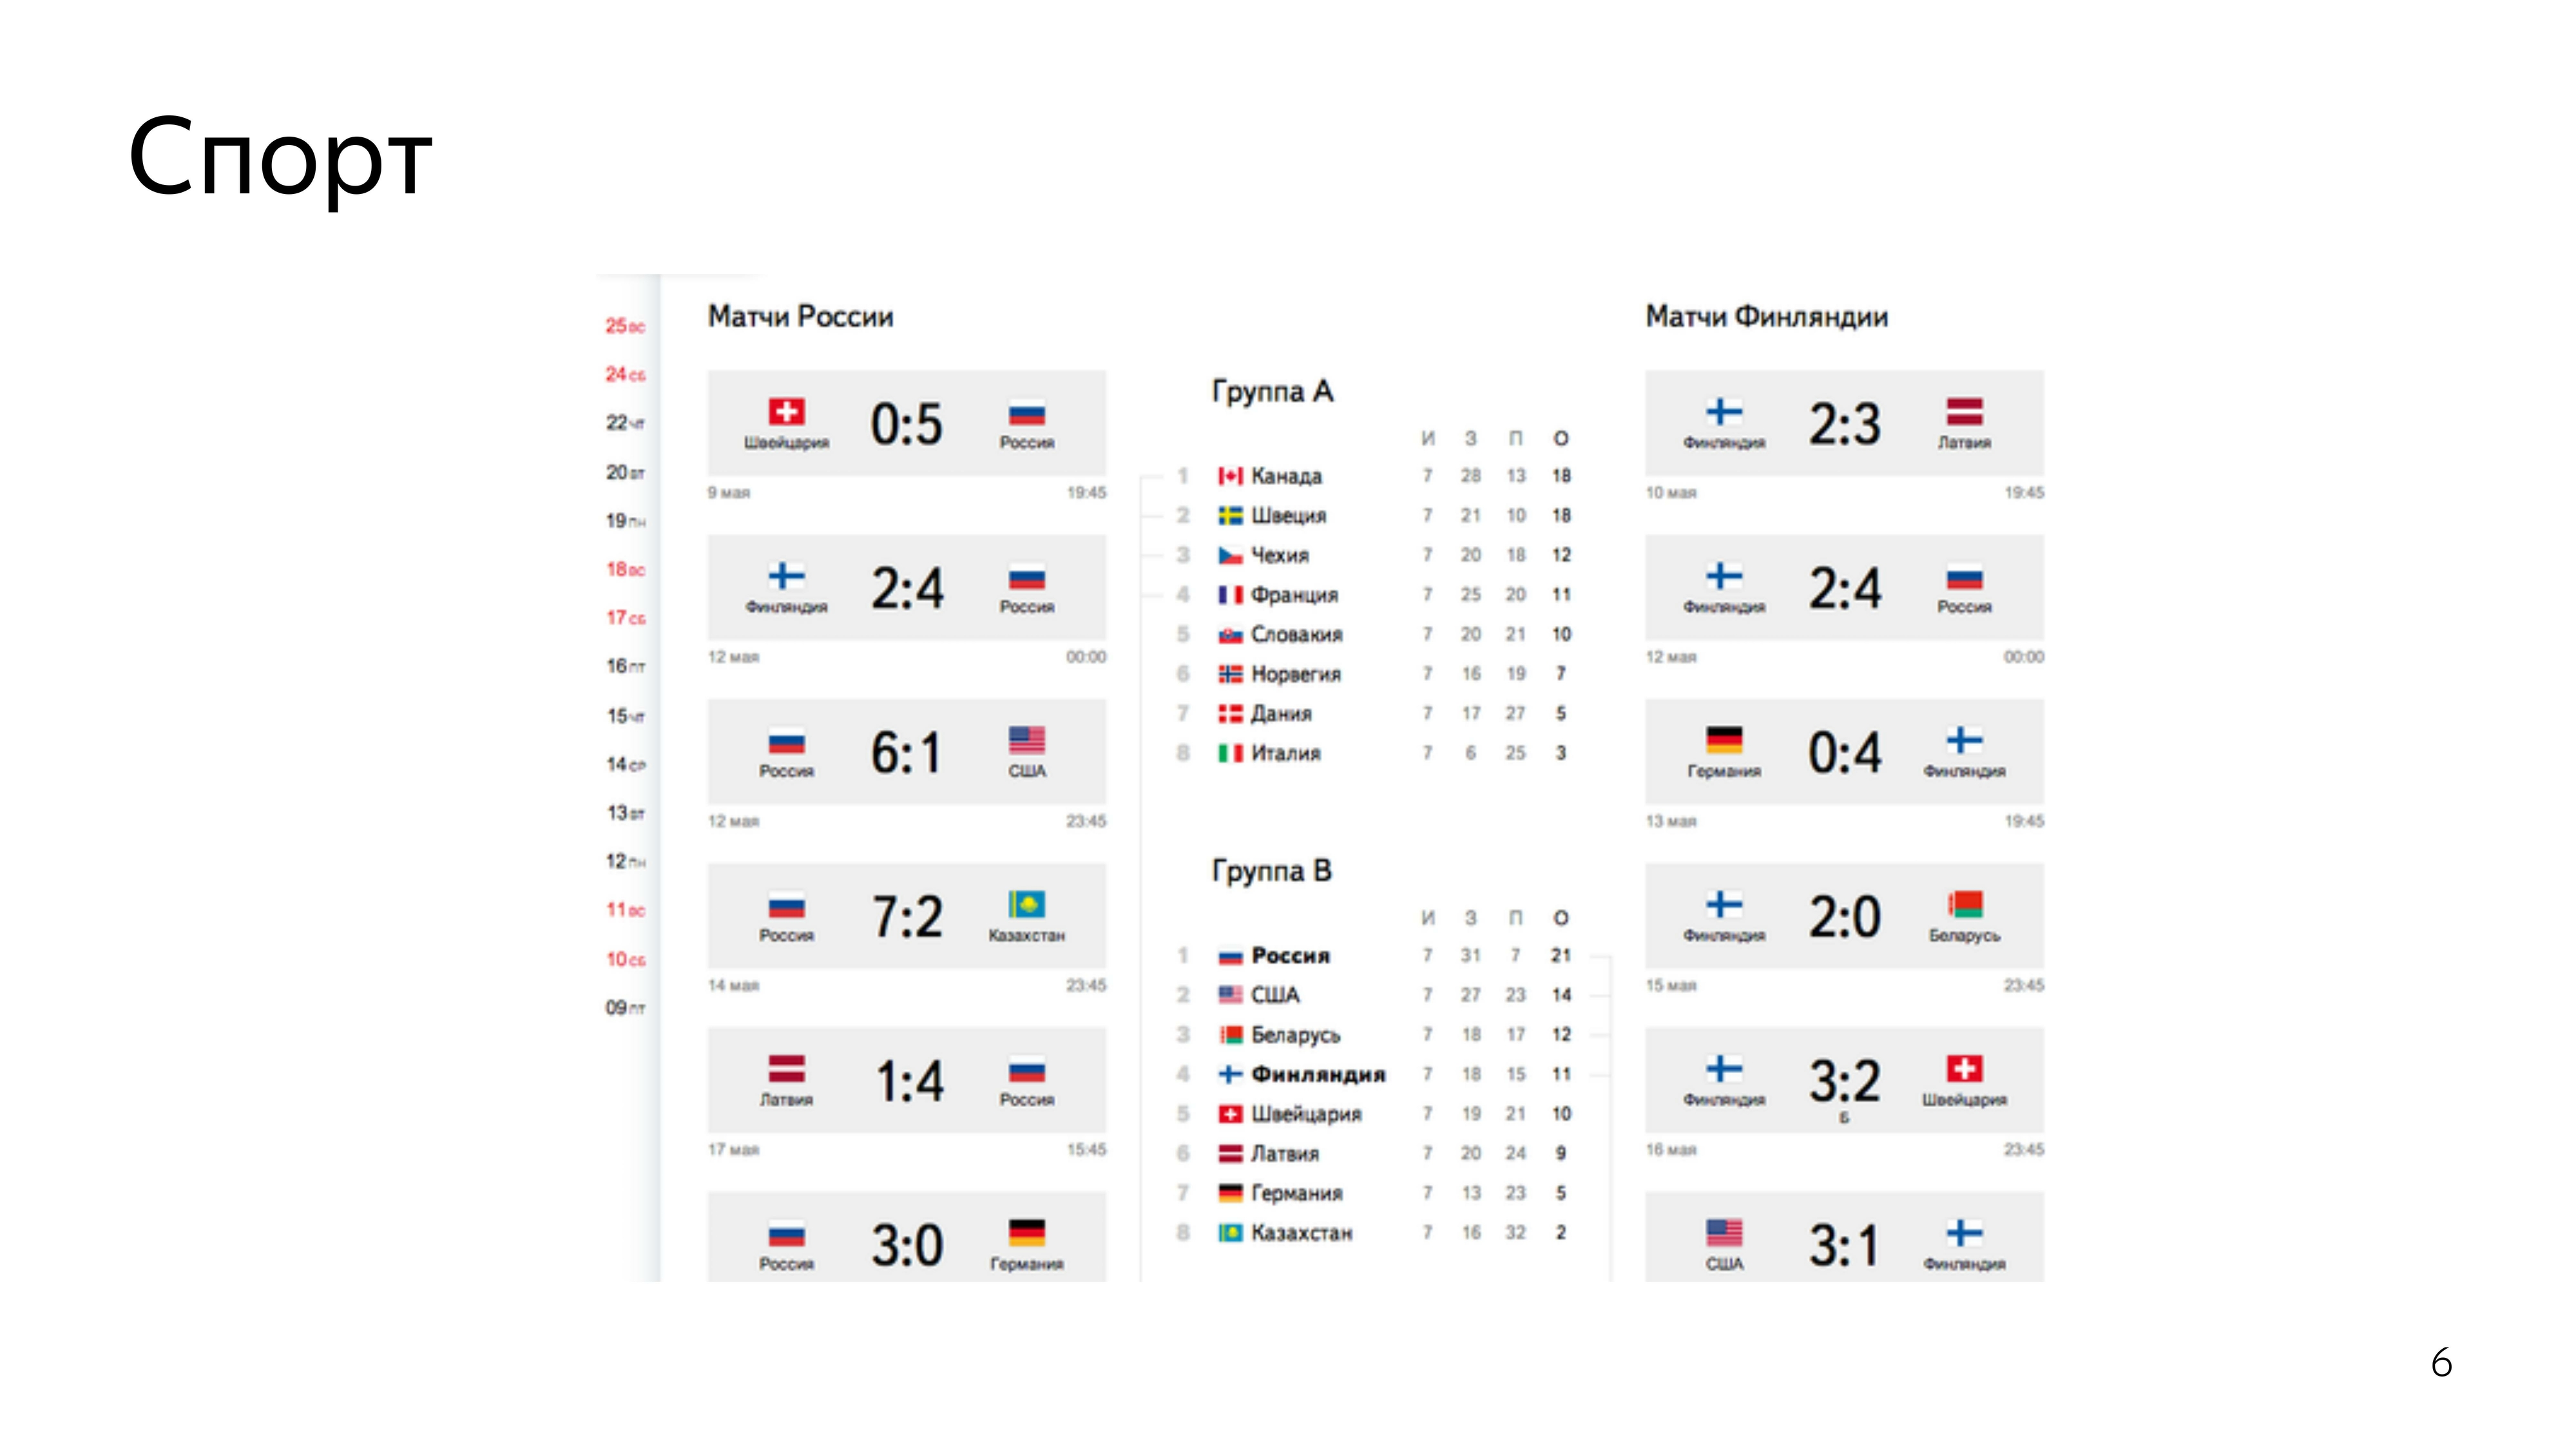
- I am developing interfaces in the Ekaterinburg office of Yandex. I started in the group Sport. We were developing sports special projects, when there were the World Championships in hockey, football, the Olympics, the Paralympics and other cool events. I also worked on the development of a special search results, which was dedicated to the new Sochi highway.


In addition, in one and a half helmets, we restarted the service Work on the bugs. And then work began in Weather, where I was engaged in supporting the API functionality, its development, writing the infrastructure around this API, and writing node binding to the trained machine learning formulas.
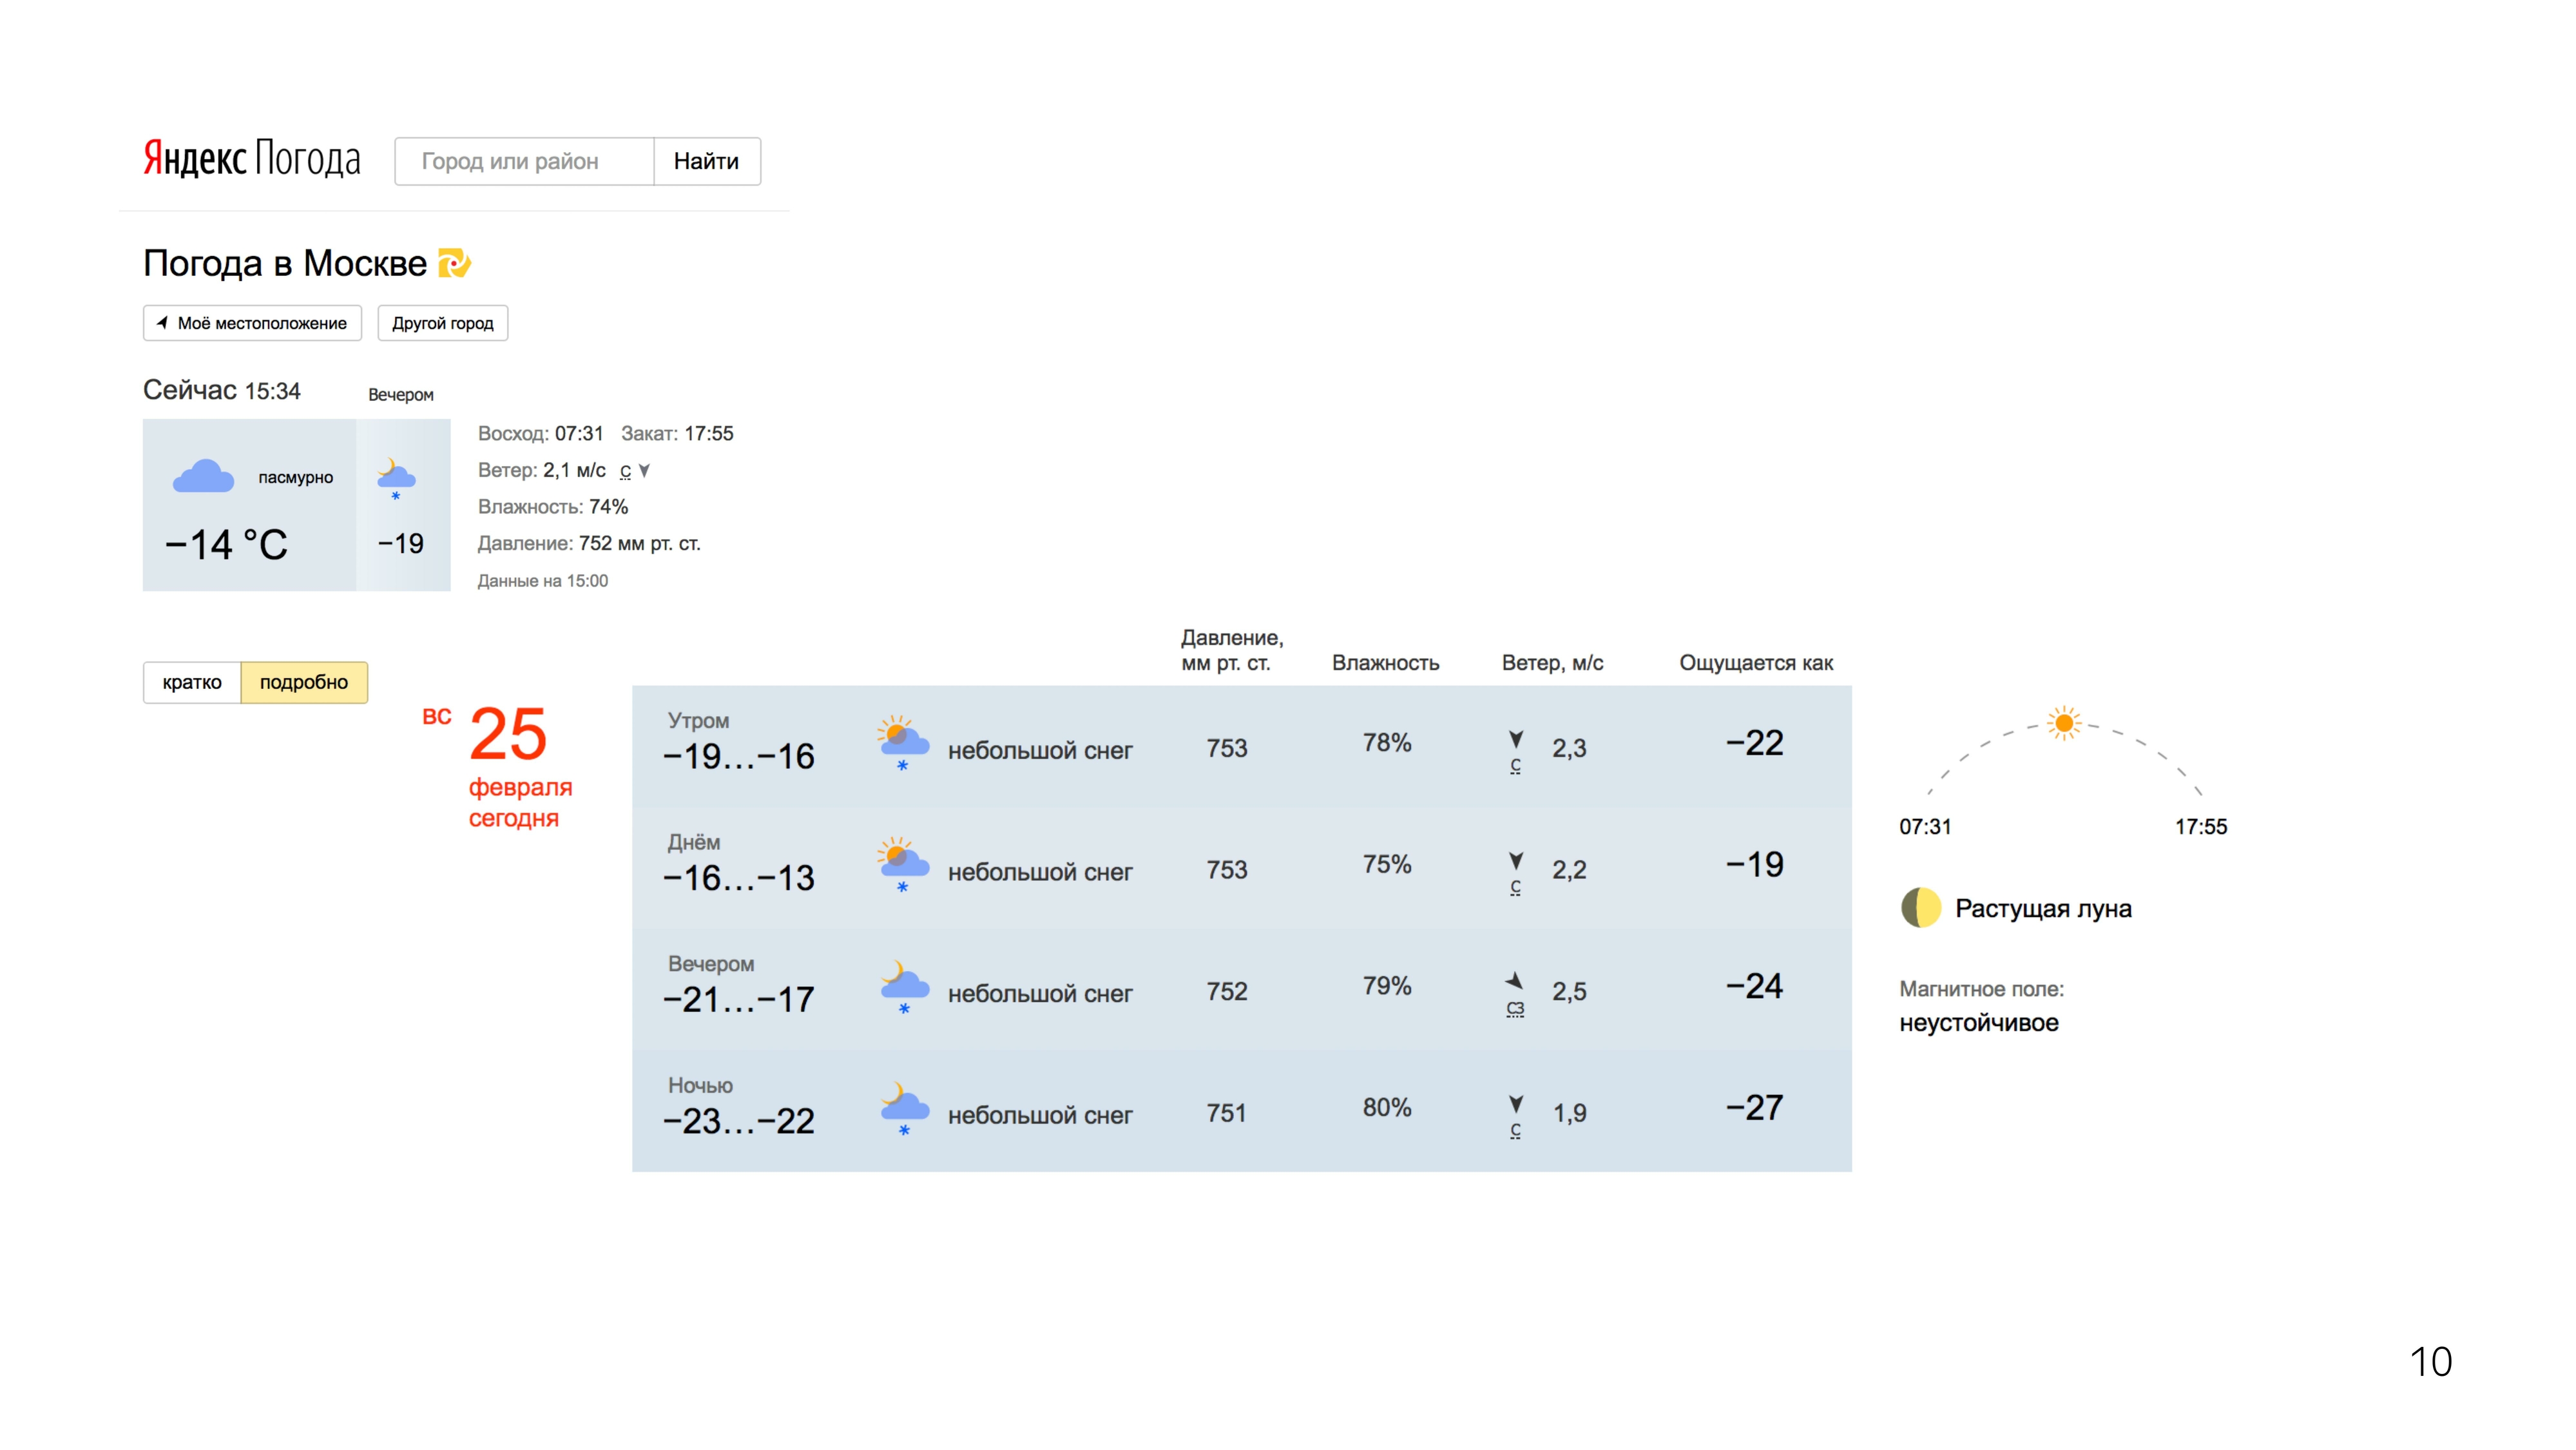
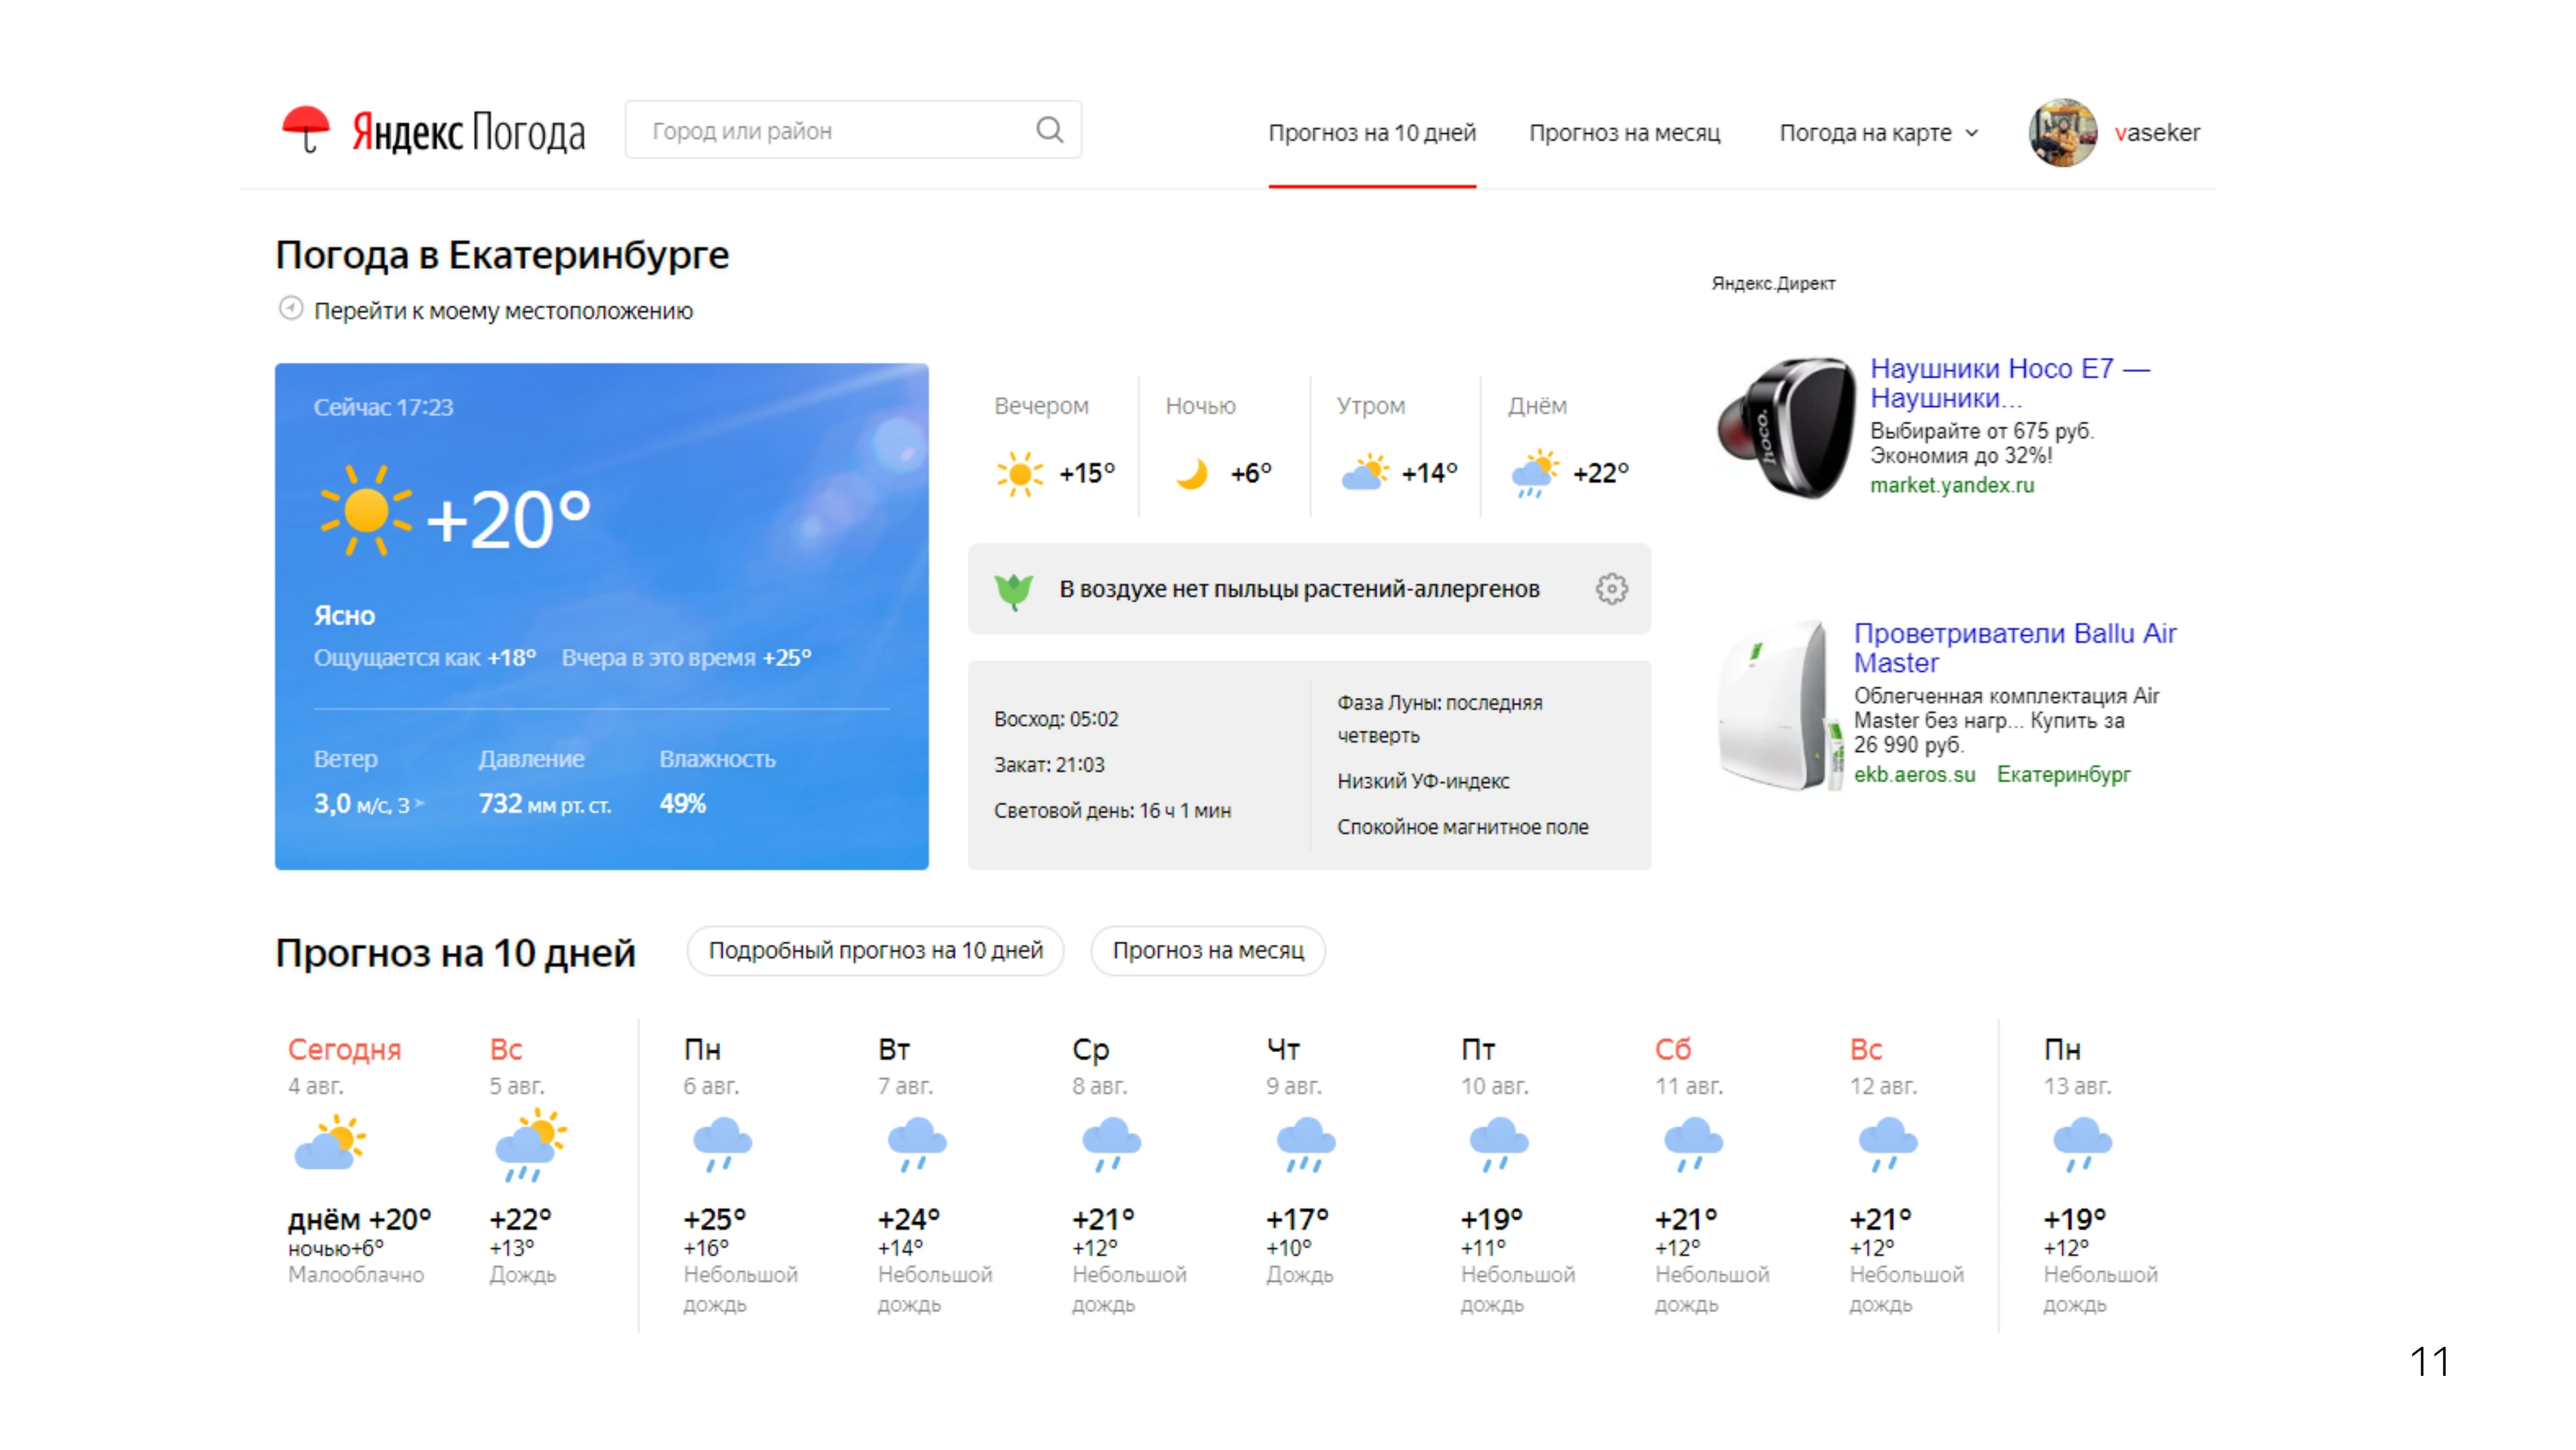
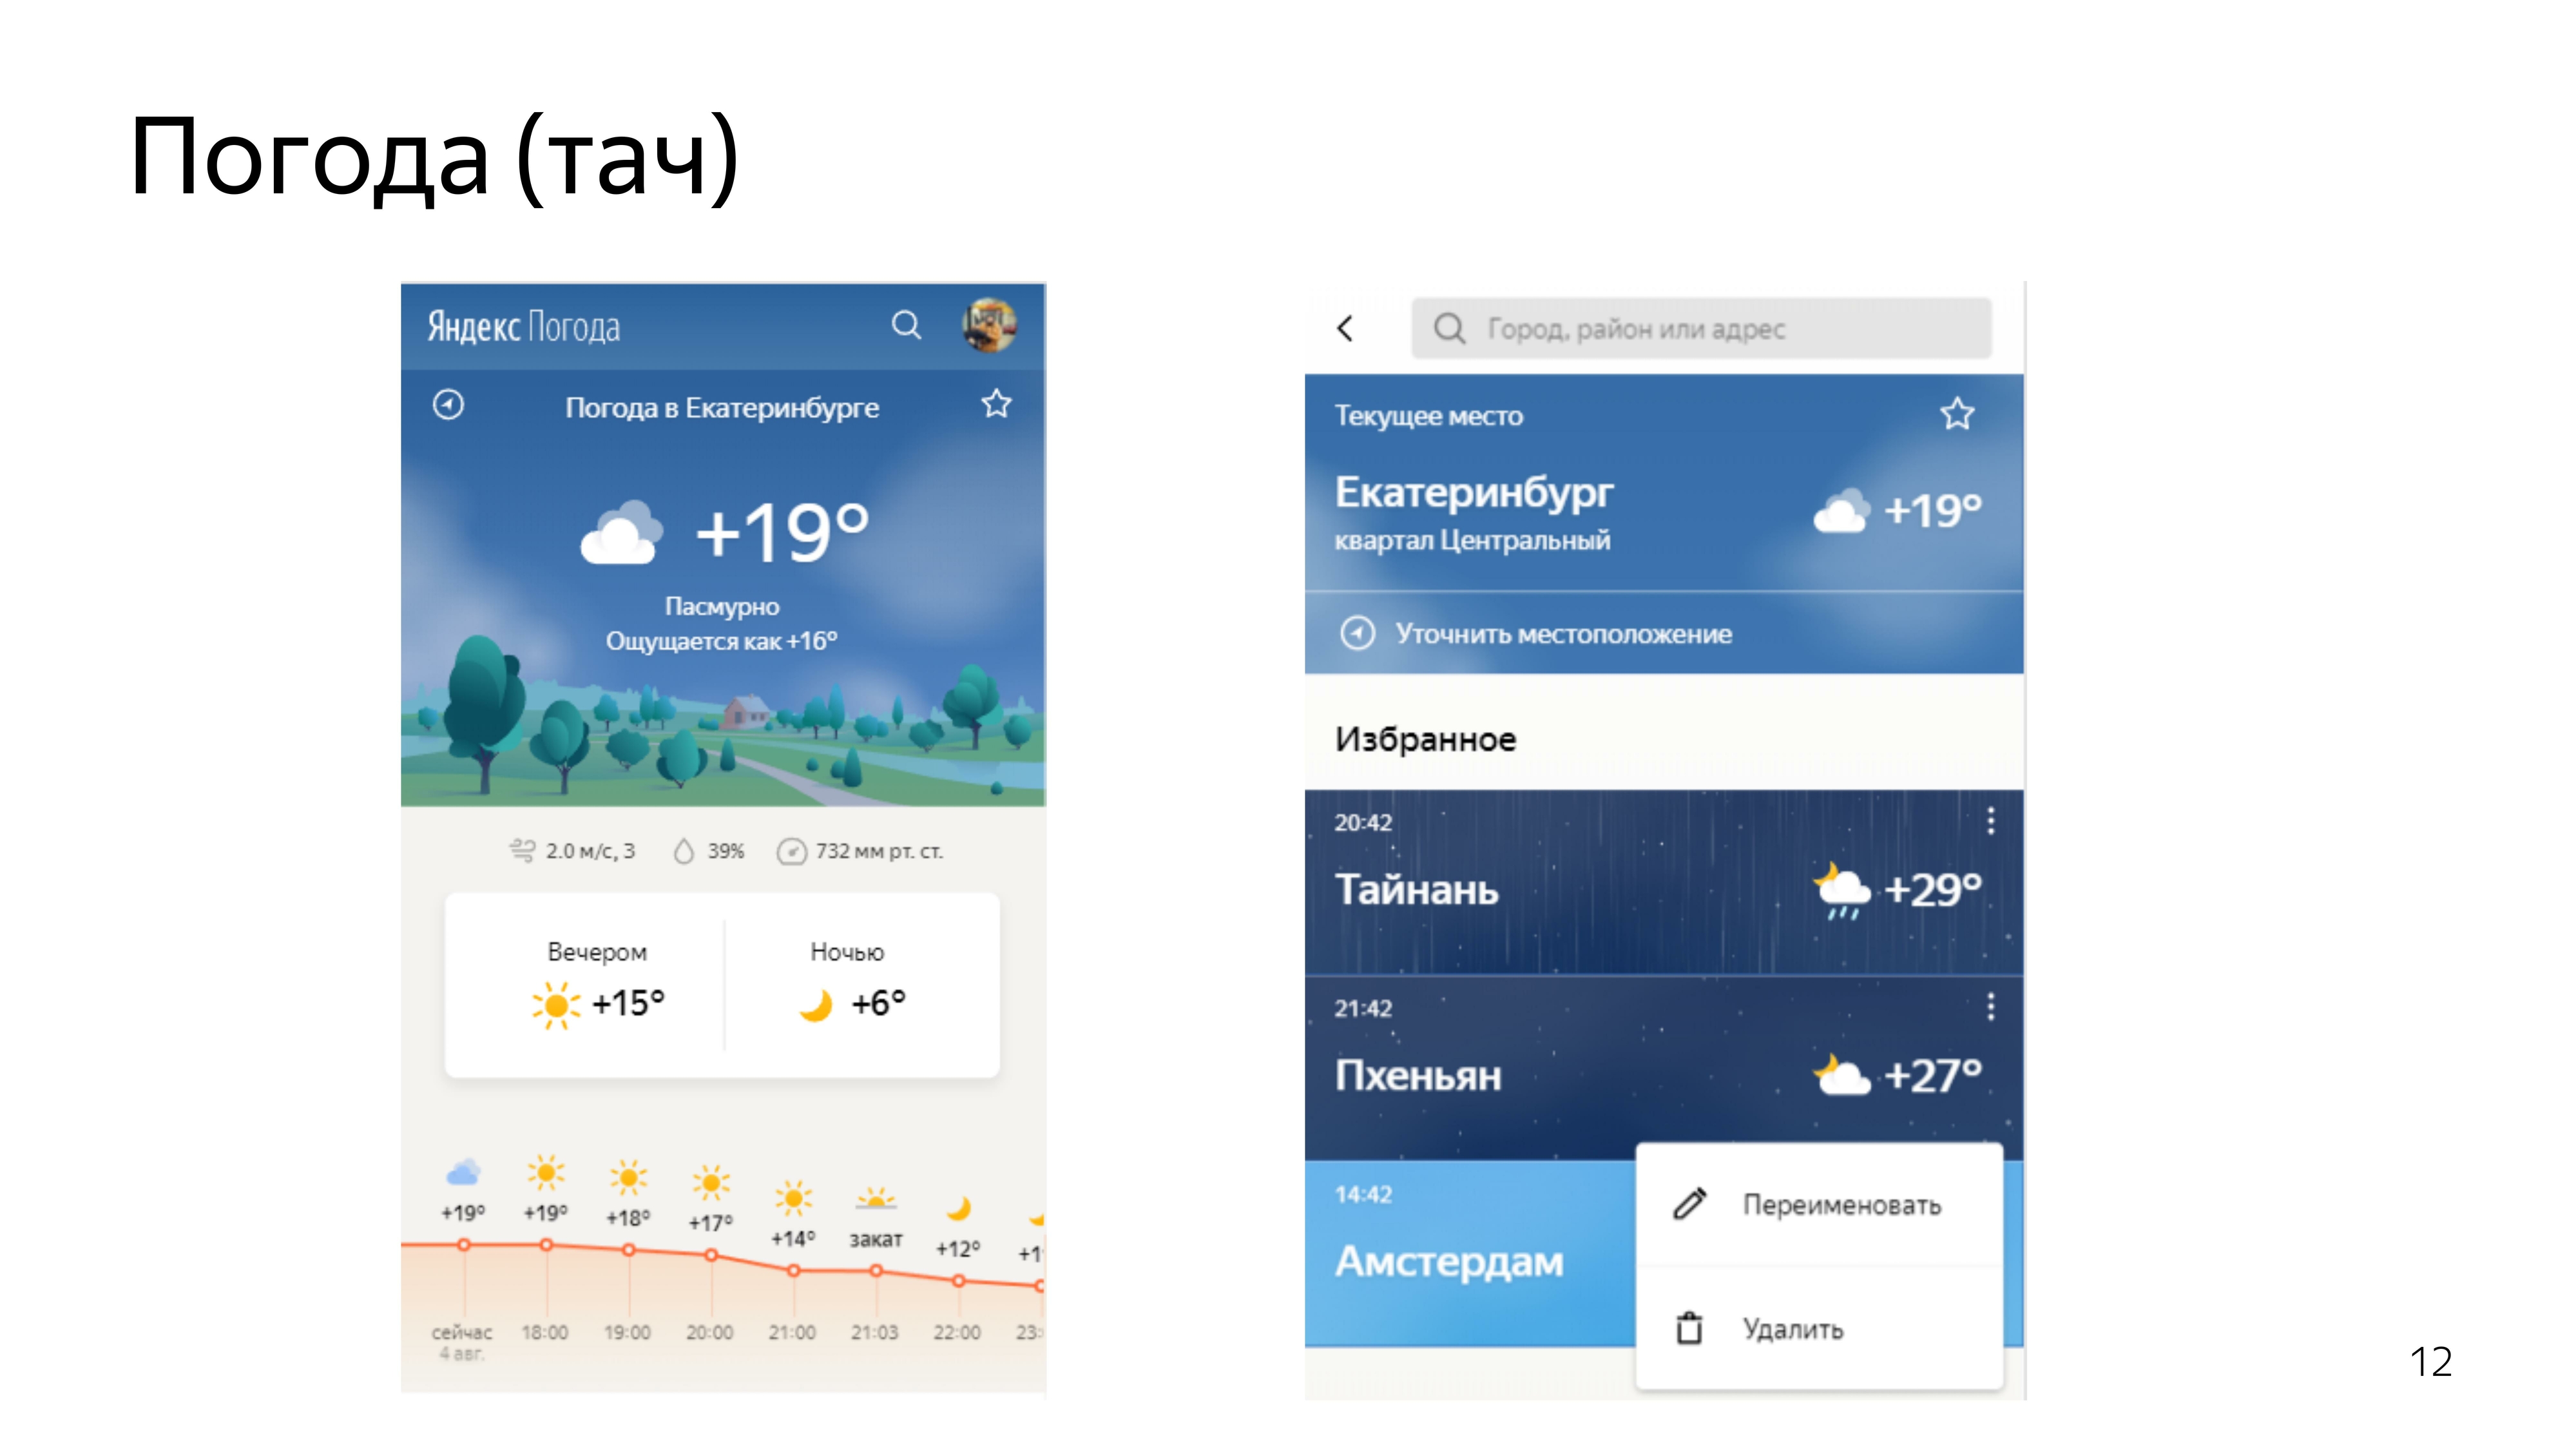
Then the work began more interesting. He participated in the redesign of our weather services. Desktop, tachi.
After we brought the standard projections in order, we decided to make one that no one has. This forecast was a forecast of the movement of precipitation in the territories.
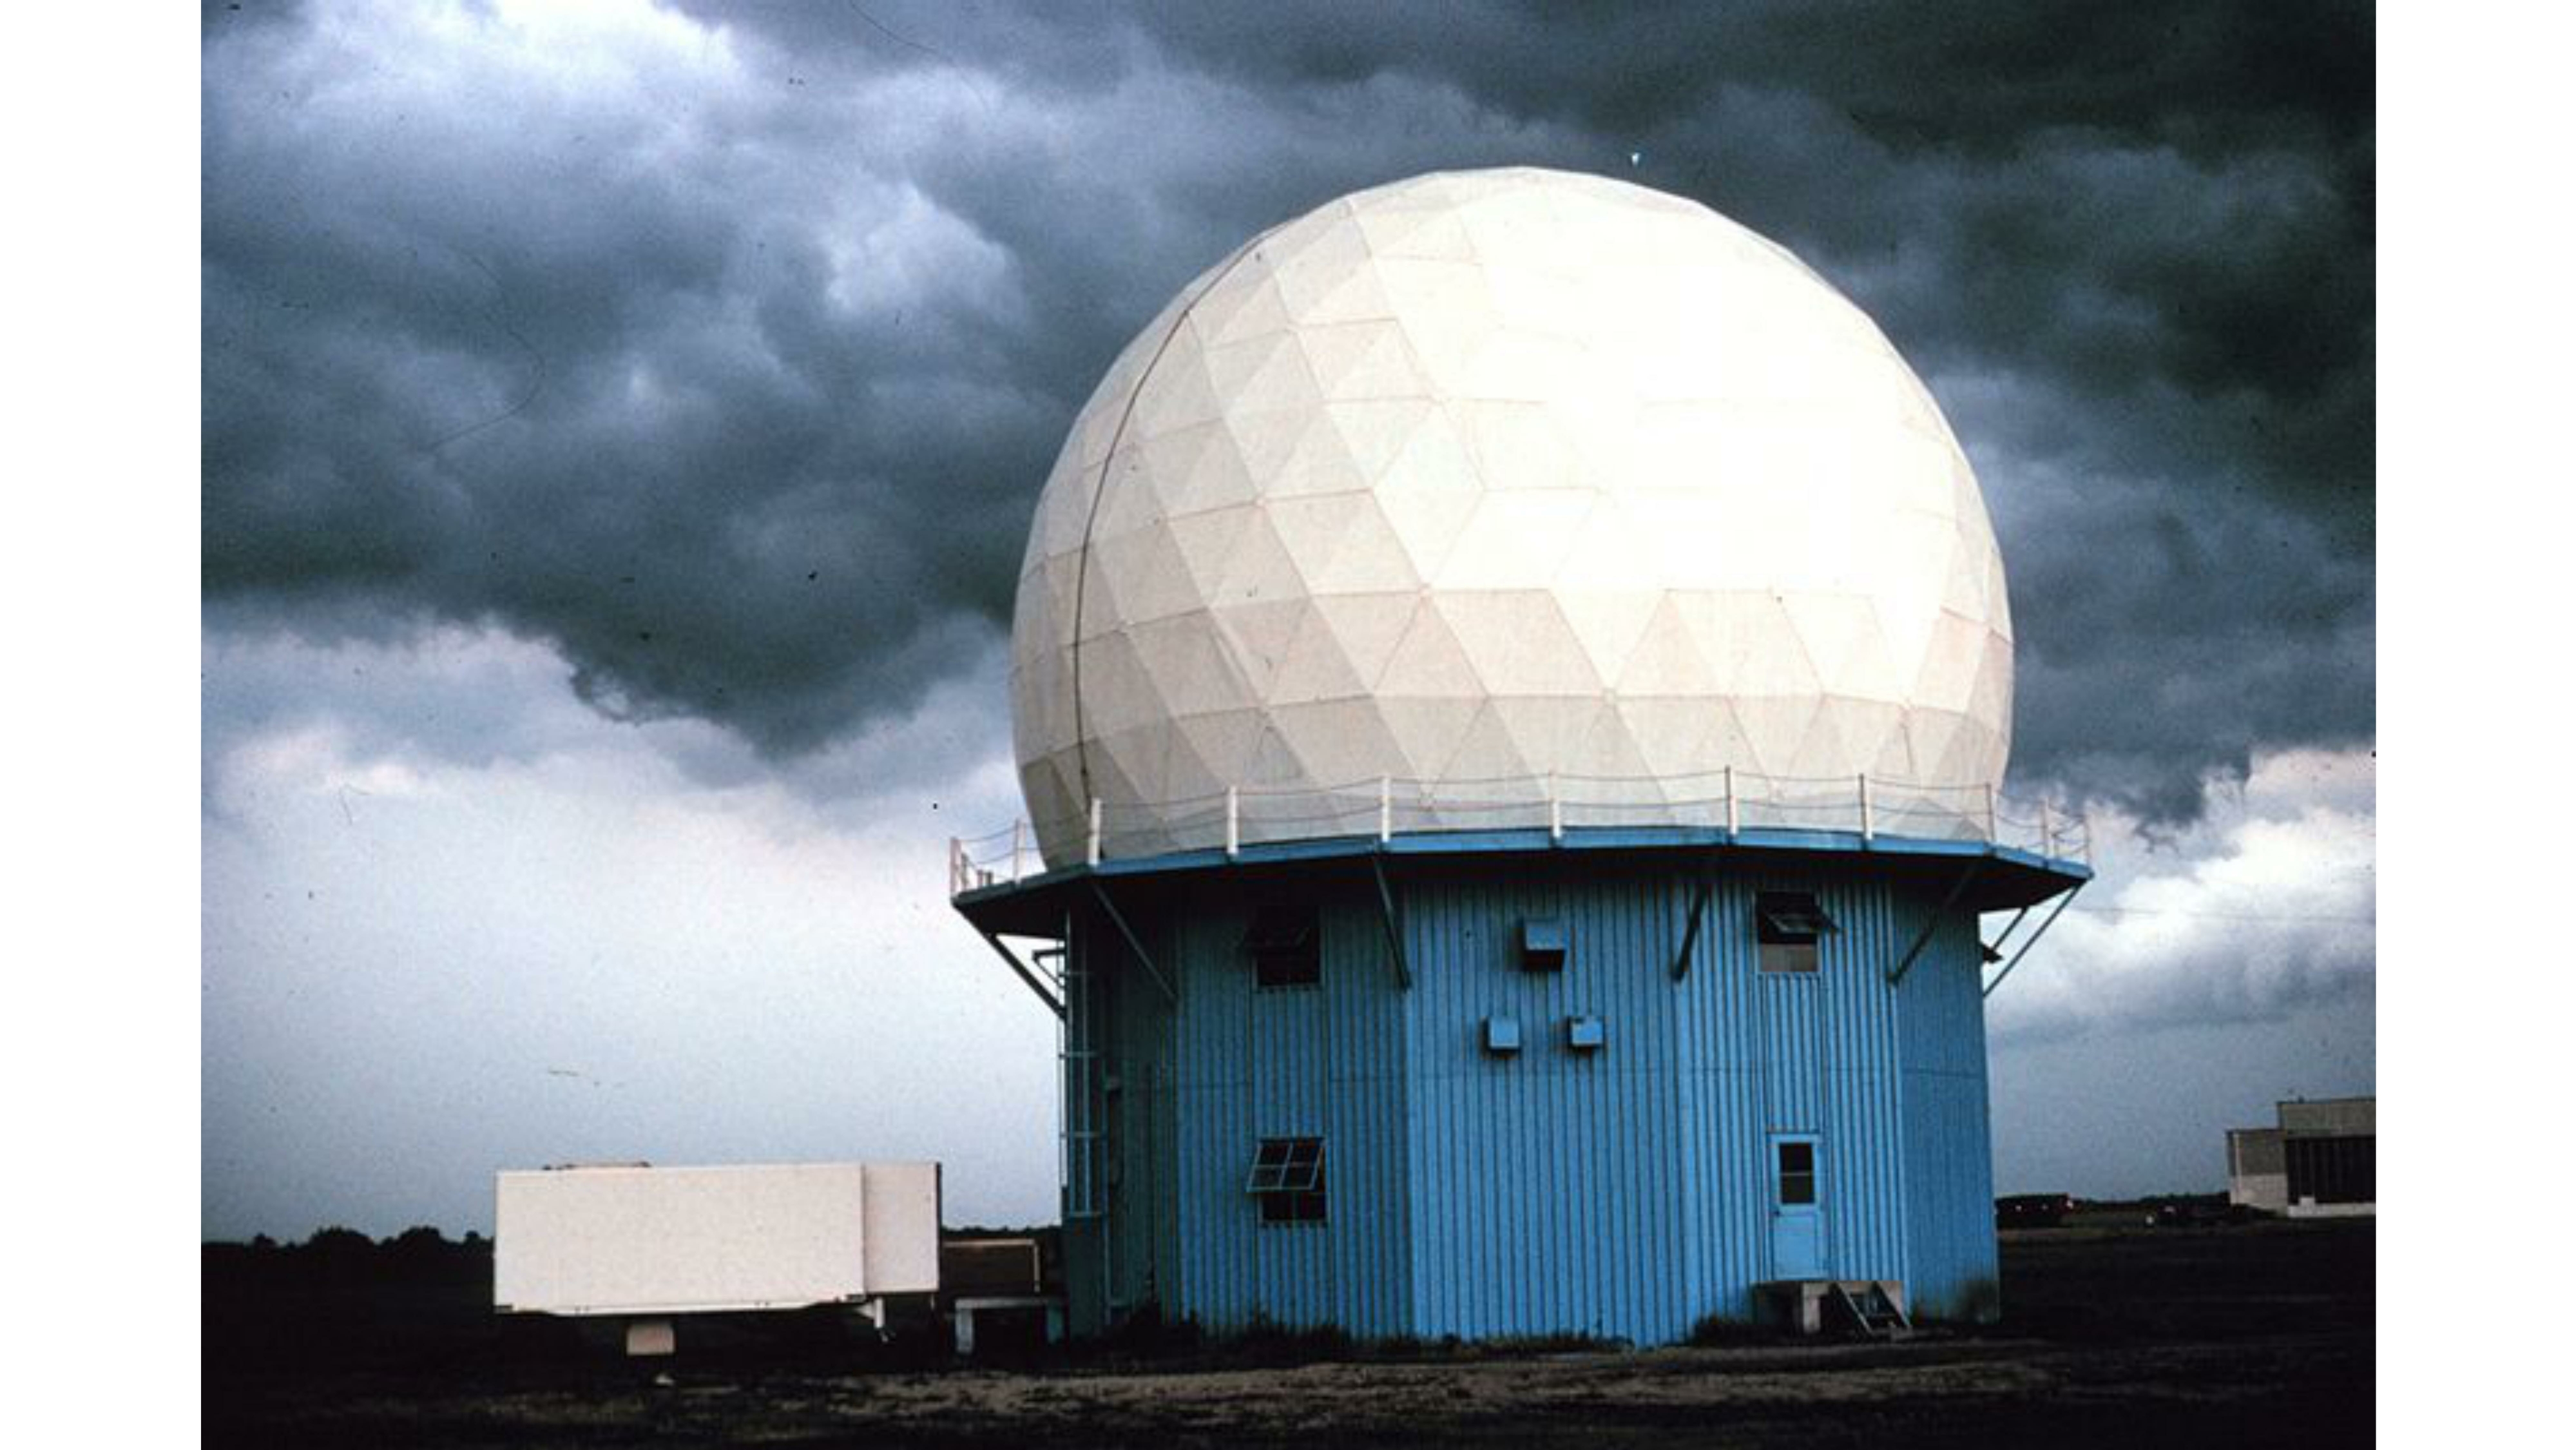
There are special meteorological radars that detect precipitation within a radius of 2,000 km, they know their density and distance to them.

Using this data and predicting their further movement using machine learning, we madesuch visualization on the map. You can move back and forth.

We looked at the reviews of people. People liked it. All kinds of memesics began to appear, and there were cool pictures when Moscow was flooded.
Since everyone liked the format, we decided to move on and devote the next forecast to the wind.
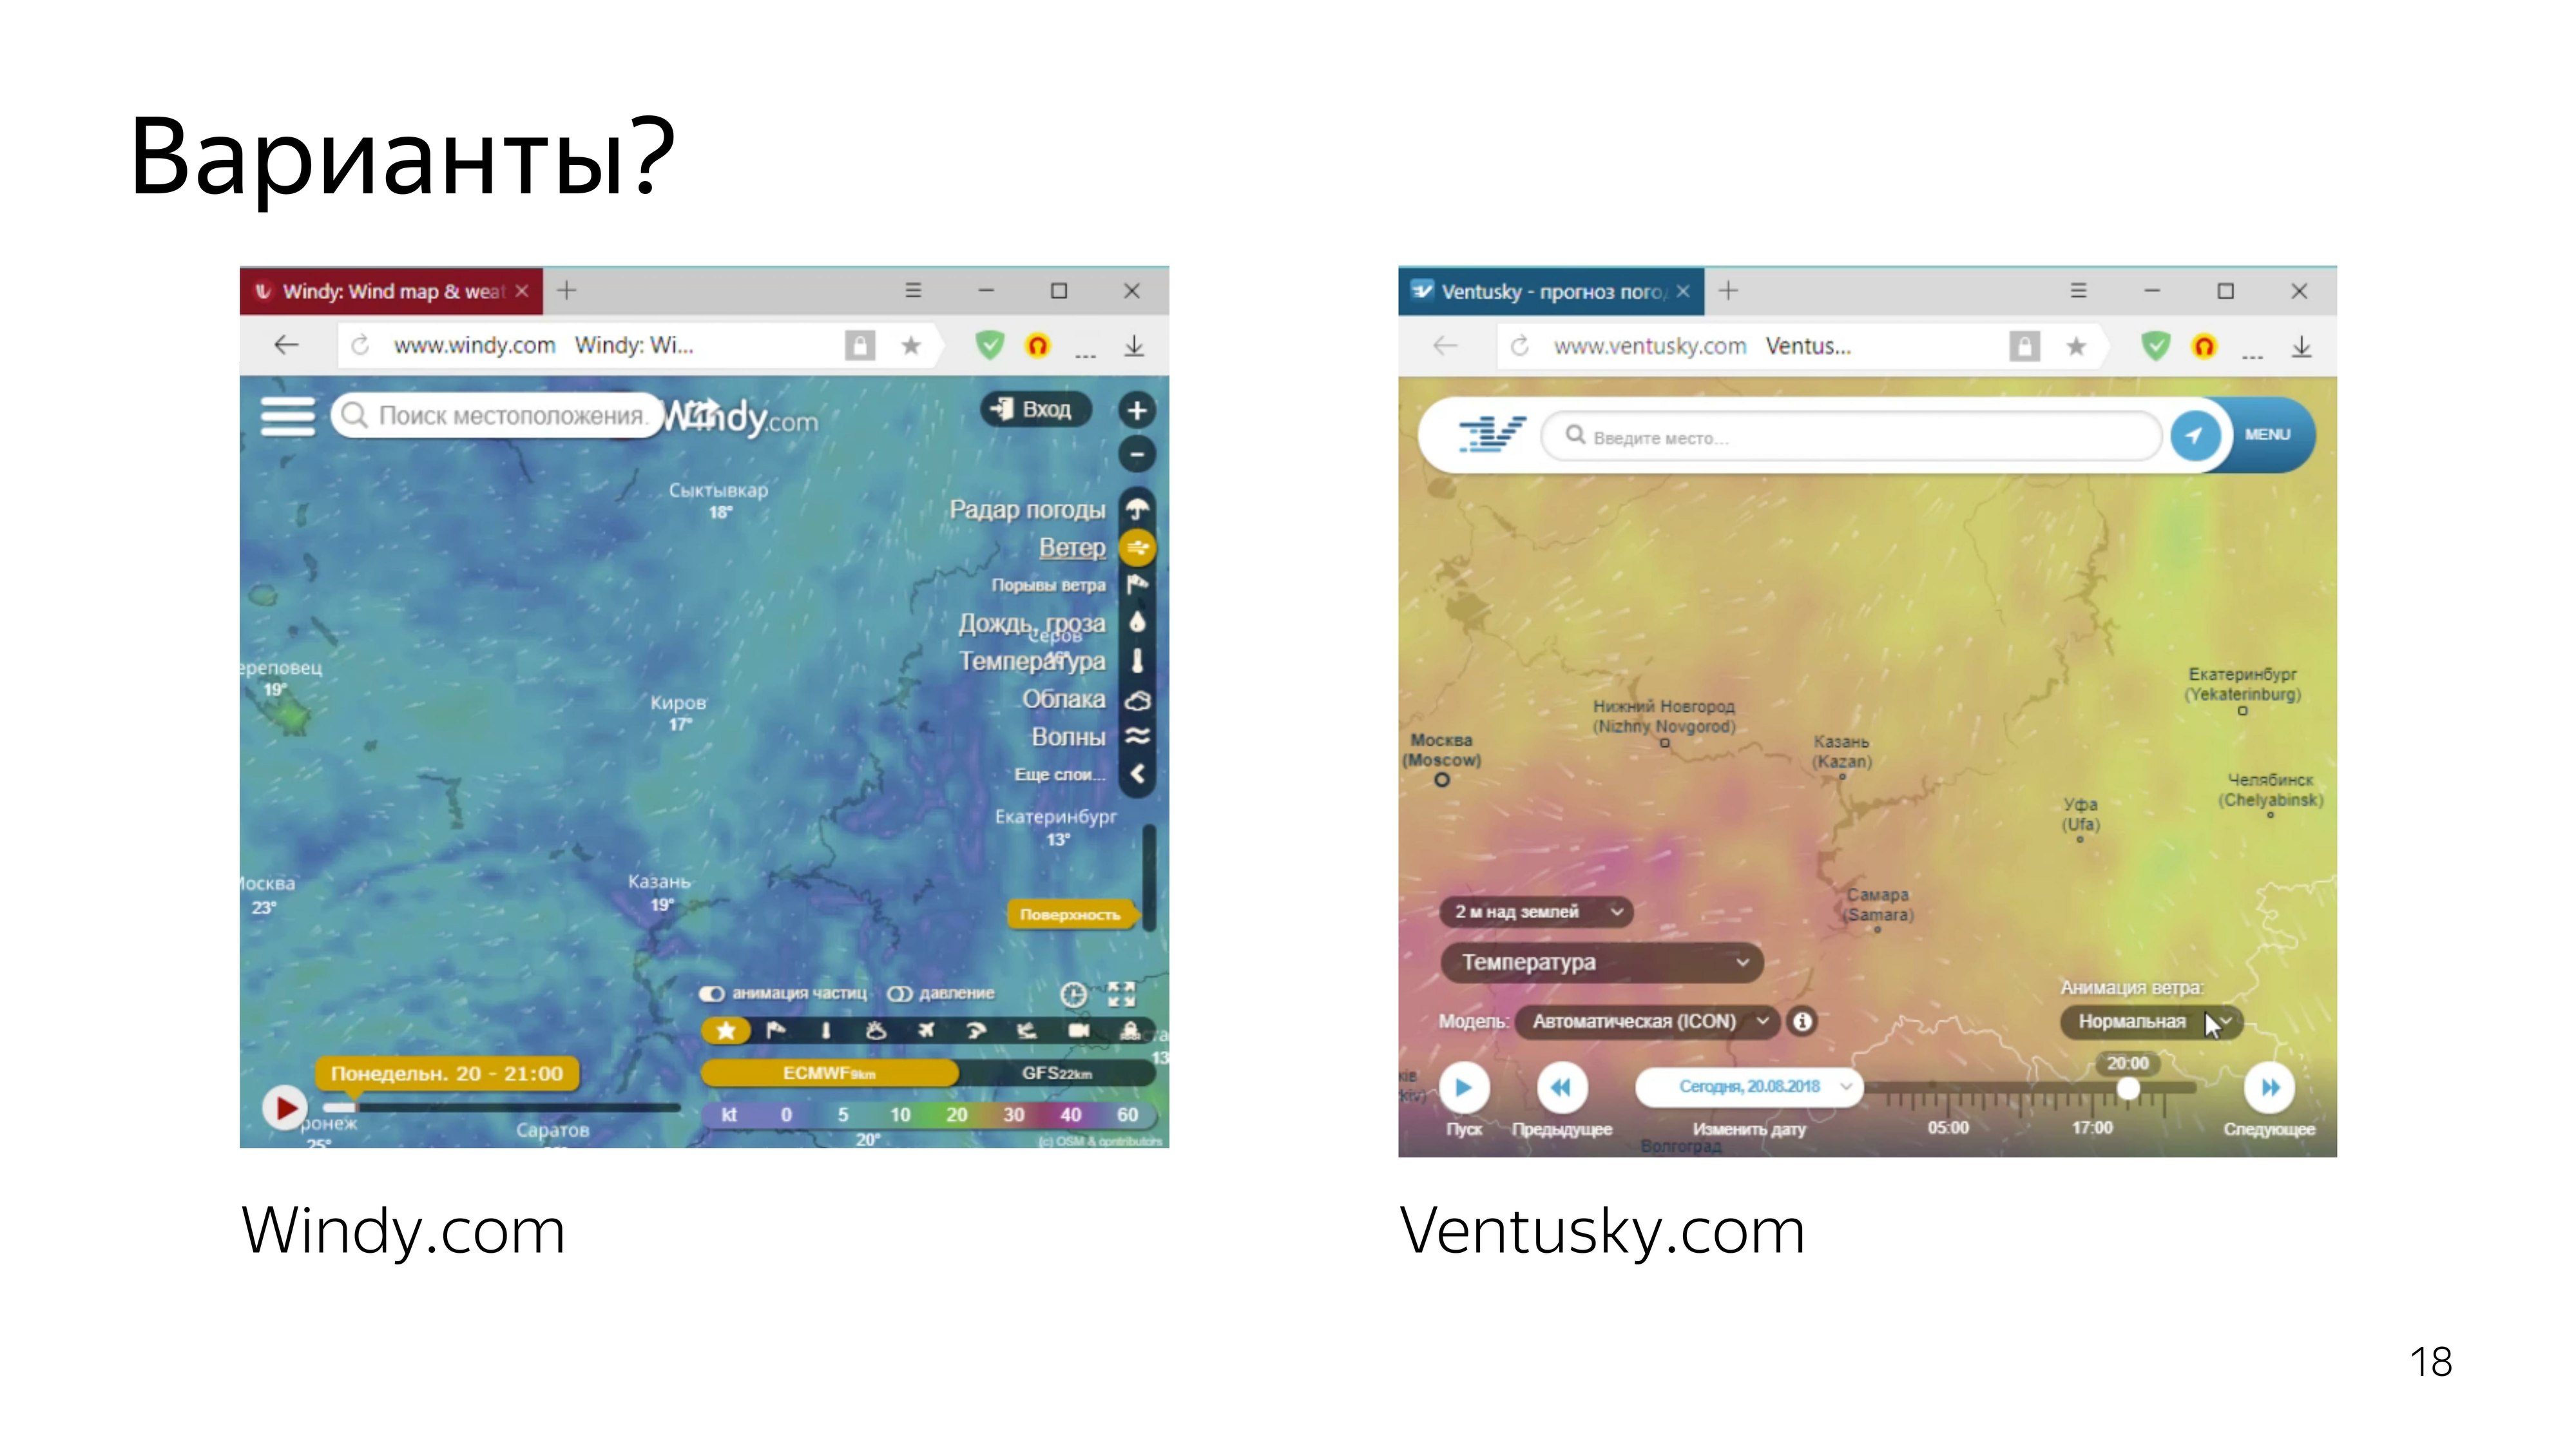
Services that show the forecast of the wind, is already there. This is a pair of cool, particularly prominent.

Looking at them, we realized that we wanted to do the same - or, at least, not worse.
Therefore, we decided to visualize particles that smoothly move around the map, depending on the wind speed, and leave some trail behind them so that they can be seen, the wind path can be seen.
Since we already did a great job and made a cool rainfall map using 2D canvas, we decided to do the same with particles.
After consulting with the designer, we realized that we need approximately 6% of the screen to be filled with particles in order to have a cool effect.
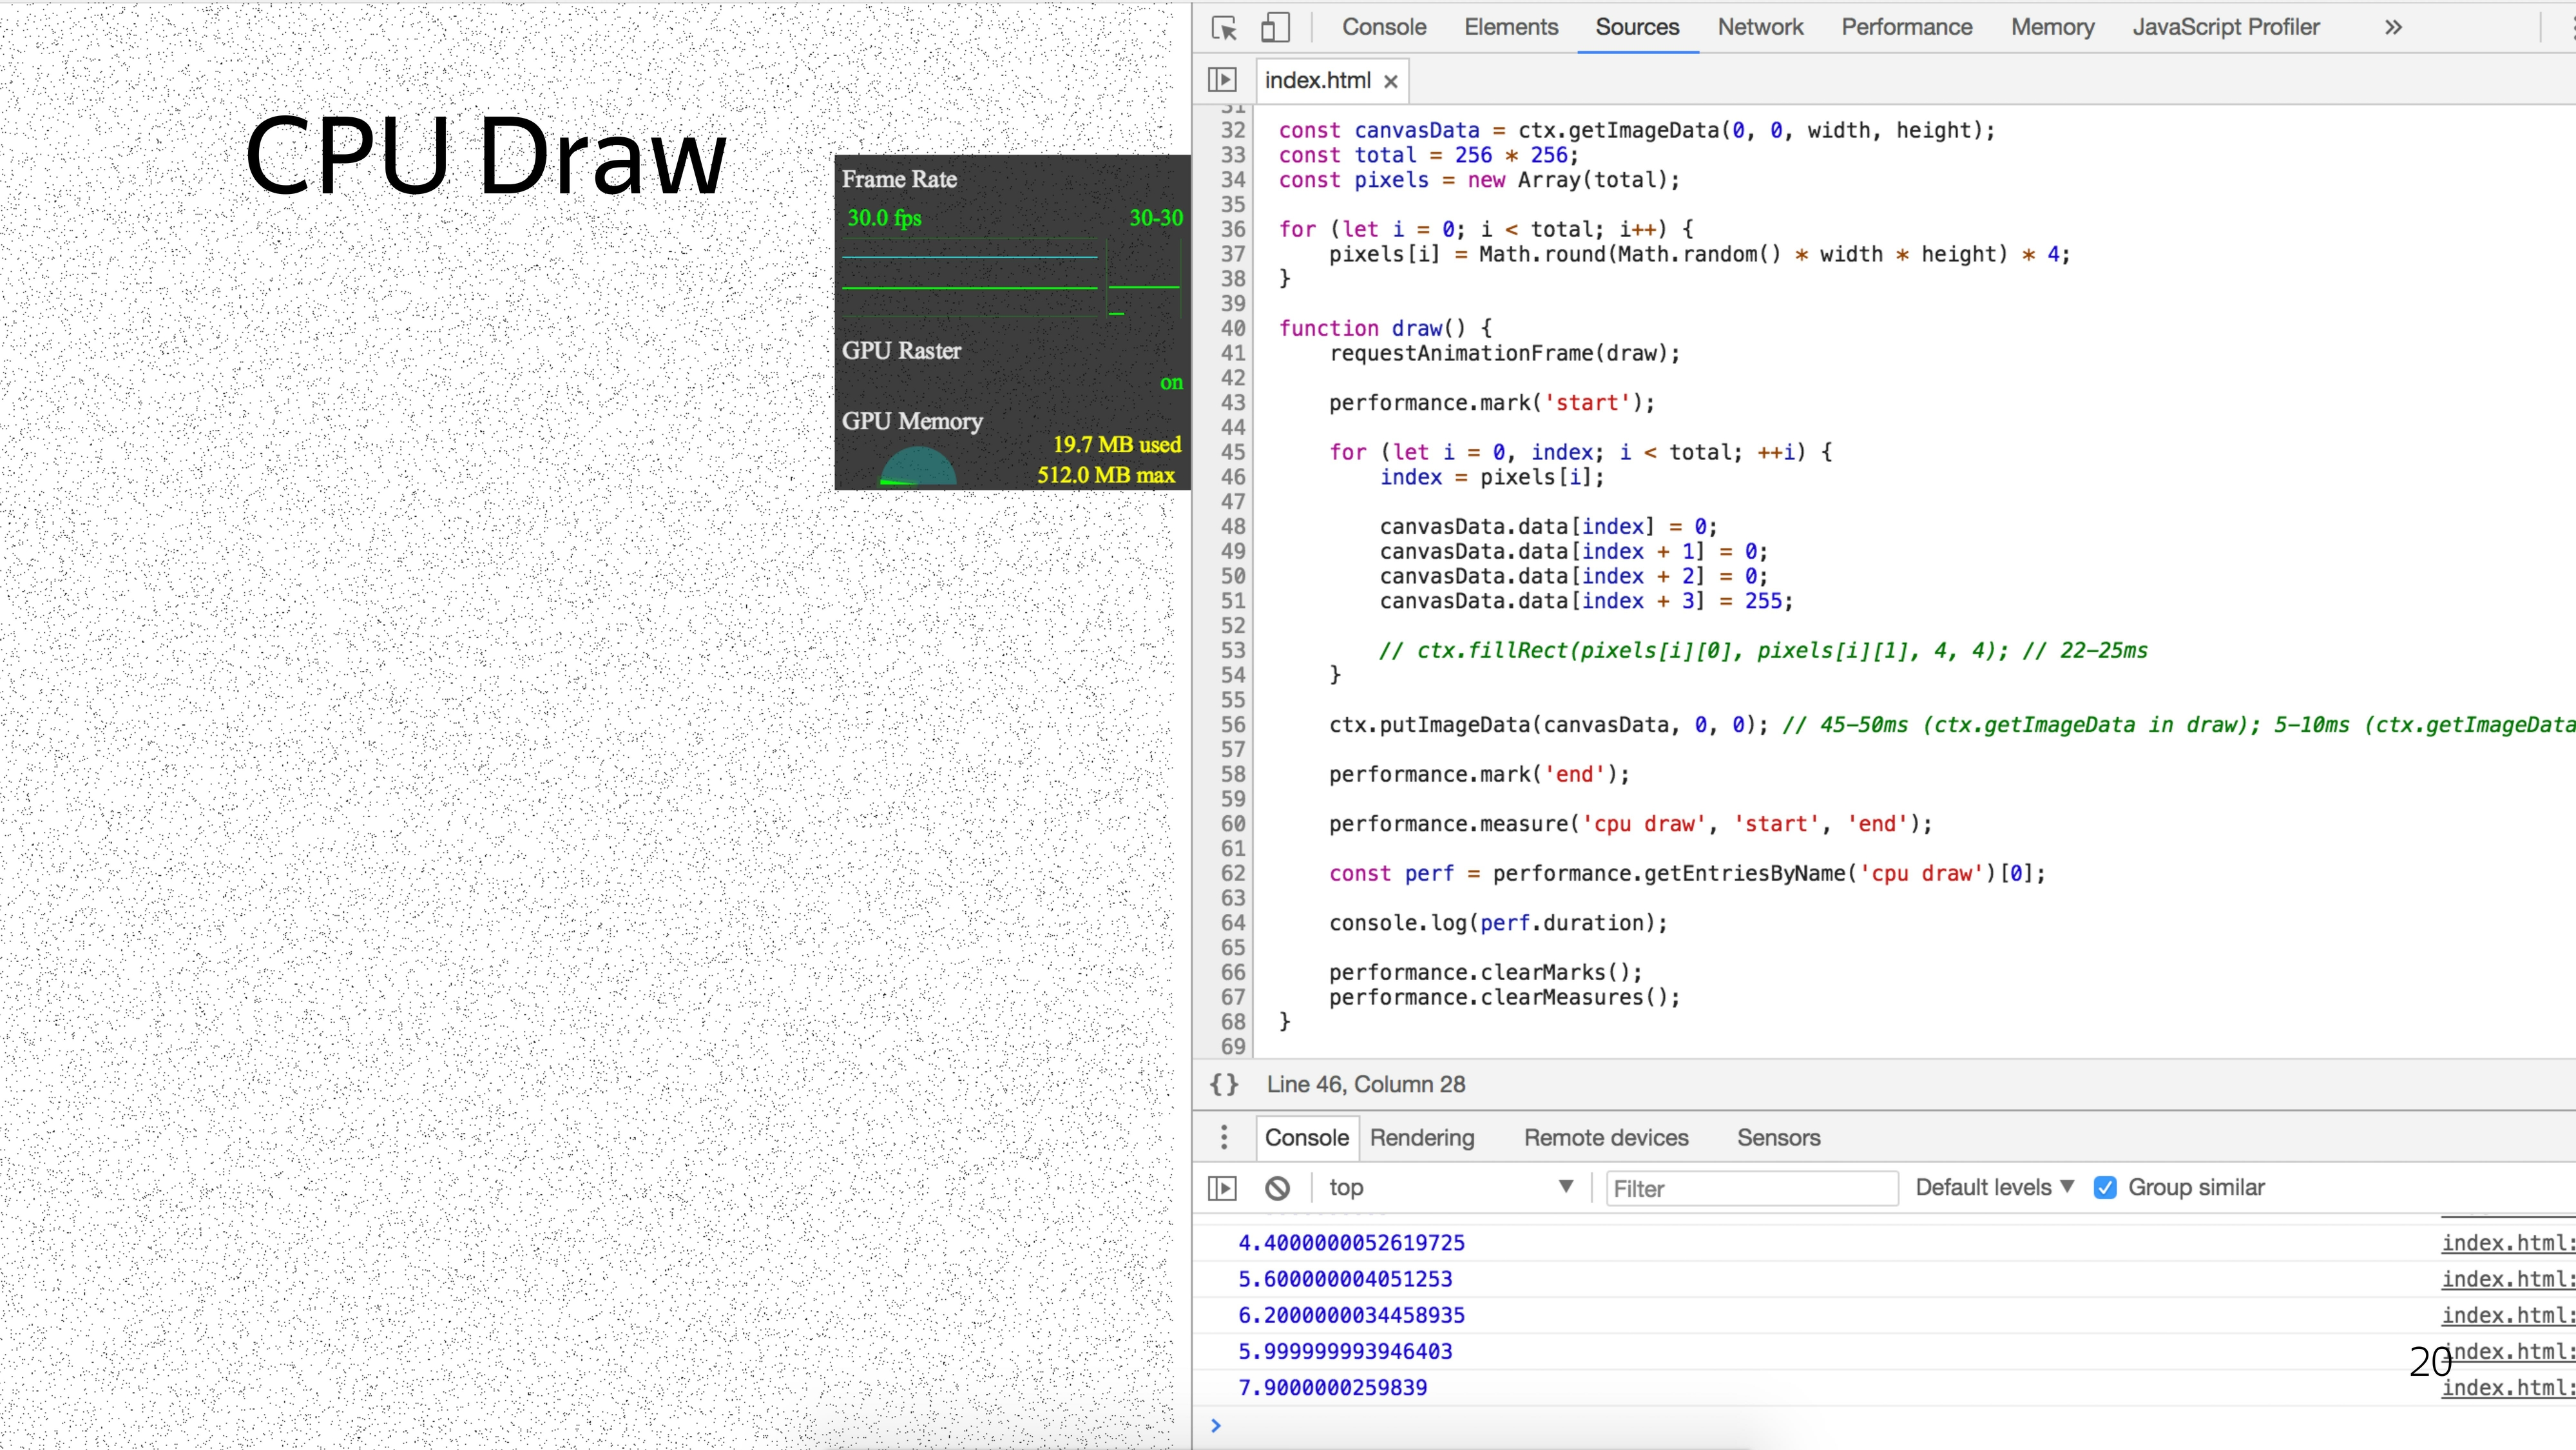
To draw such a number of particles with a standard approach, we have a minimum timing of 5 ms.

If we think that we still need to move the particles and impose some kind of beauty like drawing the tail of the particles, we can assume that we will fall out for a minimum timeout of 40 ms to show smooth animation in order to produce at least 25 frames per second.
The problem is that here each particle would be processed sequentially. But what if you process them in parallel?
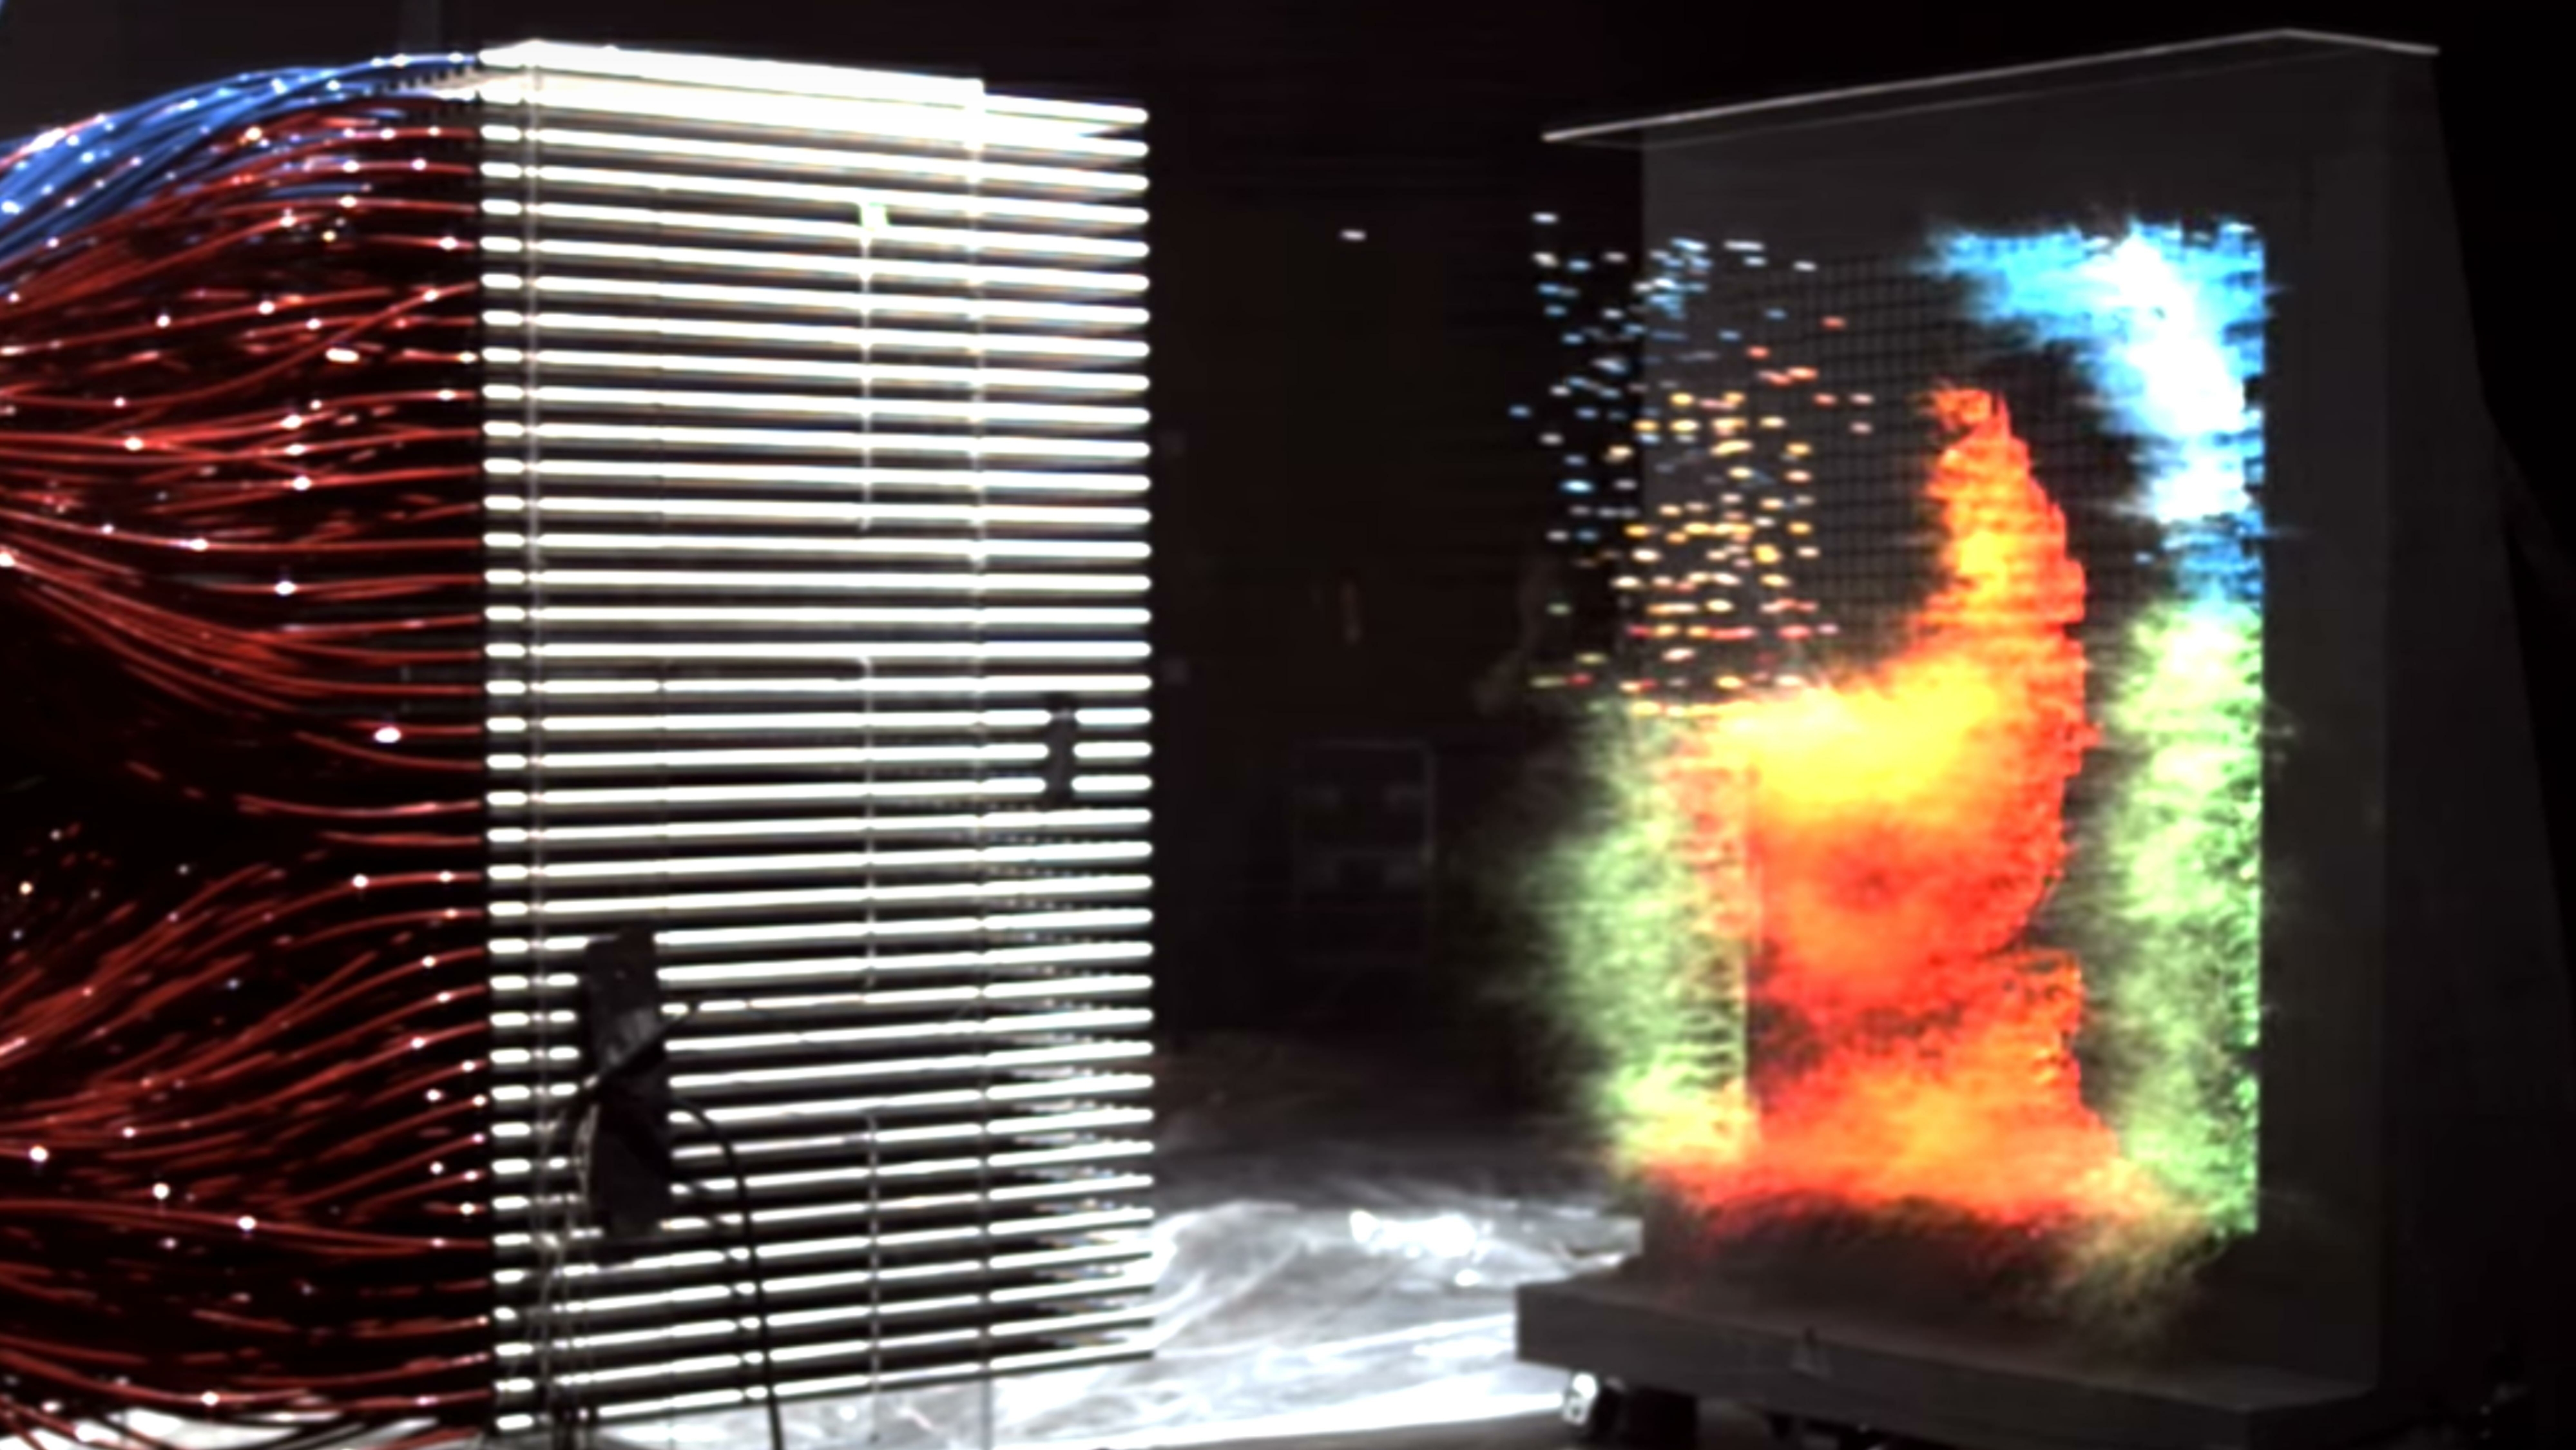
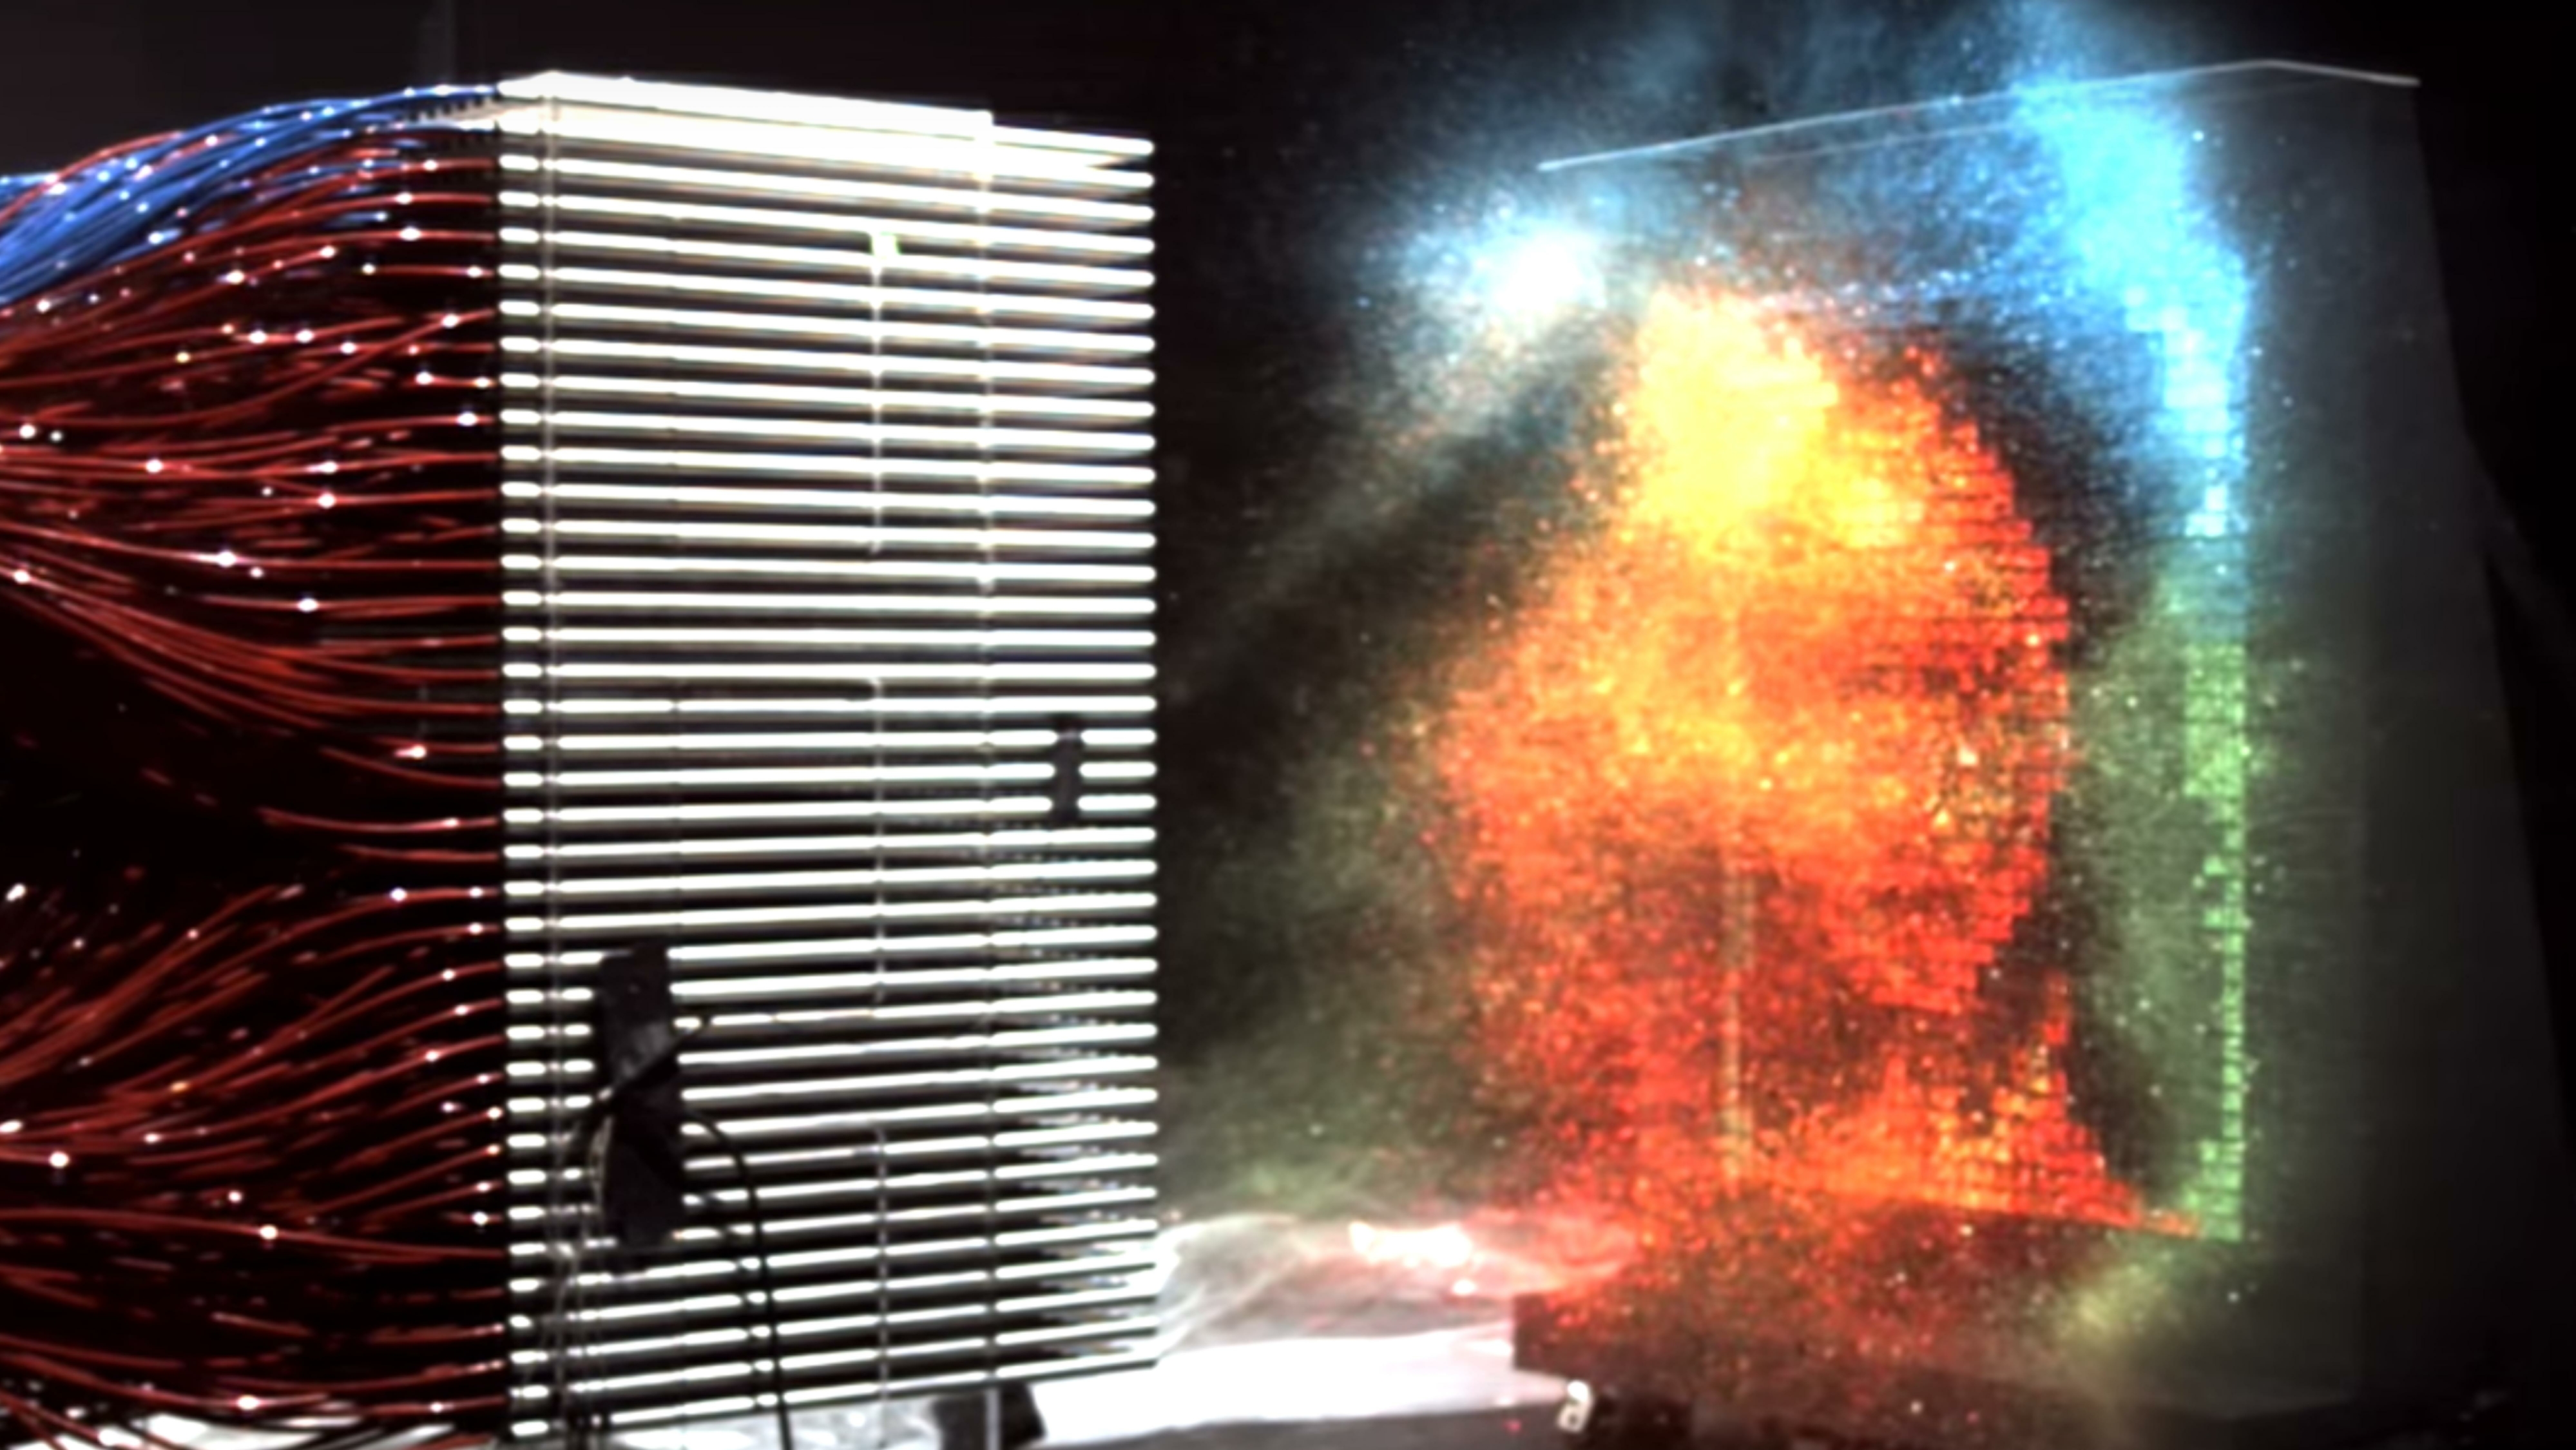
A visual difference in the work of the central and graphic processor was shown by the “Destroyers of Legends” at one of the conferences. They rolled out a typewriter on which a paintball marker was installed, the task of which was to draw a smiley with one color. In about 10 seconds, he drew such a picture. ( Link to video - ed.)
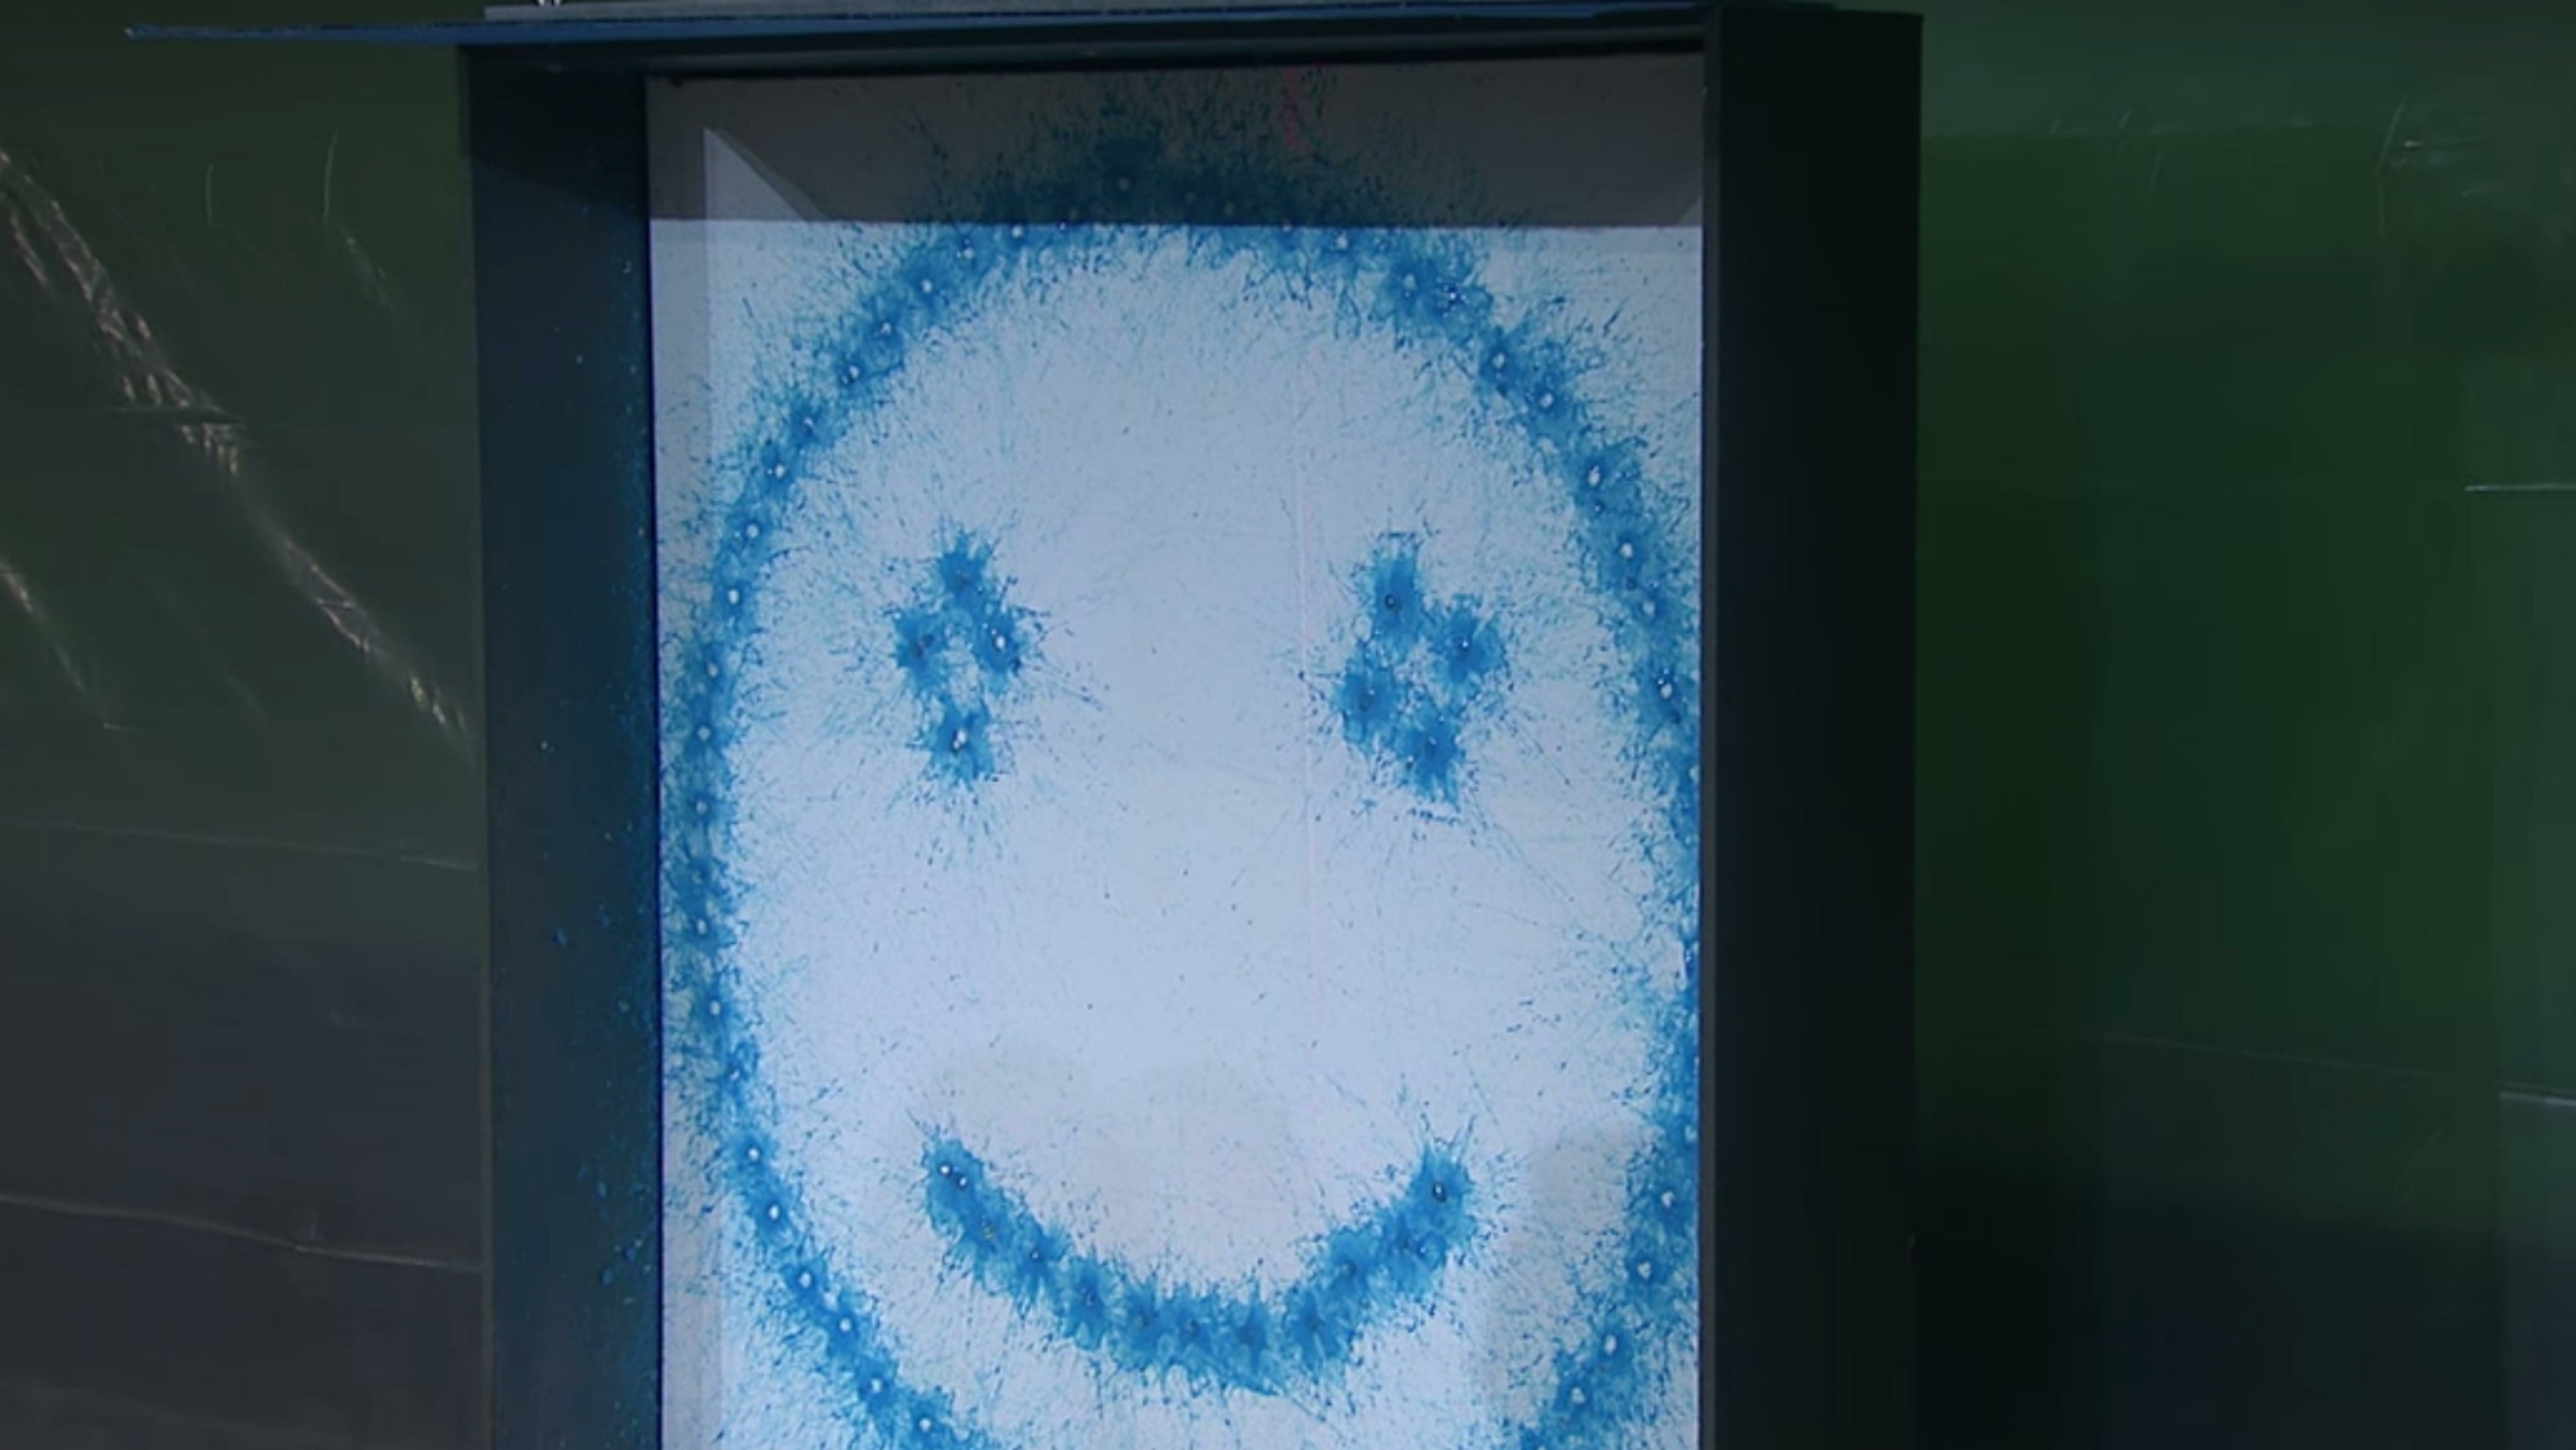
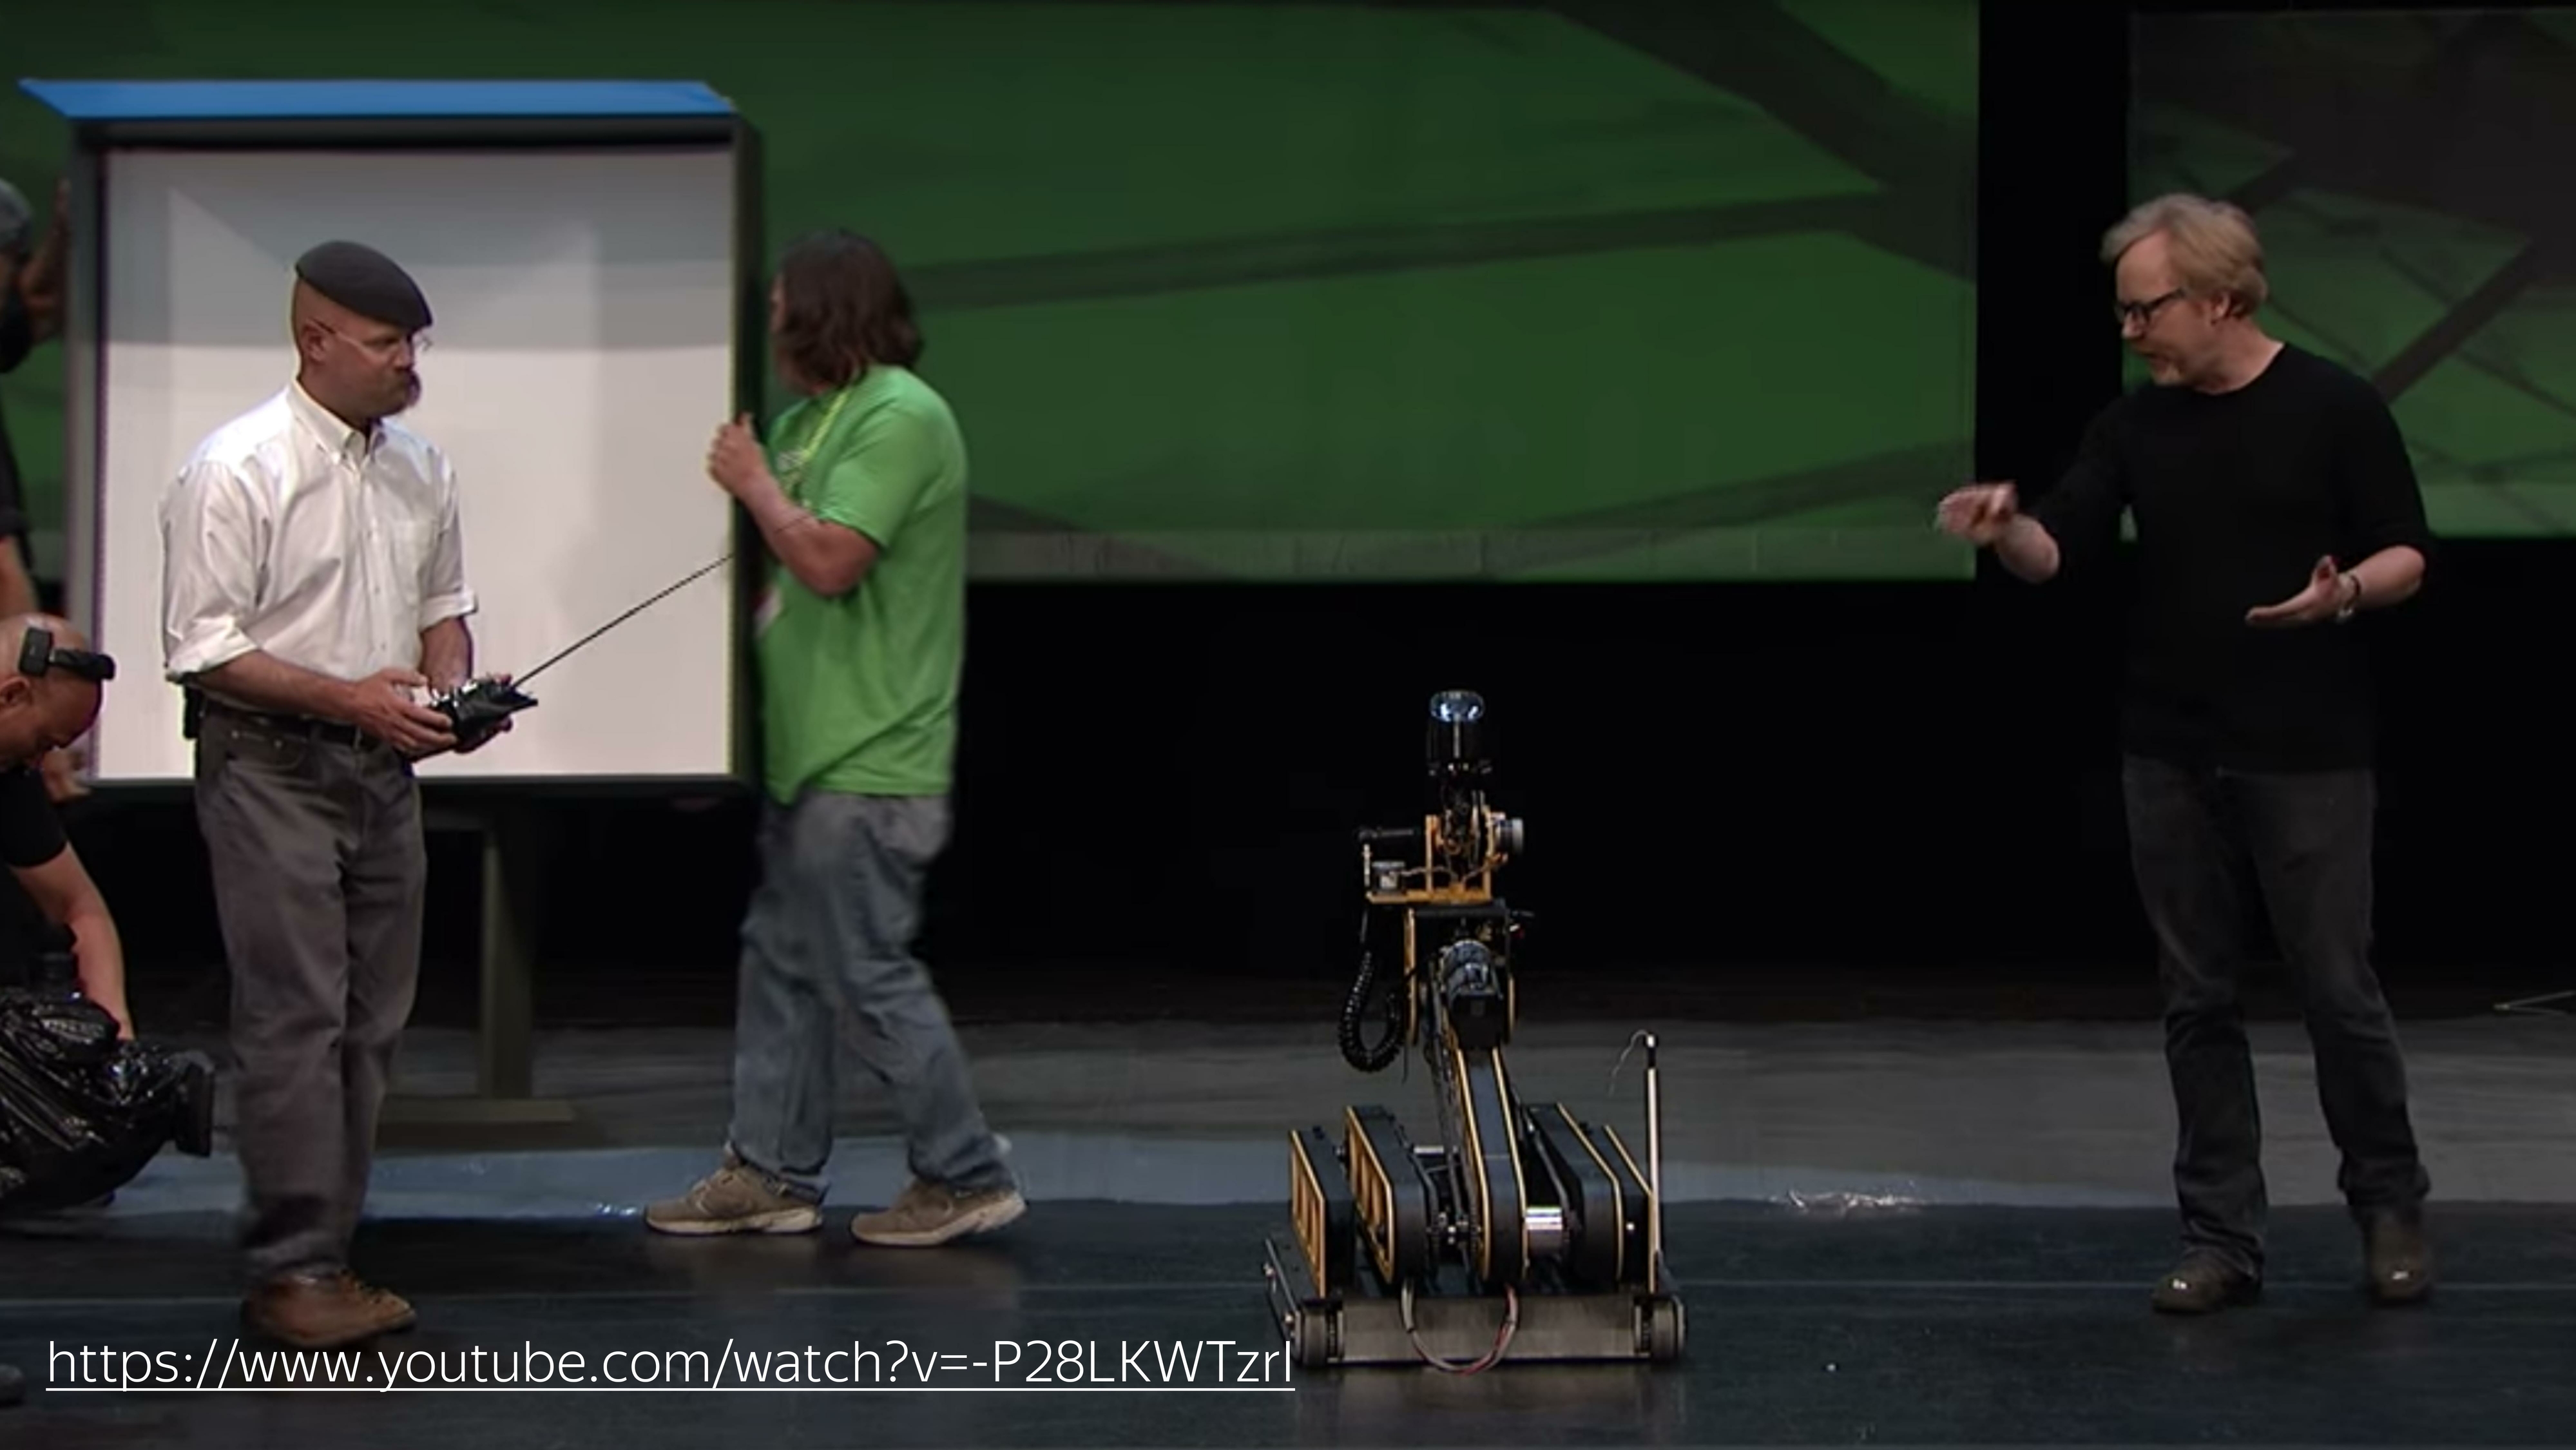

Then the guys rolled out the canoes, which is a GPU, and a couple of spits drew Mona Lisa. Approximately the speed of computing CPU and GPU is different.
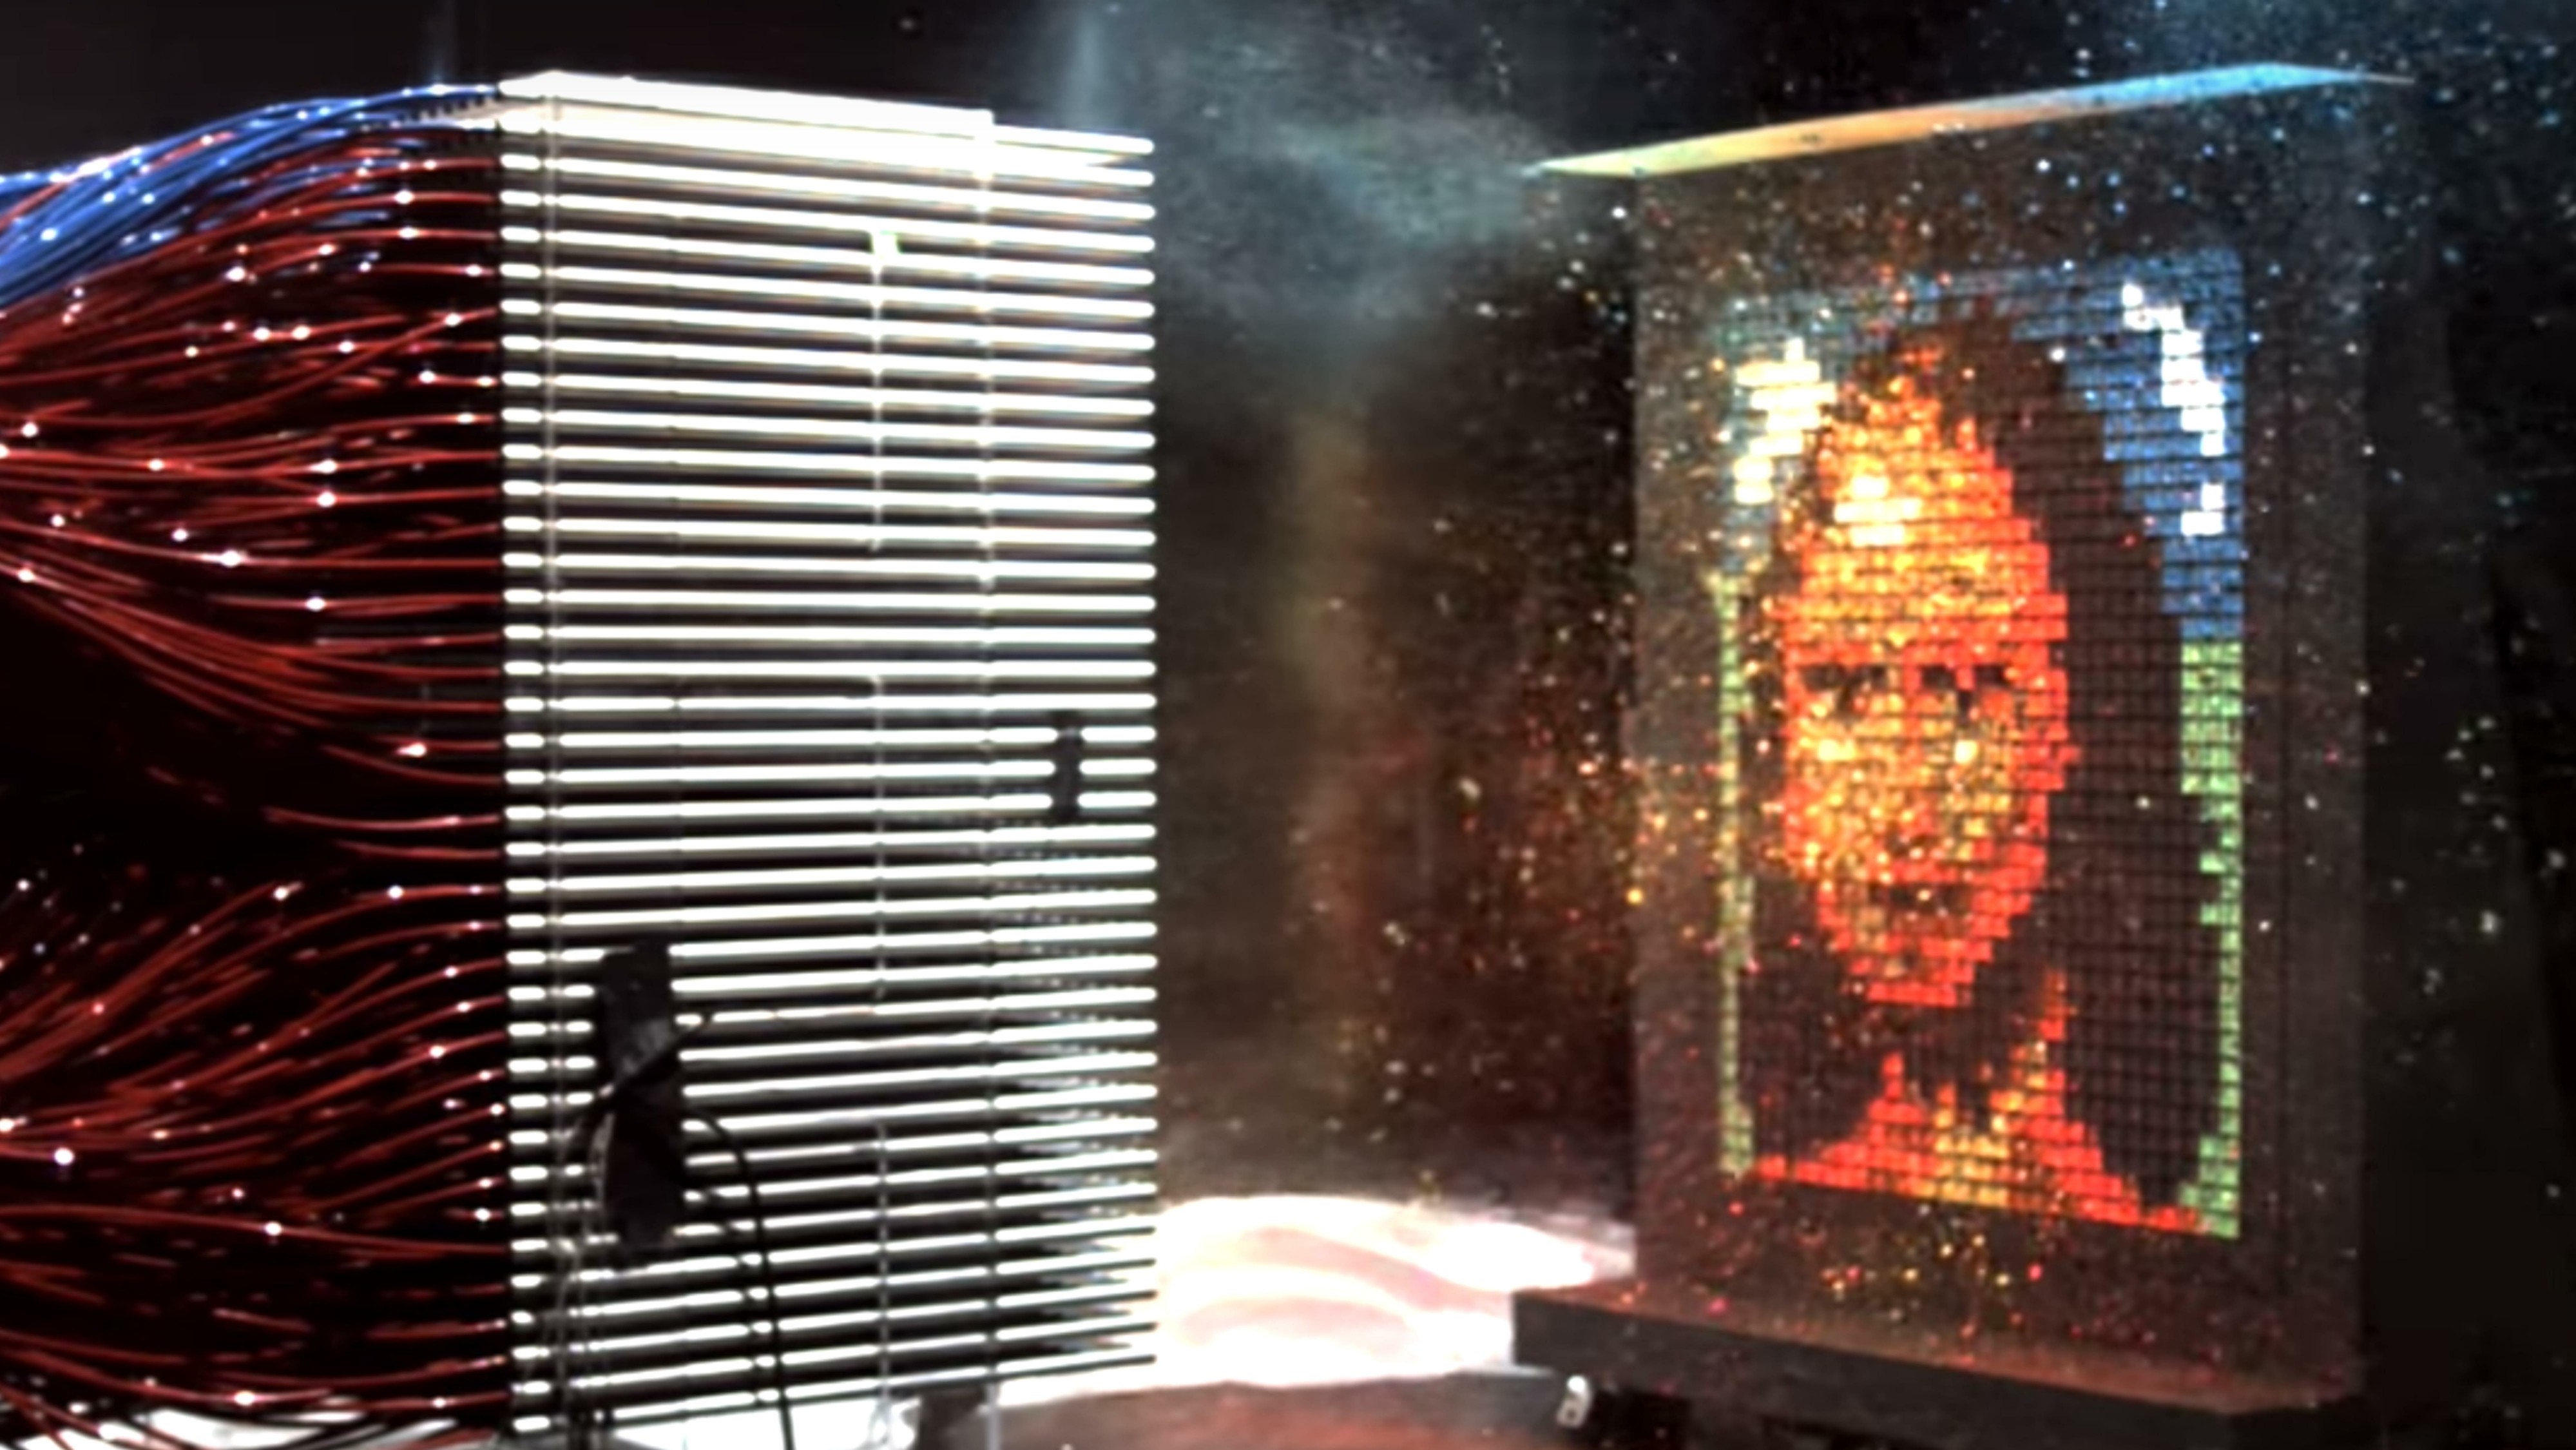

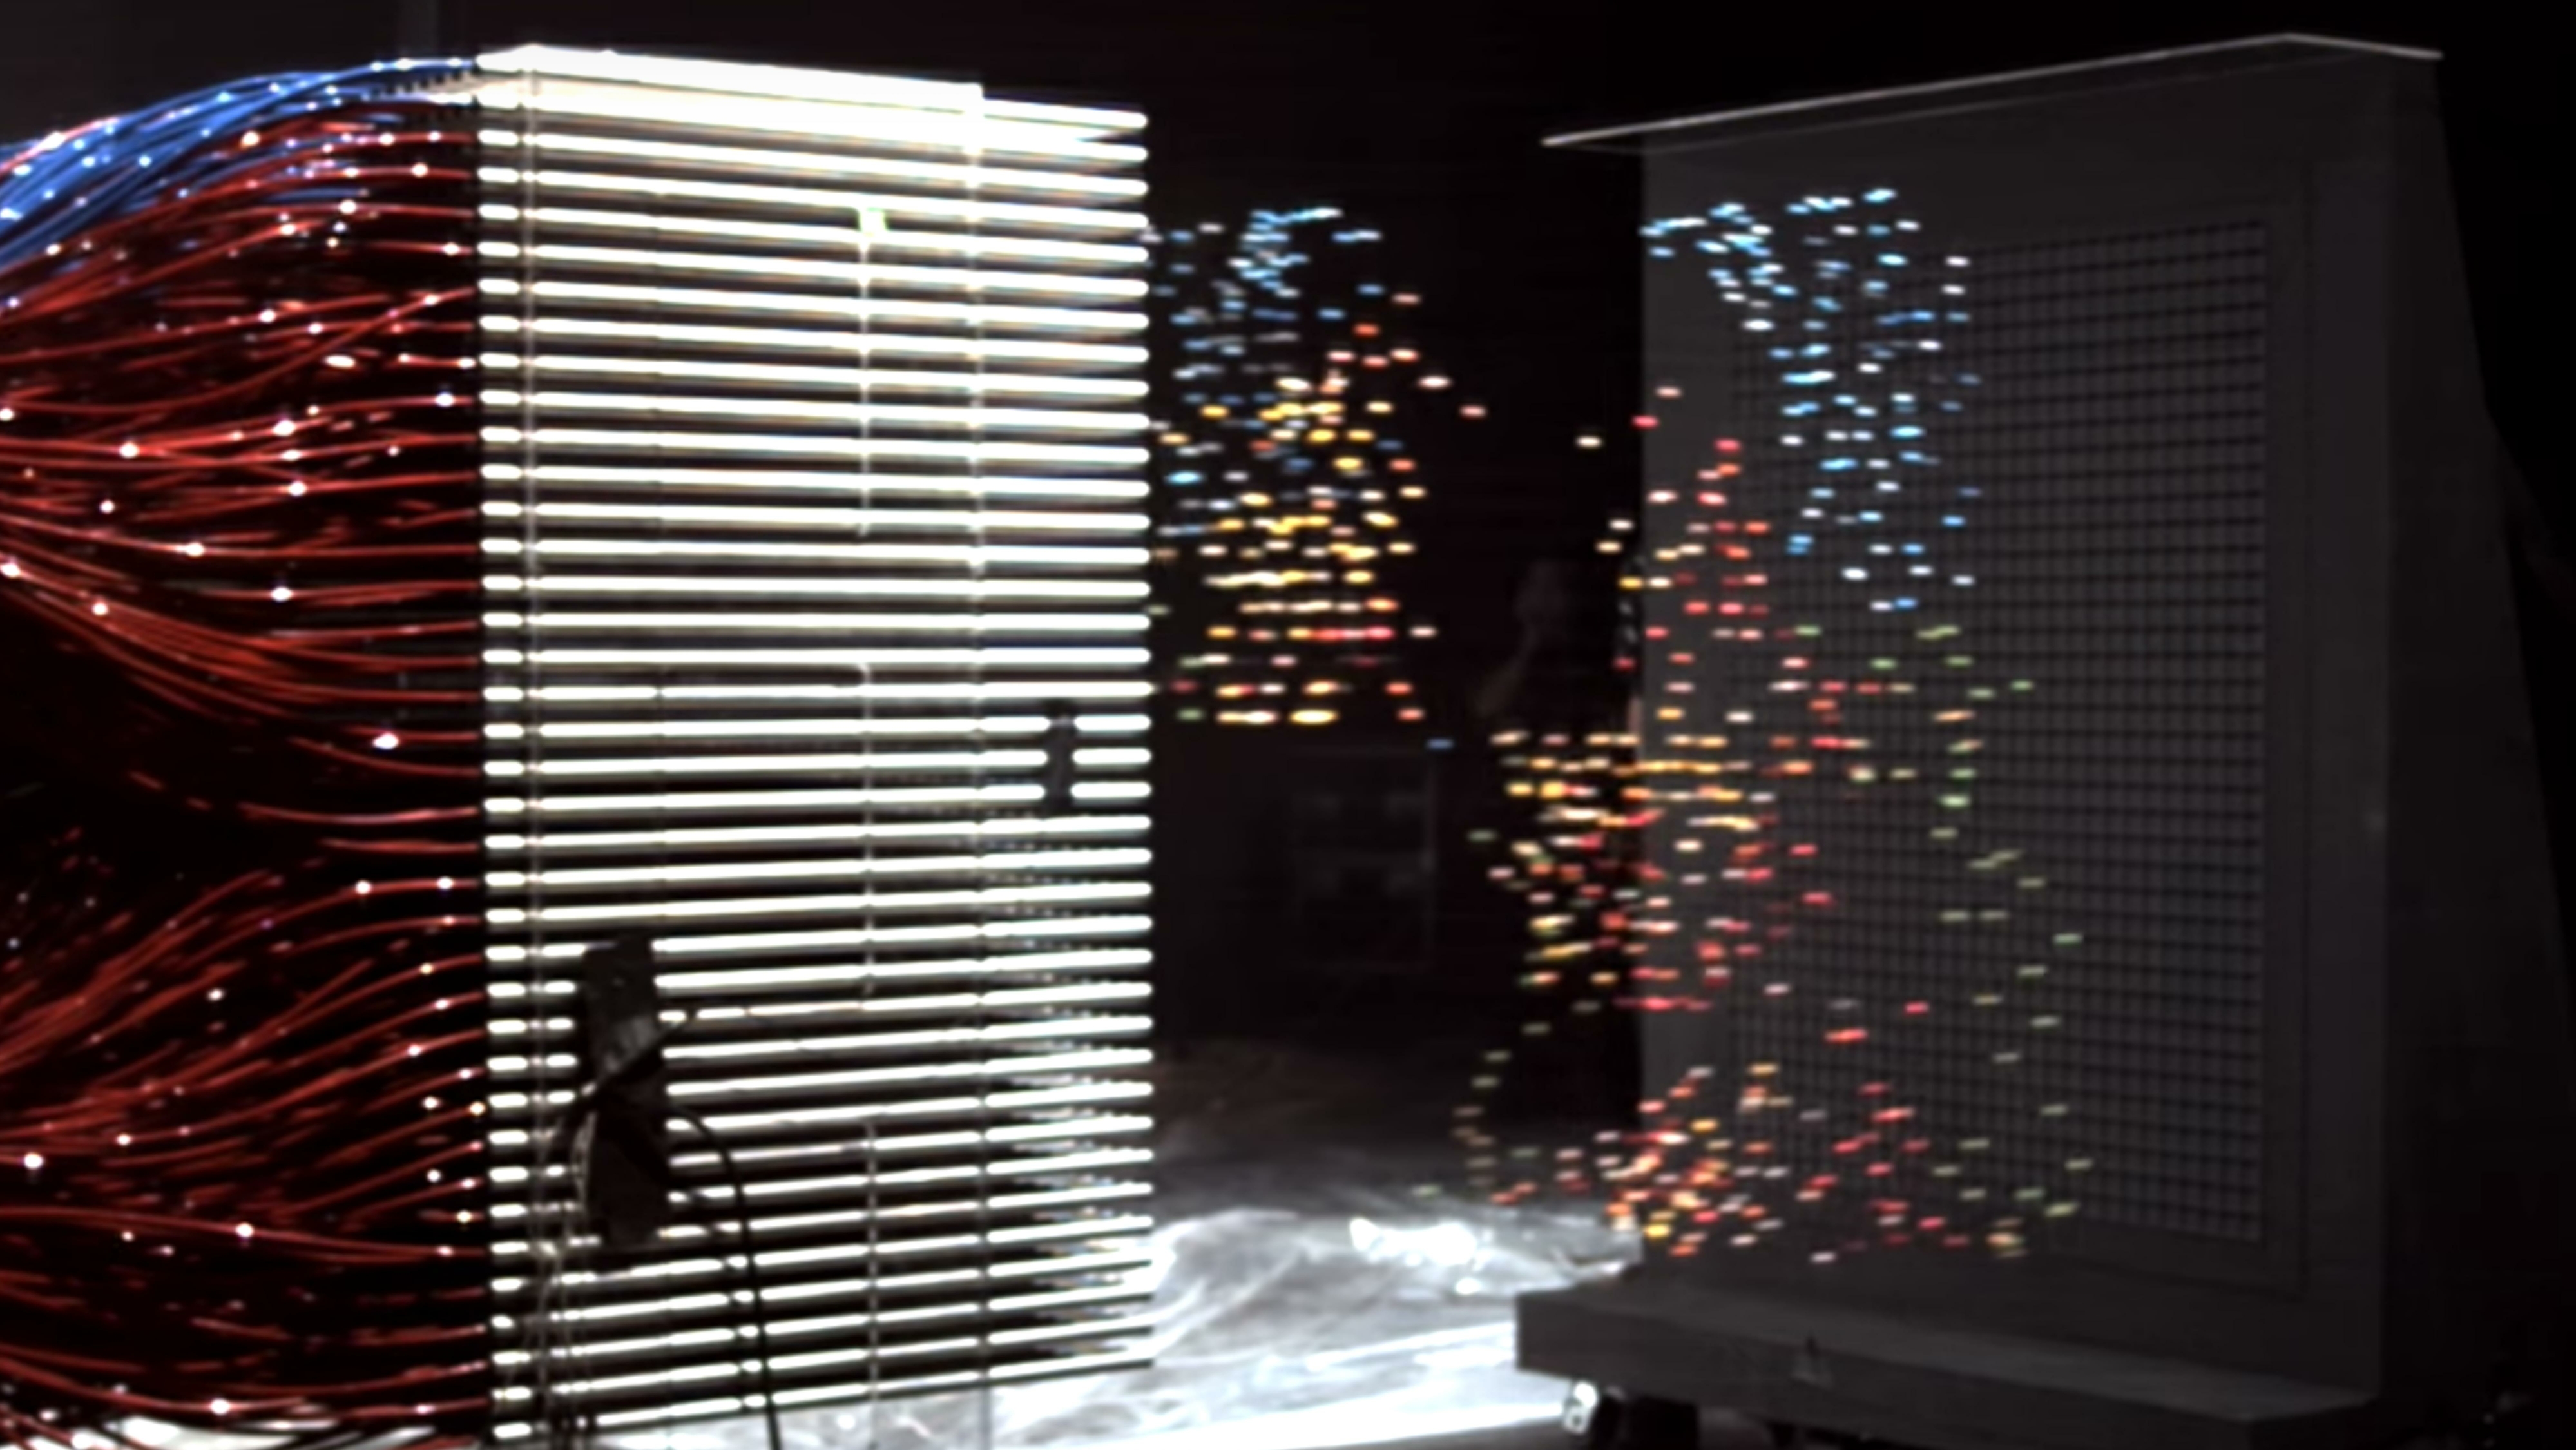
To take advantage of such features in the browser, the technology WebGL was invented.
What it is? With this question I got into the Internet. Having added a couple of words with particle animation and wind, I found a couple of articles.

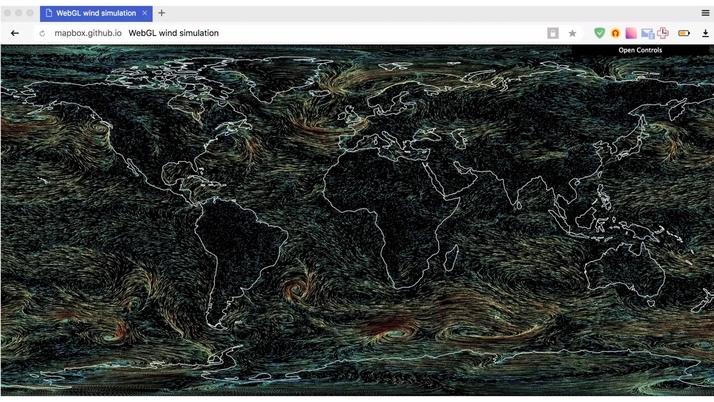
One of them is a demo of Vladimir Agafonkin, an engineer from Mapbox, who made the wind on WebGL and referred to the blog of Chris Wellas who talked about how to move and store the state of particles on the GPU.
We take and copy. We expect this result. Here the particles move smoothly.
We get do not understand what.
We are trying to deal with the code. We improve, again we get an unsatisfactory result. We climb even deeper - we get rain instead of wind.
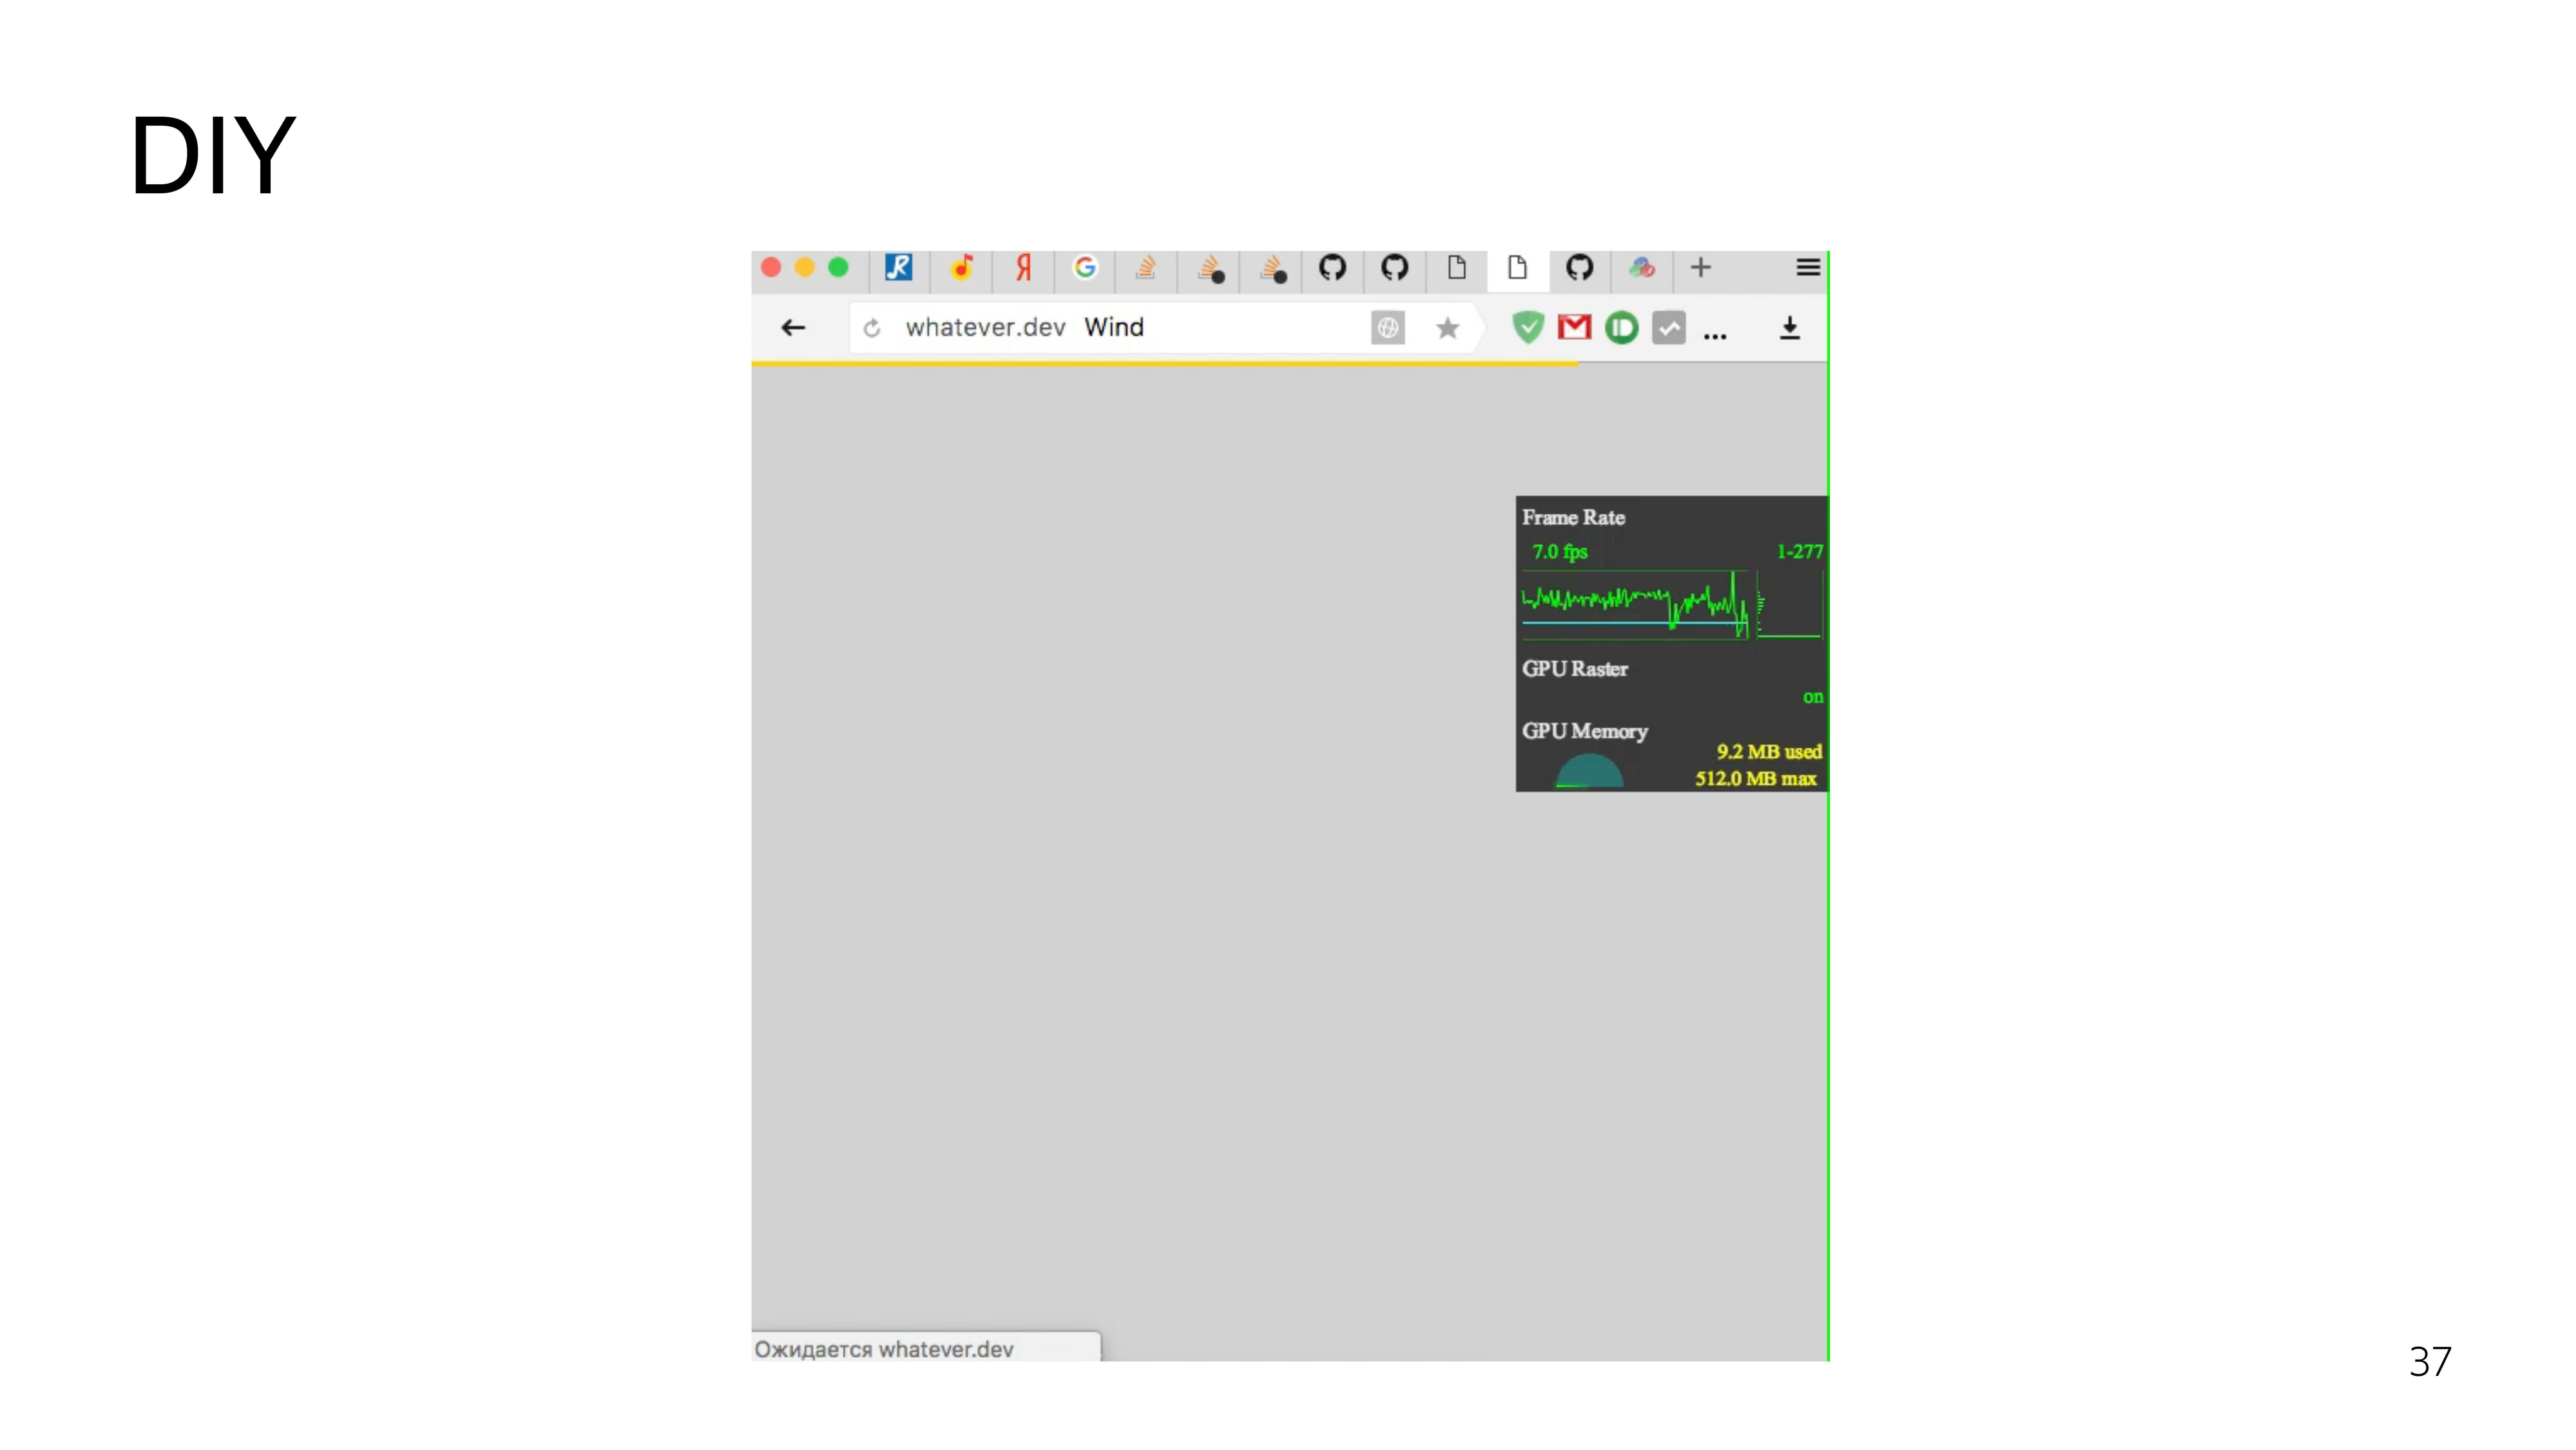
Okay, we decide to do it yourself.
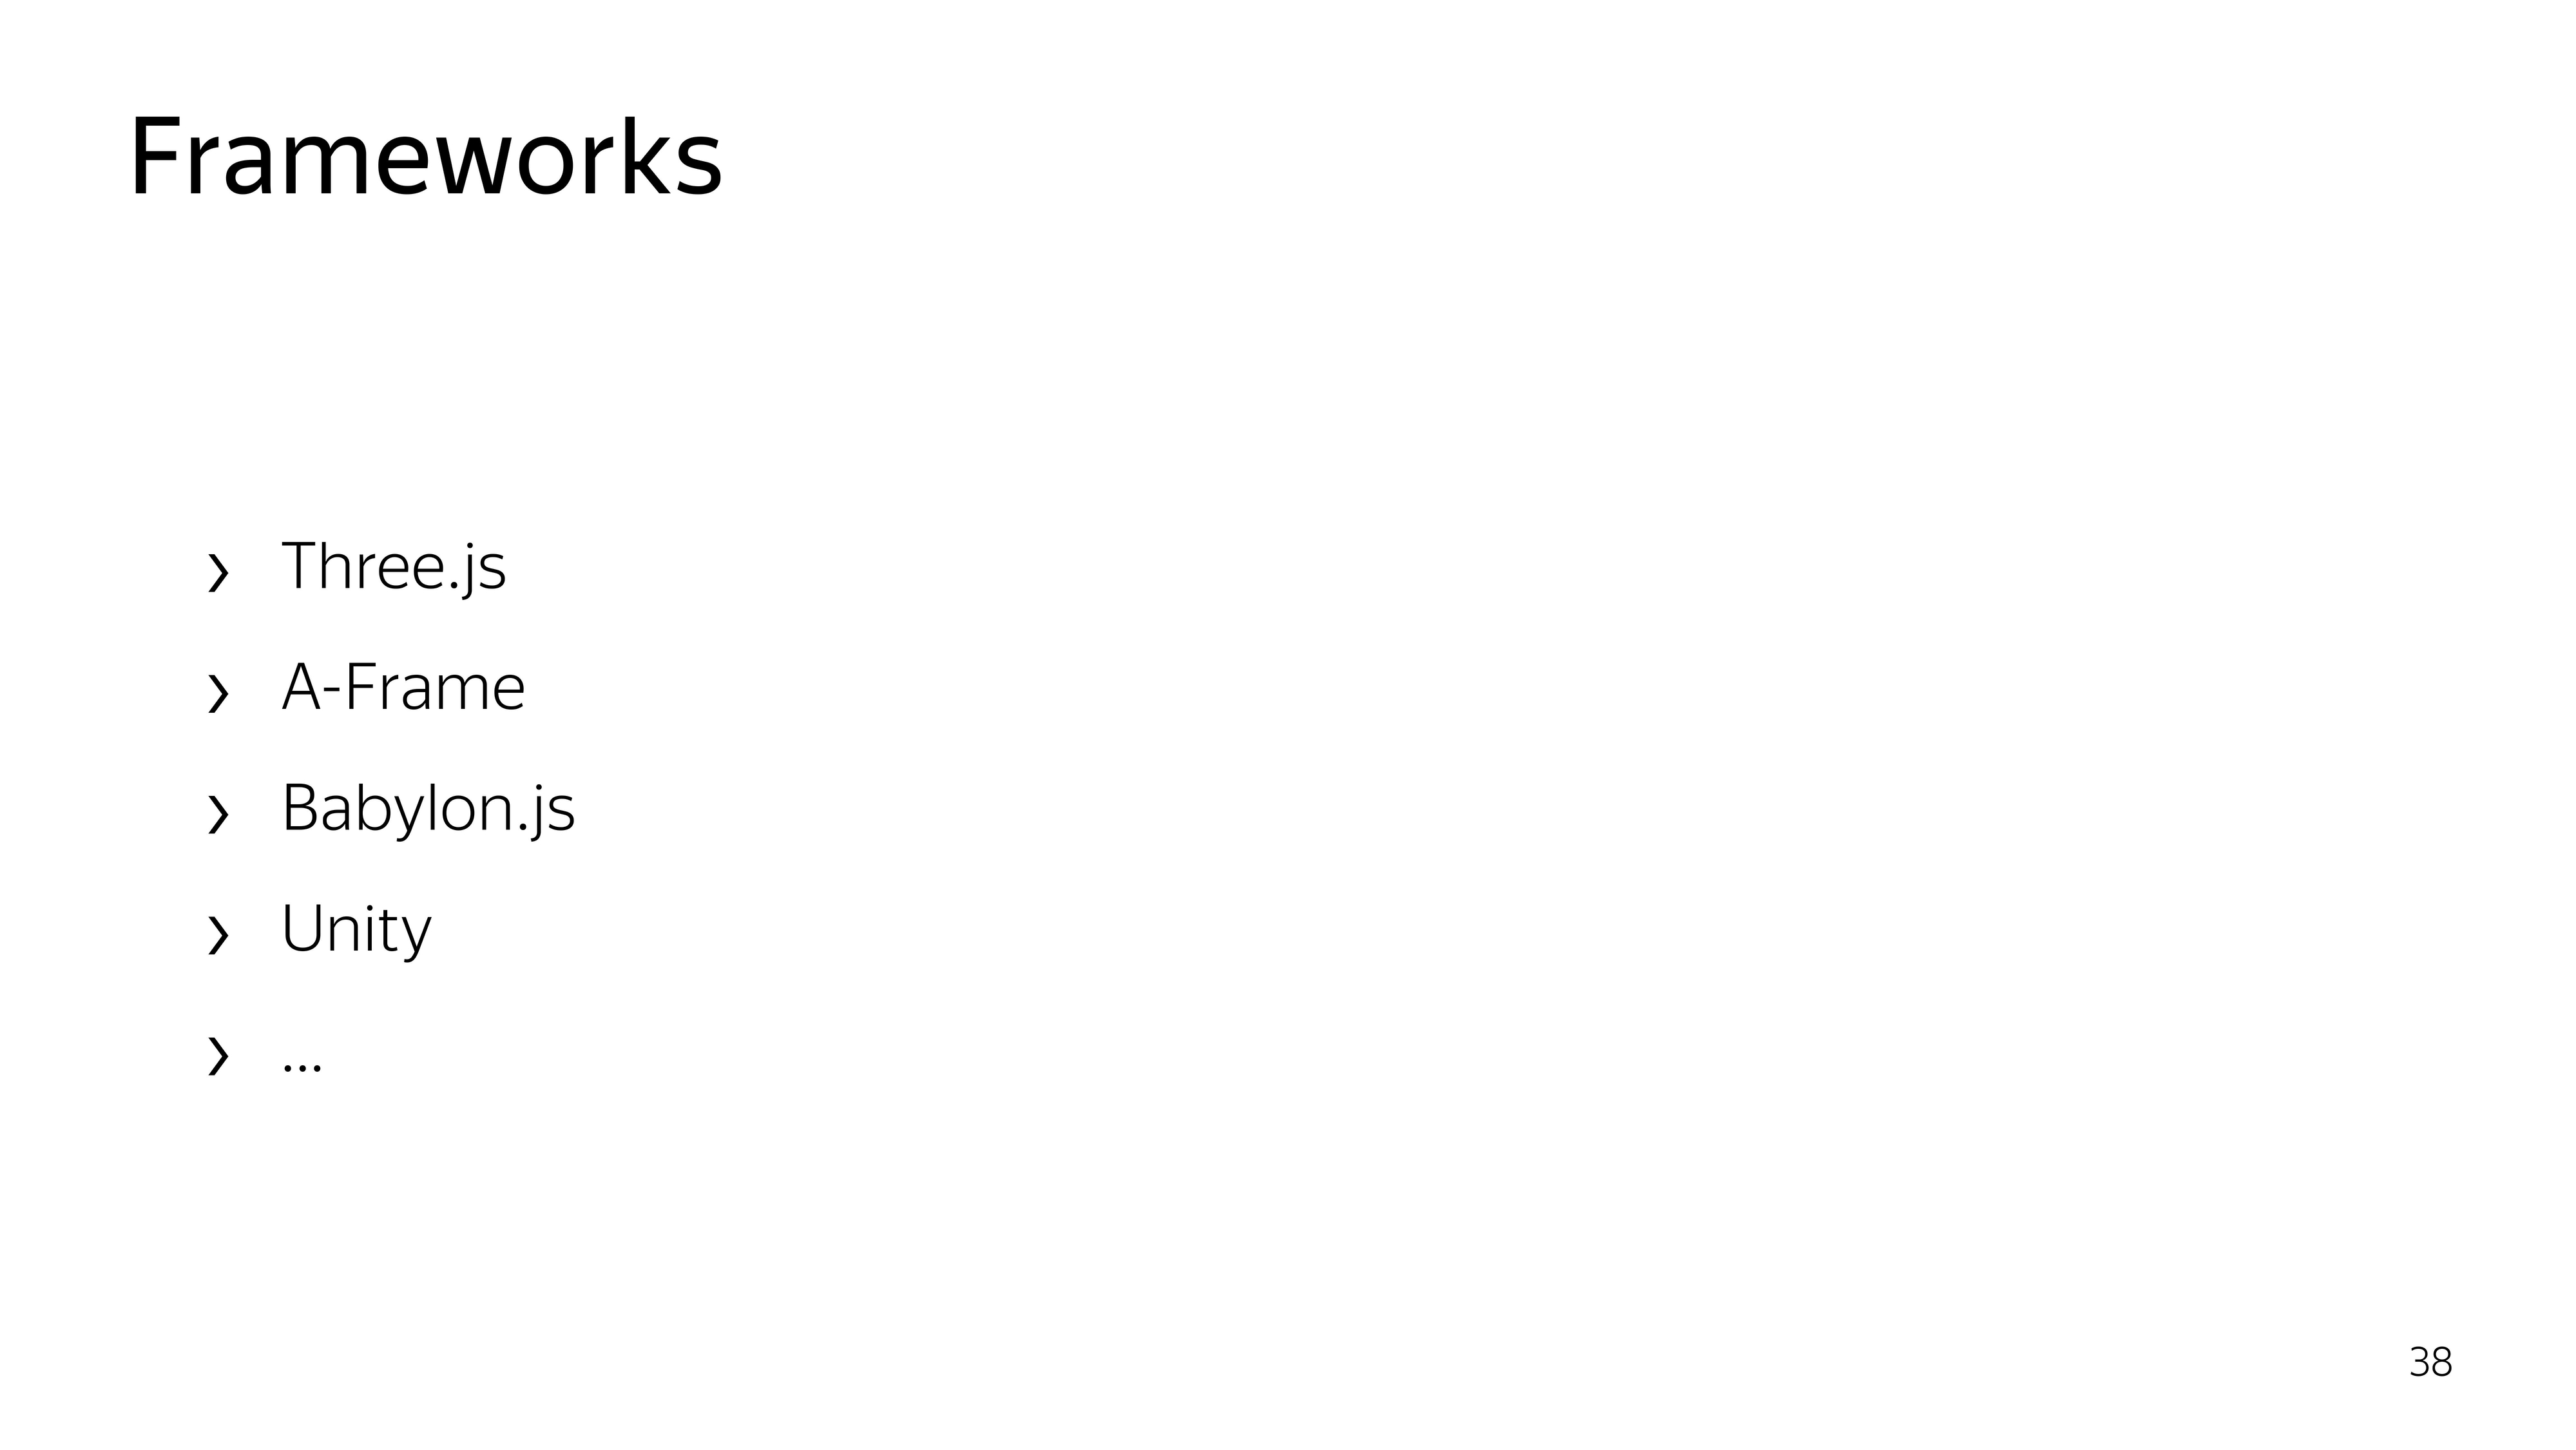
To work with WebGL, there are frameworks. Almost all of them are aimed at working with 3D-objects. We do not need these 3D features. We only need to draw a particle and move it. Therefore, we decide to do everything by hand.
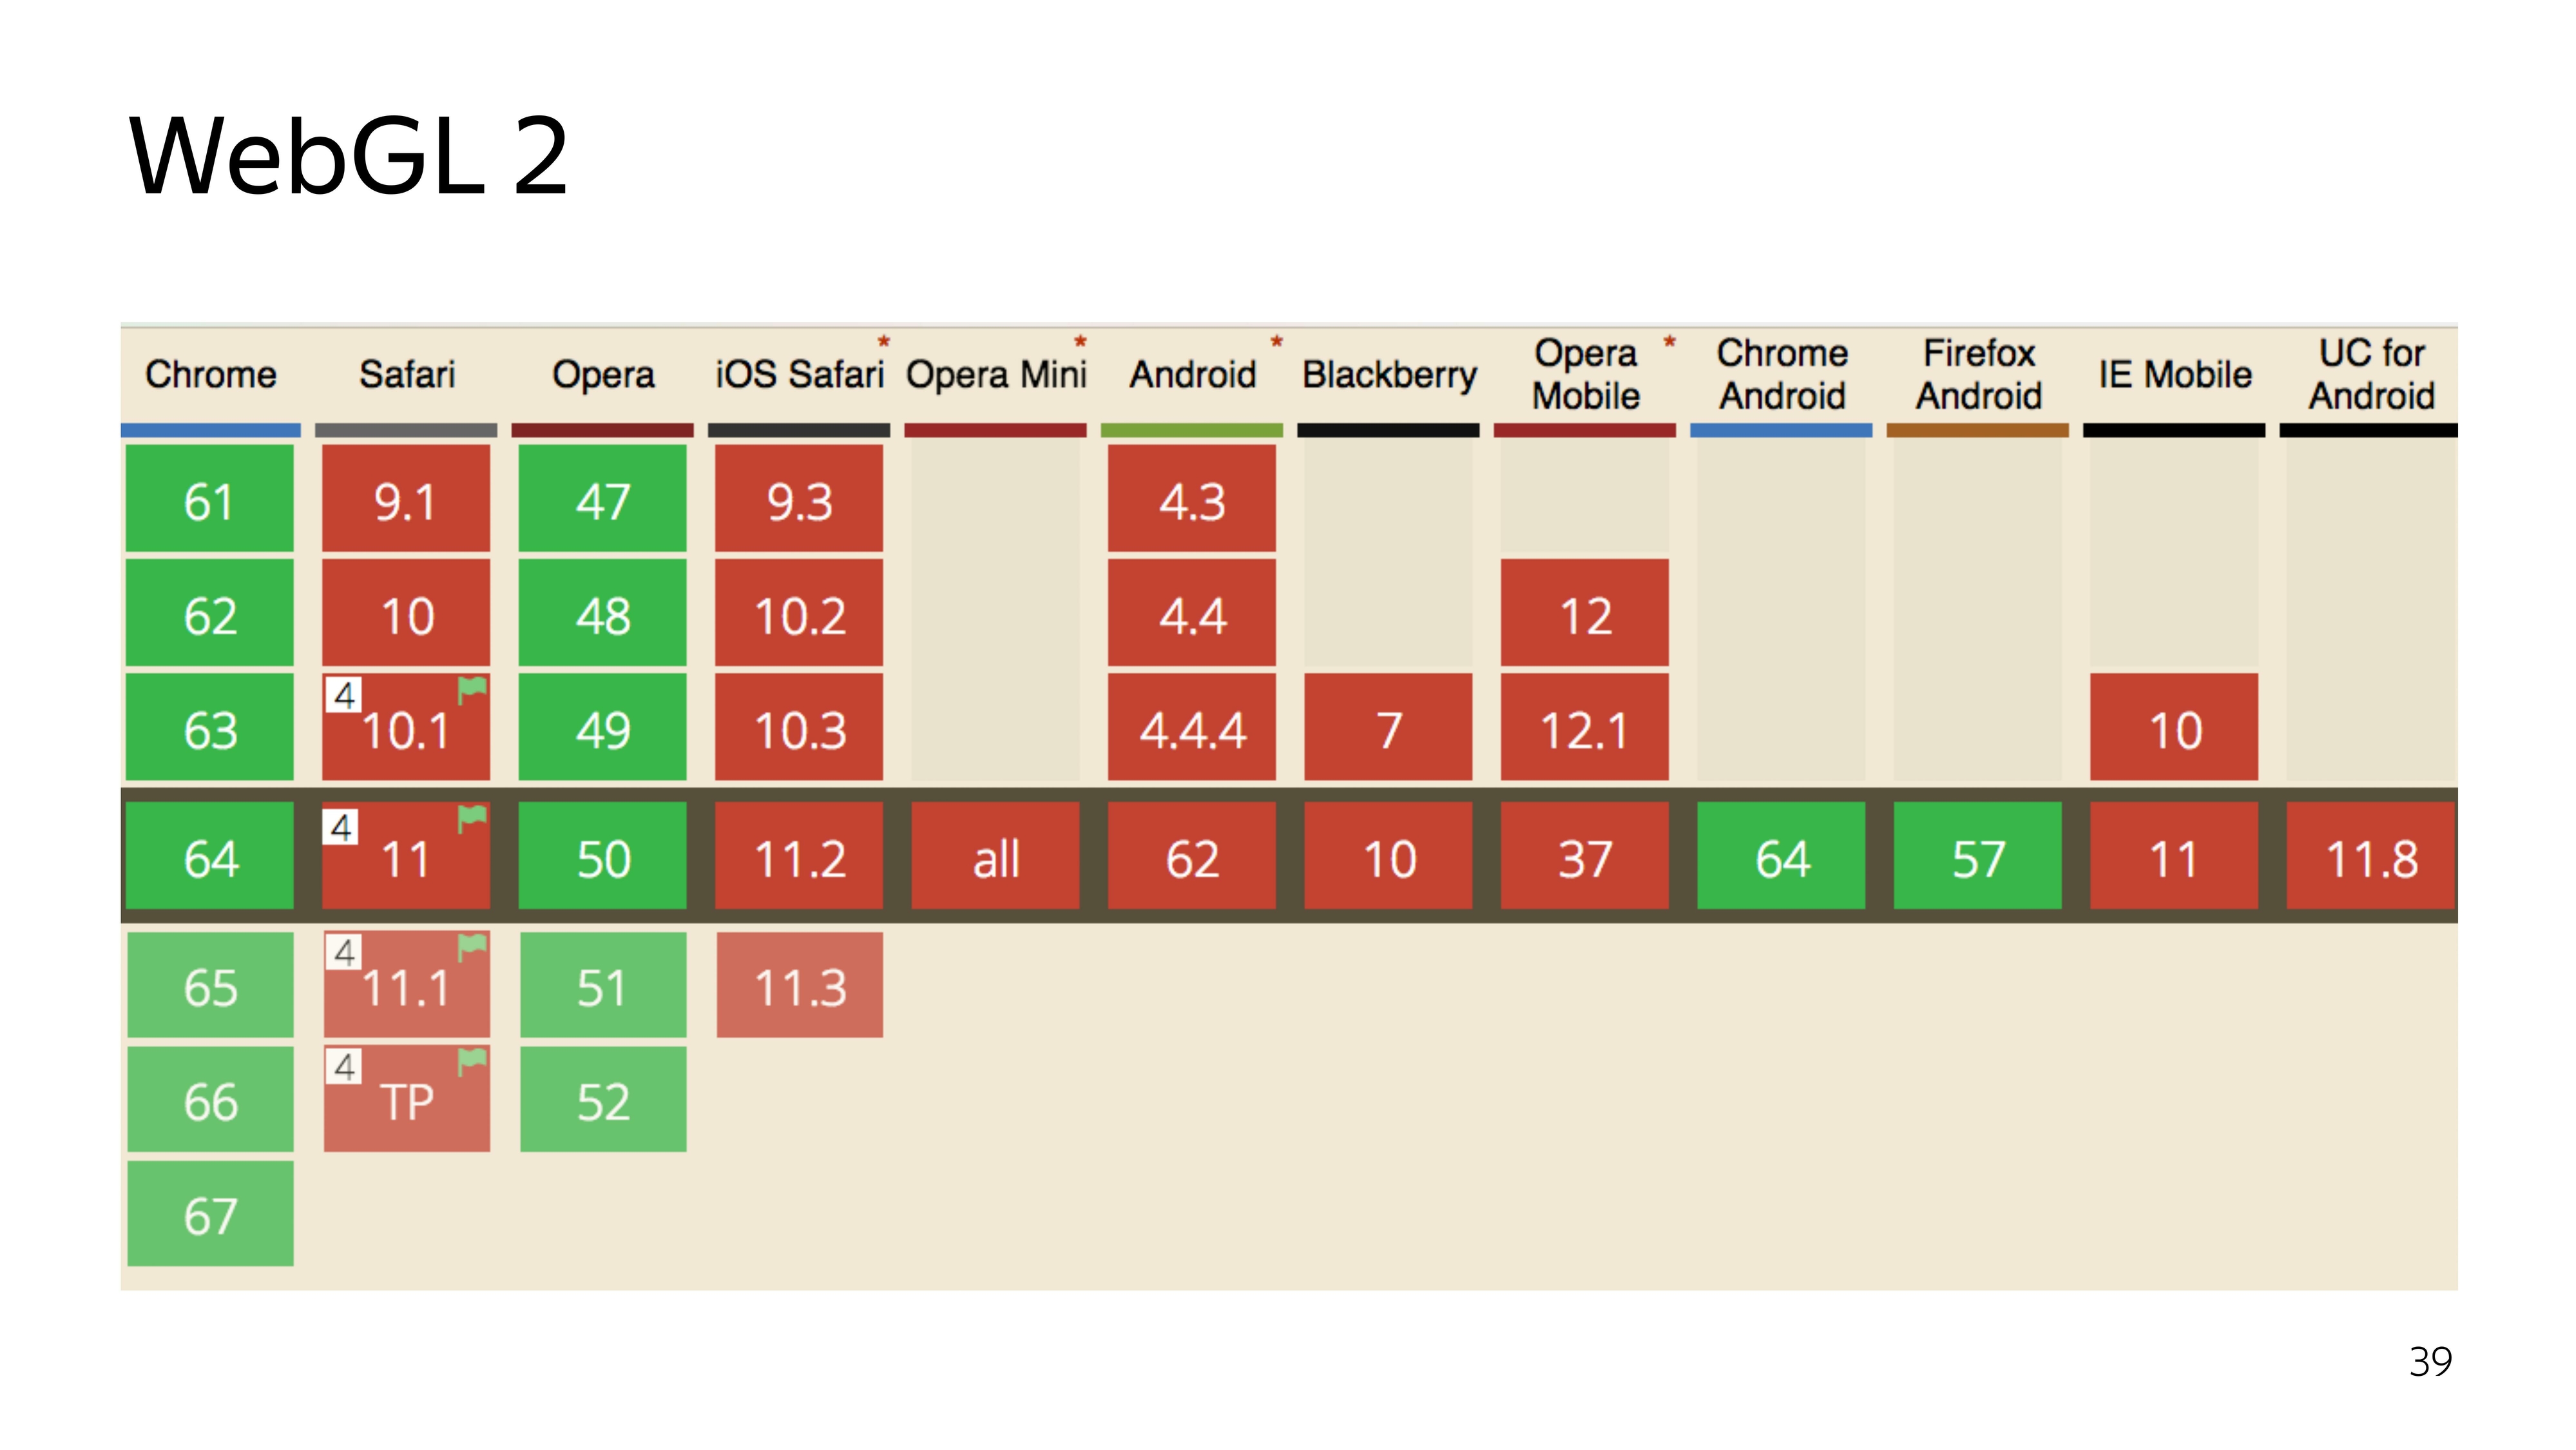
There are currently two versions of the WebGL technology. The second version, which is cool, has a high modern version of the programming language in which the program runs in the graphics adapter, can perform straightforward computations, and not just rendering. But it has poor compatibility.
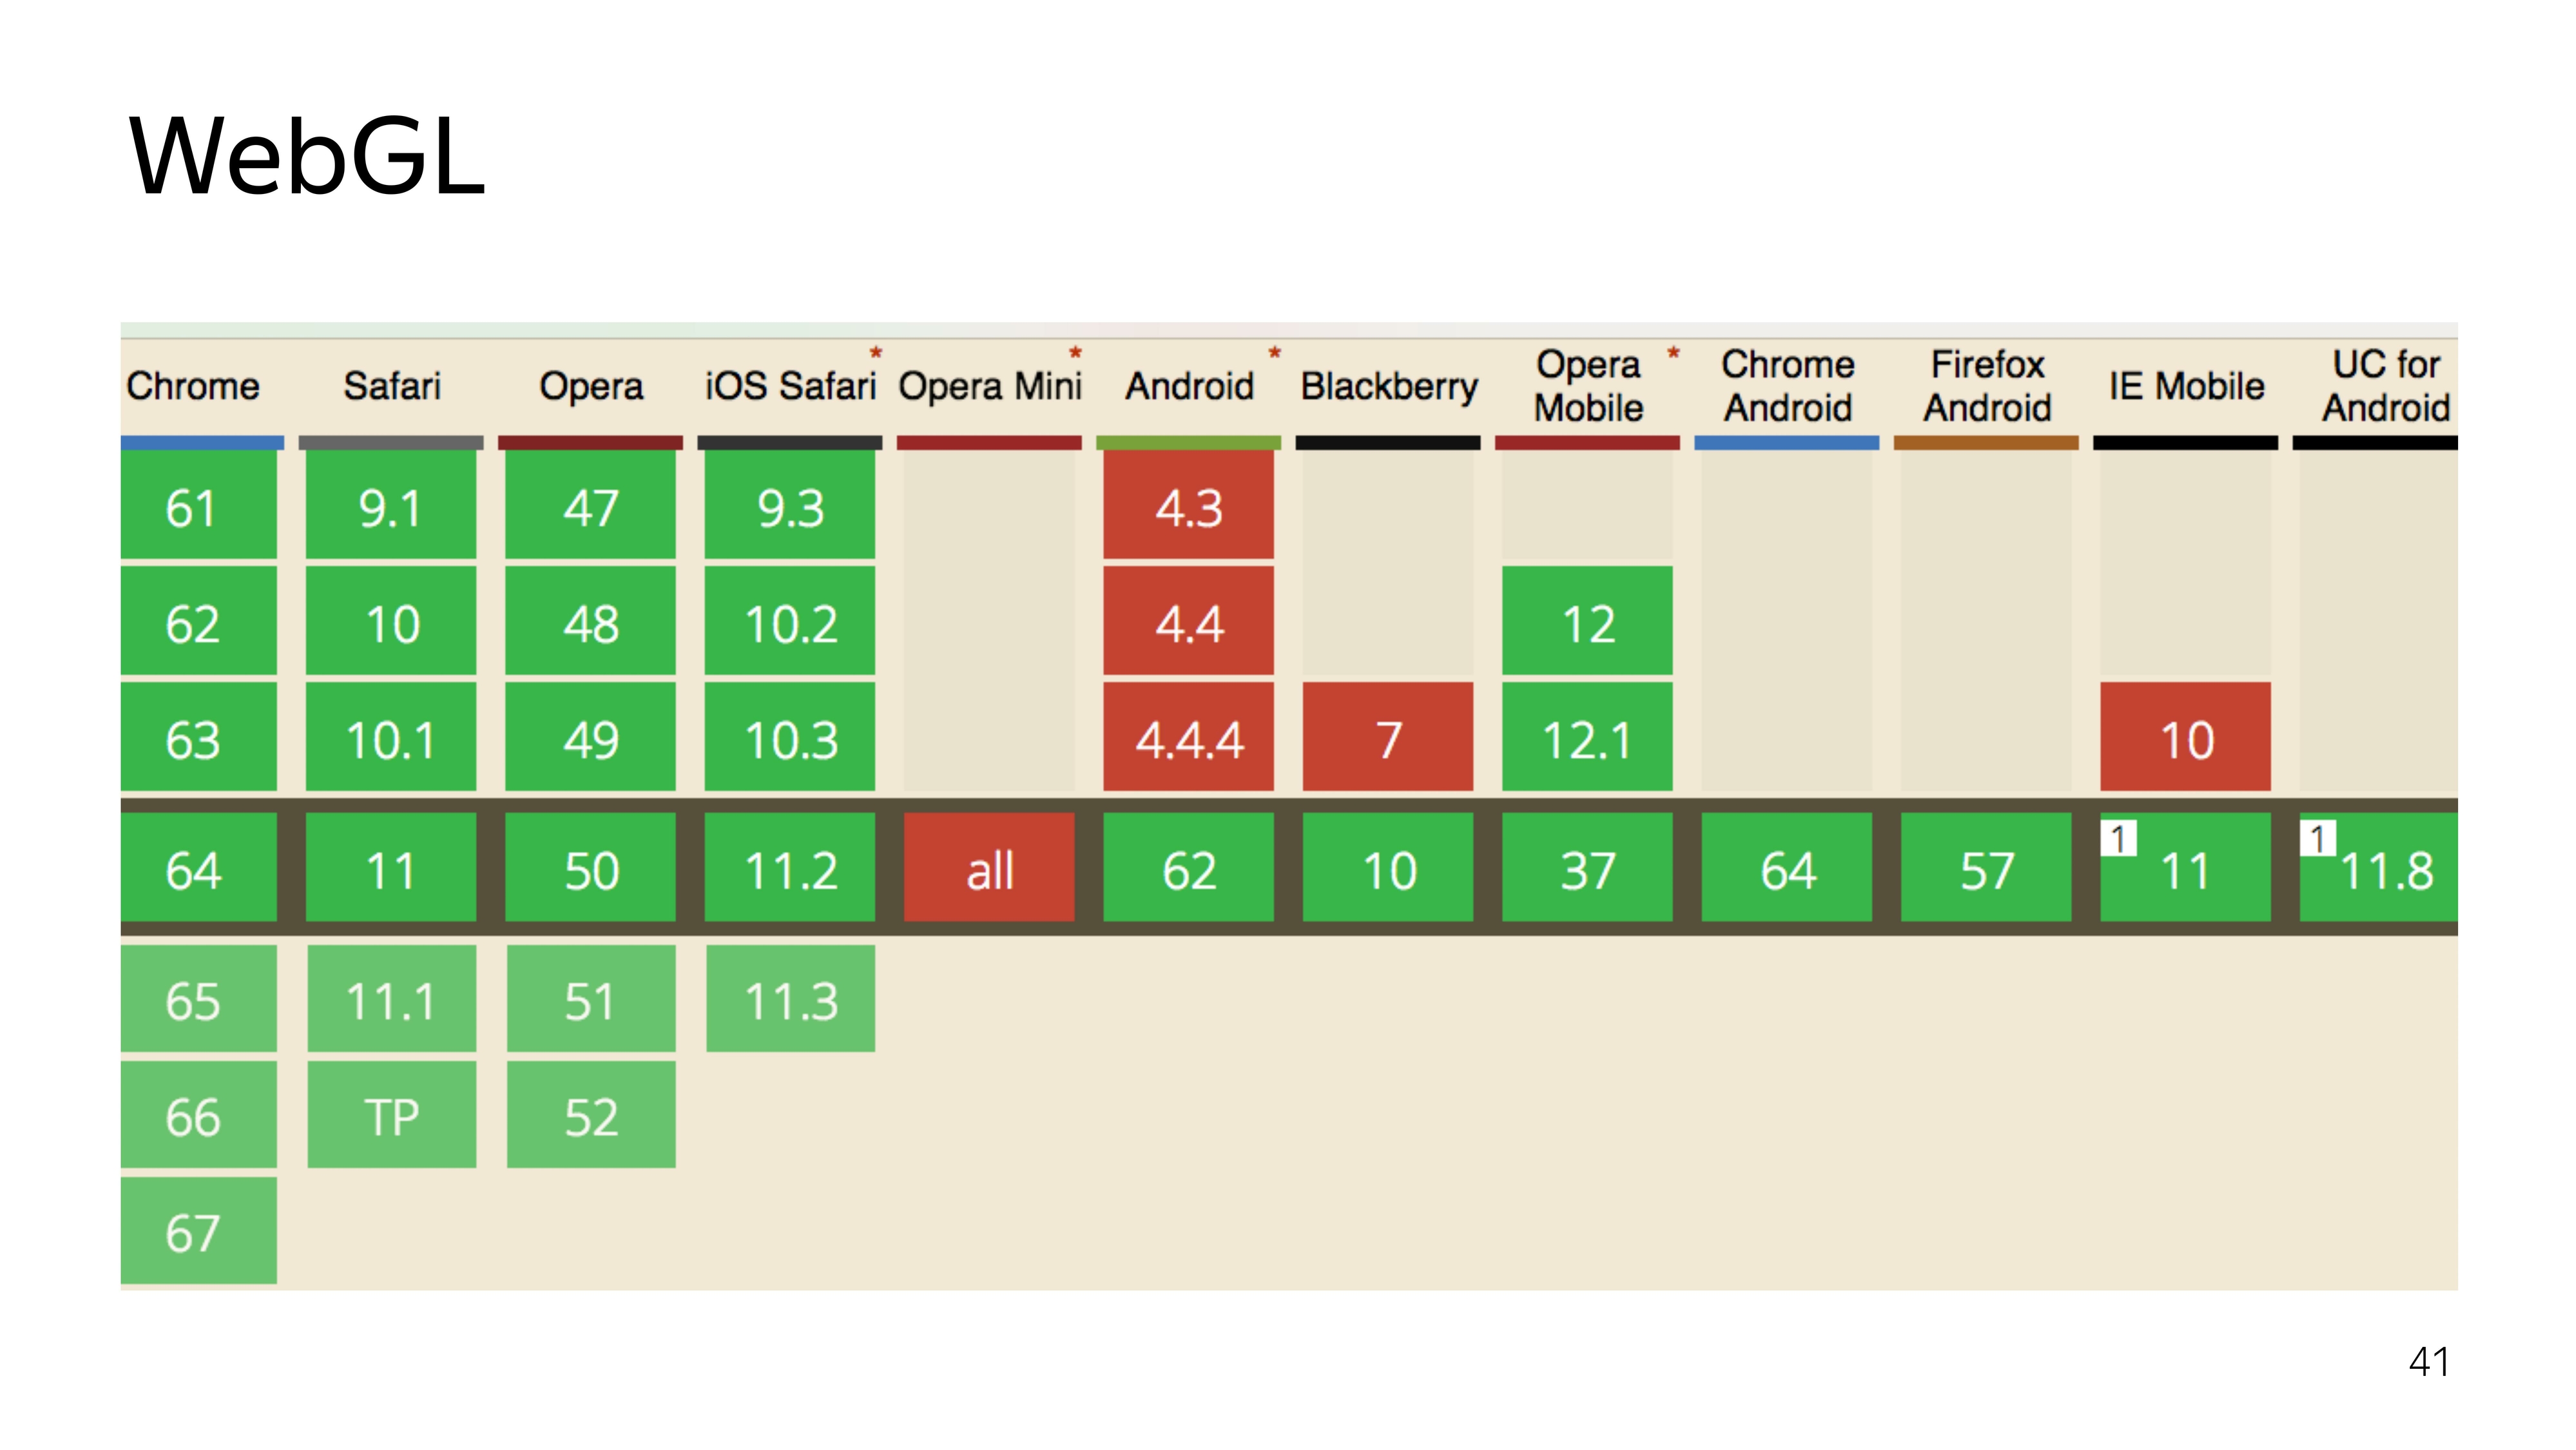
Well, we decide to use the old proven WebGL 1, which has good support, except Opera Mini, which nobody needs.
WebGL is a two-piece thing. This is JS, which executes the state of the programs that run on the graphics card. And there are components that run right on the graphics card.
Let's start with JS. WebGL is just the appropriate context for the canvas element. Moreover, upon receiving this context, it is not just a specific object that is allocated, iron resources are allocated. And if we run something beautiful on WebGL in the browser, and then decide to play Quake, then it is quite possible that these resources will be lost, and the context may be lost, and your entire program will break.

Therefore, when working with WebGL, you also need to listen to the loss of context and be able to restore it. Therefore, I stressed that init is.
Then all the work of JS is to assemble programs that run on the GPU, send them a graphic card, set some parameters and say “draw”.
In WebGL, if you look at the context element itself, you see a bunch of constants. These constants mean references to addresses in memory. They are not really constants in the process of the program. Because if the context is lost and restored again, another address pool can be allocated, and these constants will be different for the current context. Therefore, almost all operations in WebGL on the JS side are performed through utilities. Nobody wants to do the routine work of searching for addresses and other garbage.

We proceed to what is performed on the video card itself - a program consisting of two sets of instructions written in C-like language GLSL. These instructions are called the vertex shader and the fragment shader. A program is created from their pair.

What is the difference between these shaders? The vertex shader sets the surface on which something should be drawn. After the primitive is set, which needs to be painted over, a fragment shader is called that falls into this range.

In the code, it looks like this. In the shader there is a section for declaring variables that are set outside, from JS, their type and name are determined. And also the main section, which executes the code needed for this iteration.
The vertex shader is in most cases expected to set the gl_Position variable to some coordinate in four-dimensional space. This is x, y, z and the width of the space, which is not really necessary to know at the moment.
The fragment shader waits for the color of a particular pixel to be set.
In this example, our pixel color is selected from the attached texture.

To transfer it to JS, it is enough to wrap the source code of the shaders in variables.
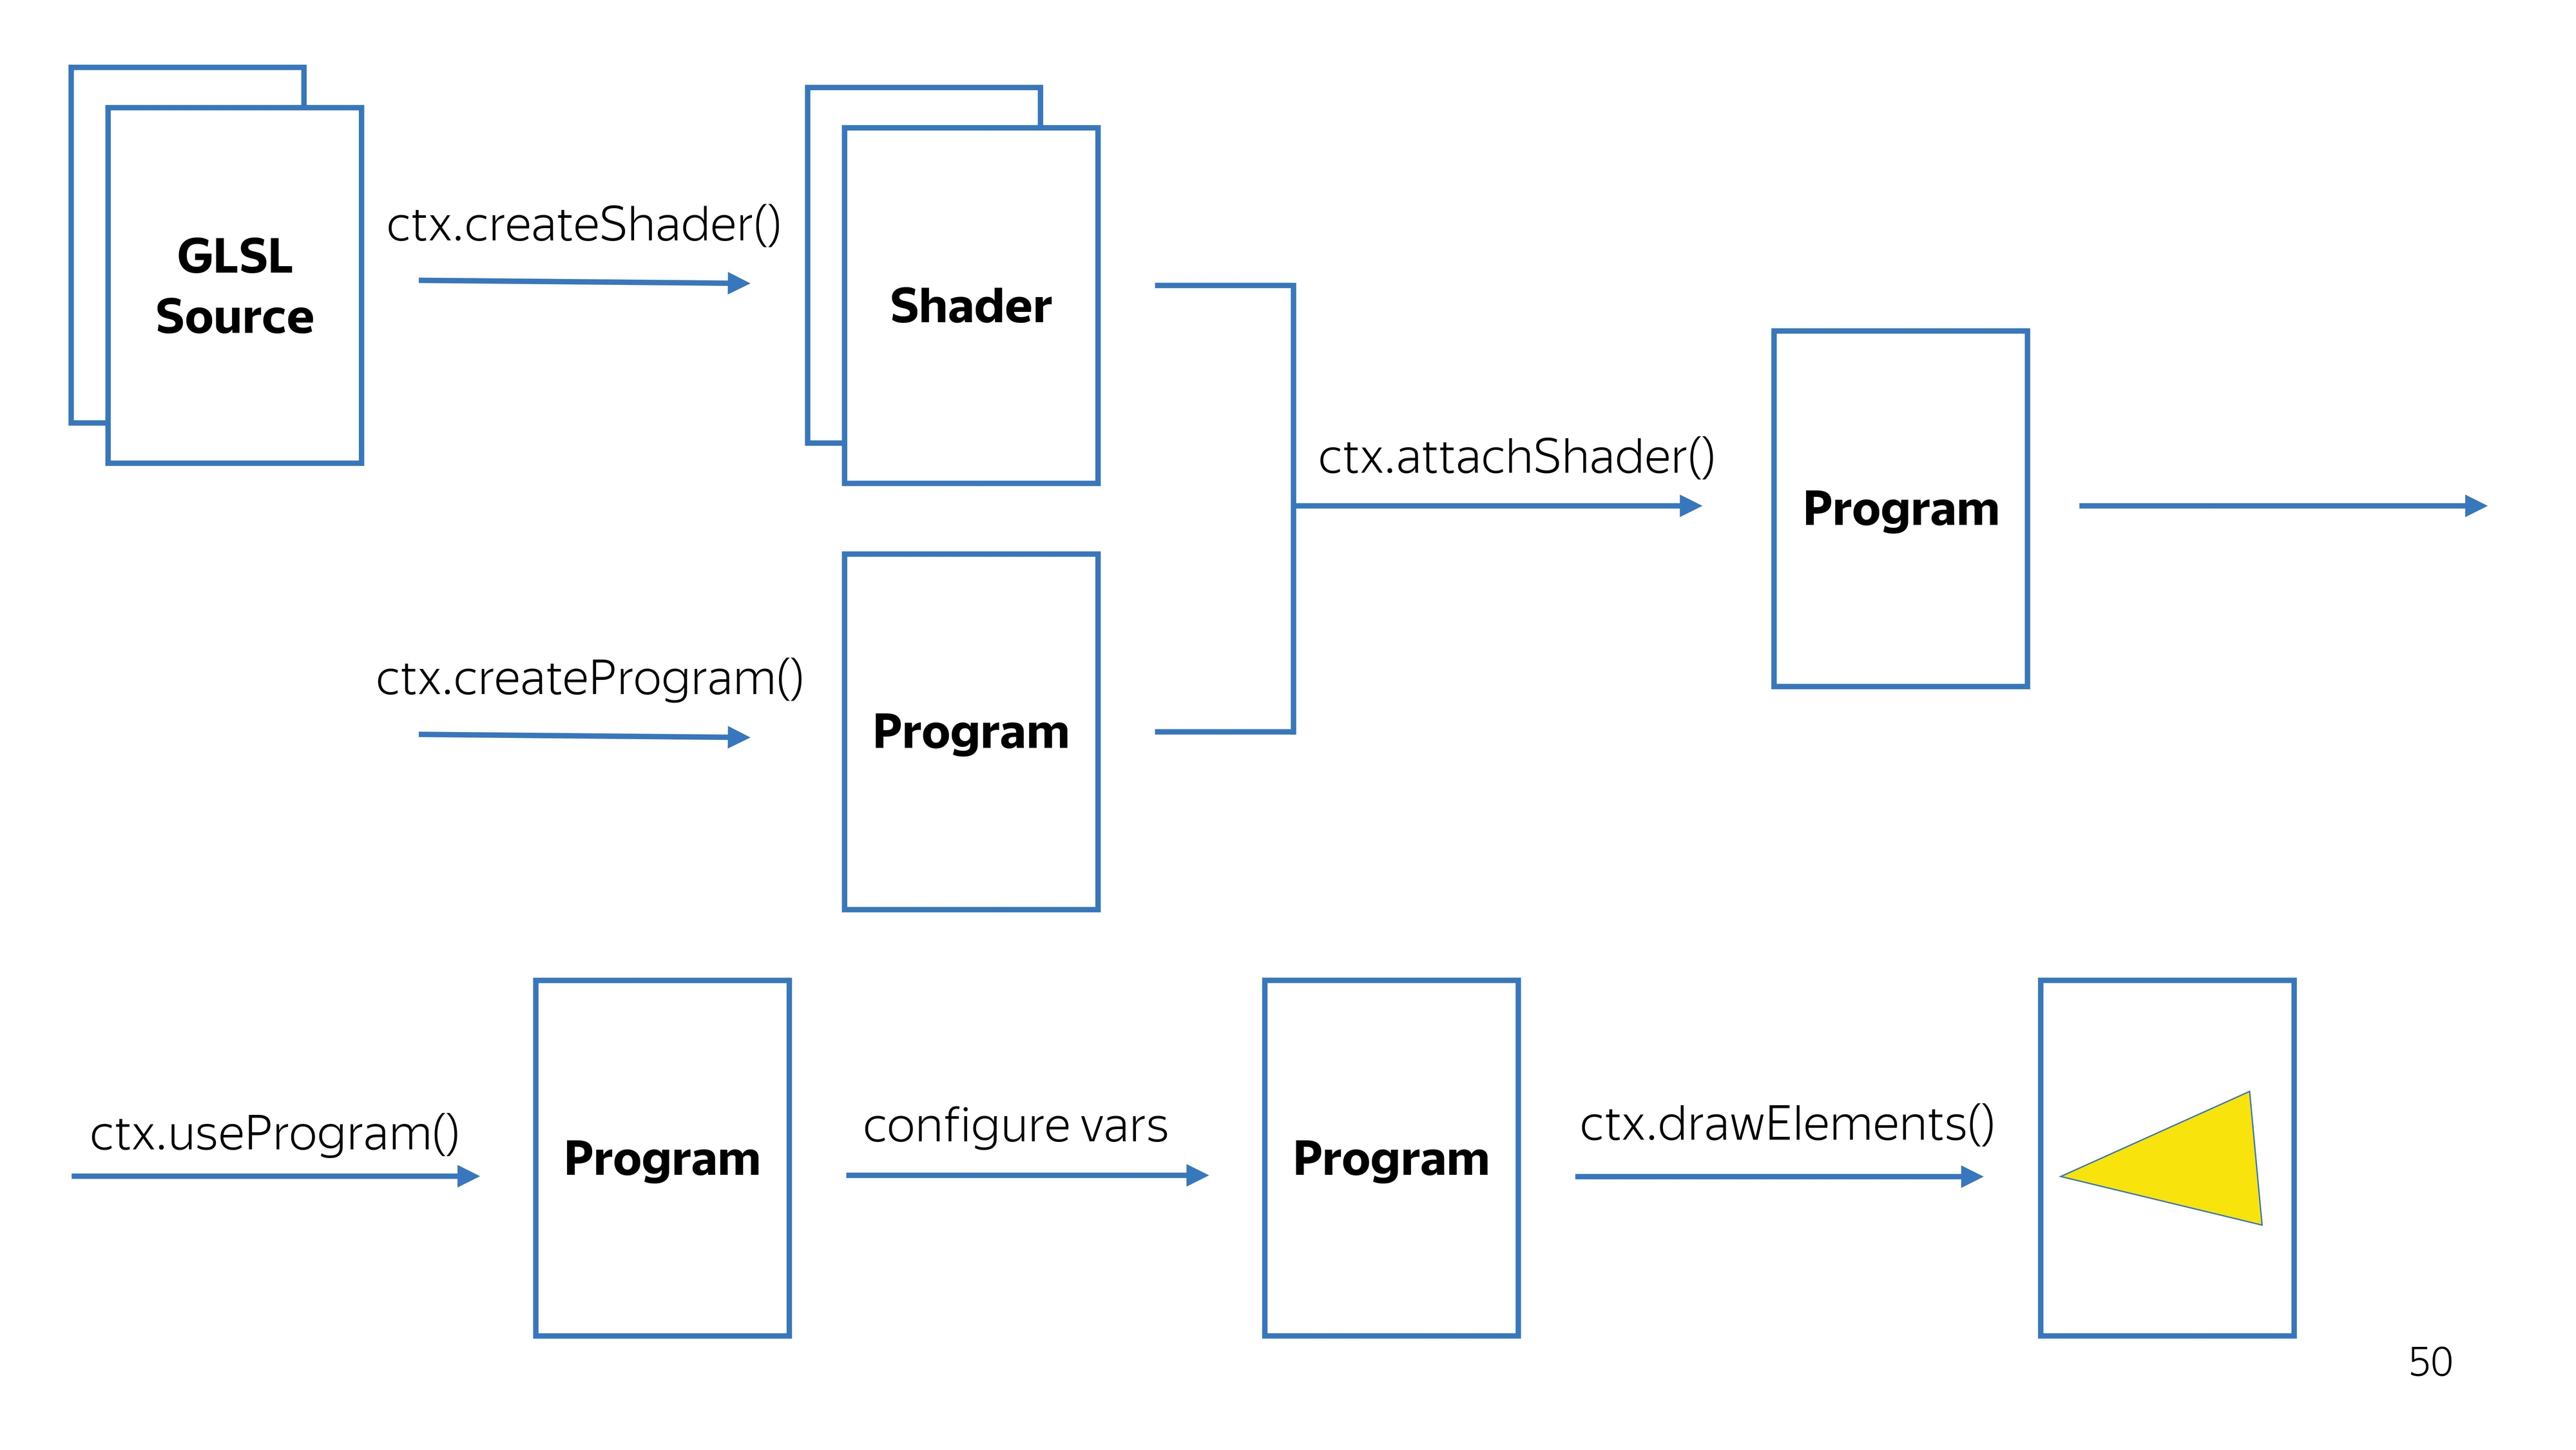
Further, these variables are converted to shaders. This is a WebGL context, we create shaders from source codes, in parallel we create a program, we tie a pair of shaders on the program. We get a workable program.
Along the way, we check that the shader compilation was successful, that the program was successfully assembled. We say that you need to use this program, because there may be several programs for different drawing values.
We configure it, and we say to draw. It turns out some kind of picture.

Crawled deeper. In the vertex shader, all calculations are performed in a space from -1 to 1, regardless of how large your output point is. For example, the space from -1 to 1 can occupy the entire screen of 1920x1080. To draw a triangle in the center of the screen, you need to draw a surface that covers the coordinate 0, 0. The
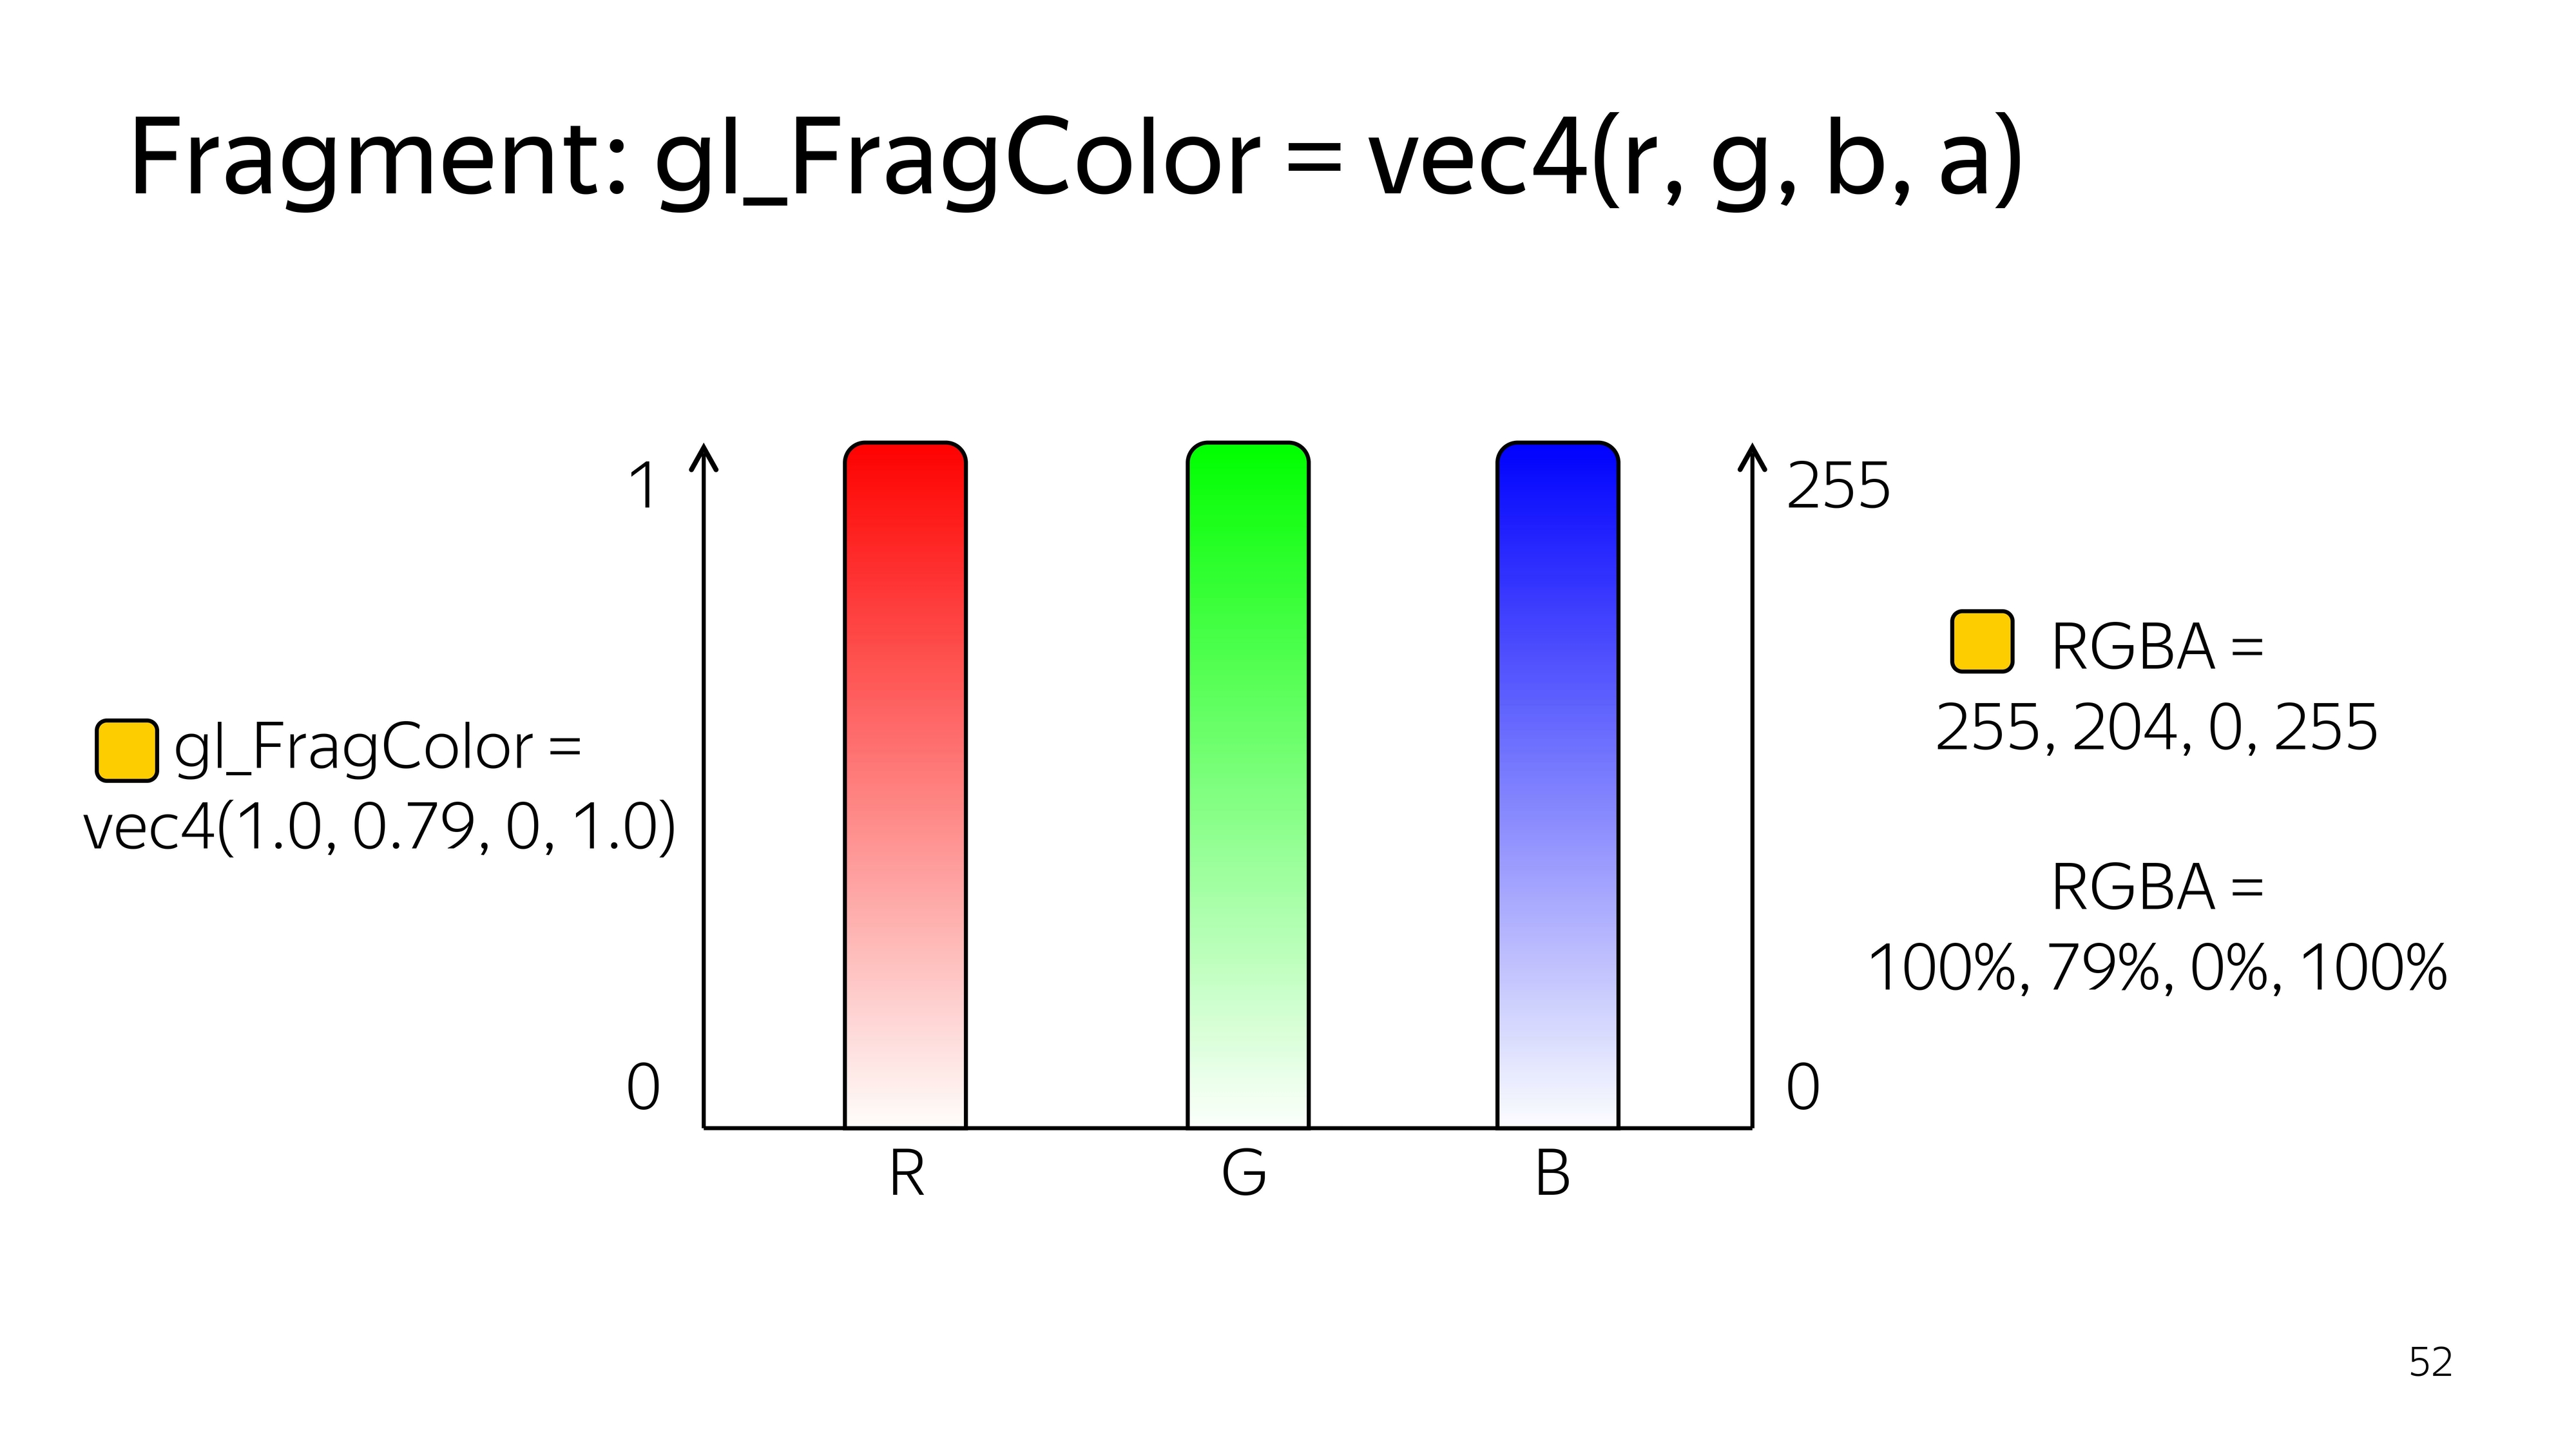
fragment shader works in the space from 0 to 1, and the colors here are given by four components: R, G, B, Alpha.
On the example of CSS, you might encounter a similar color record if you use percentages.
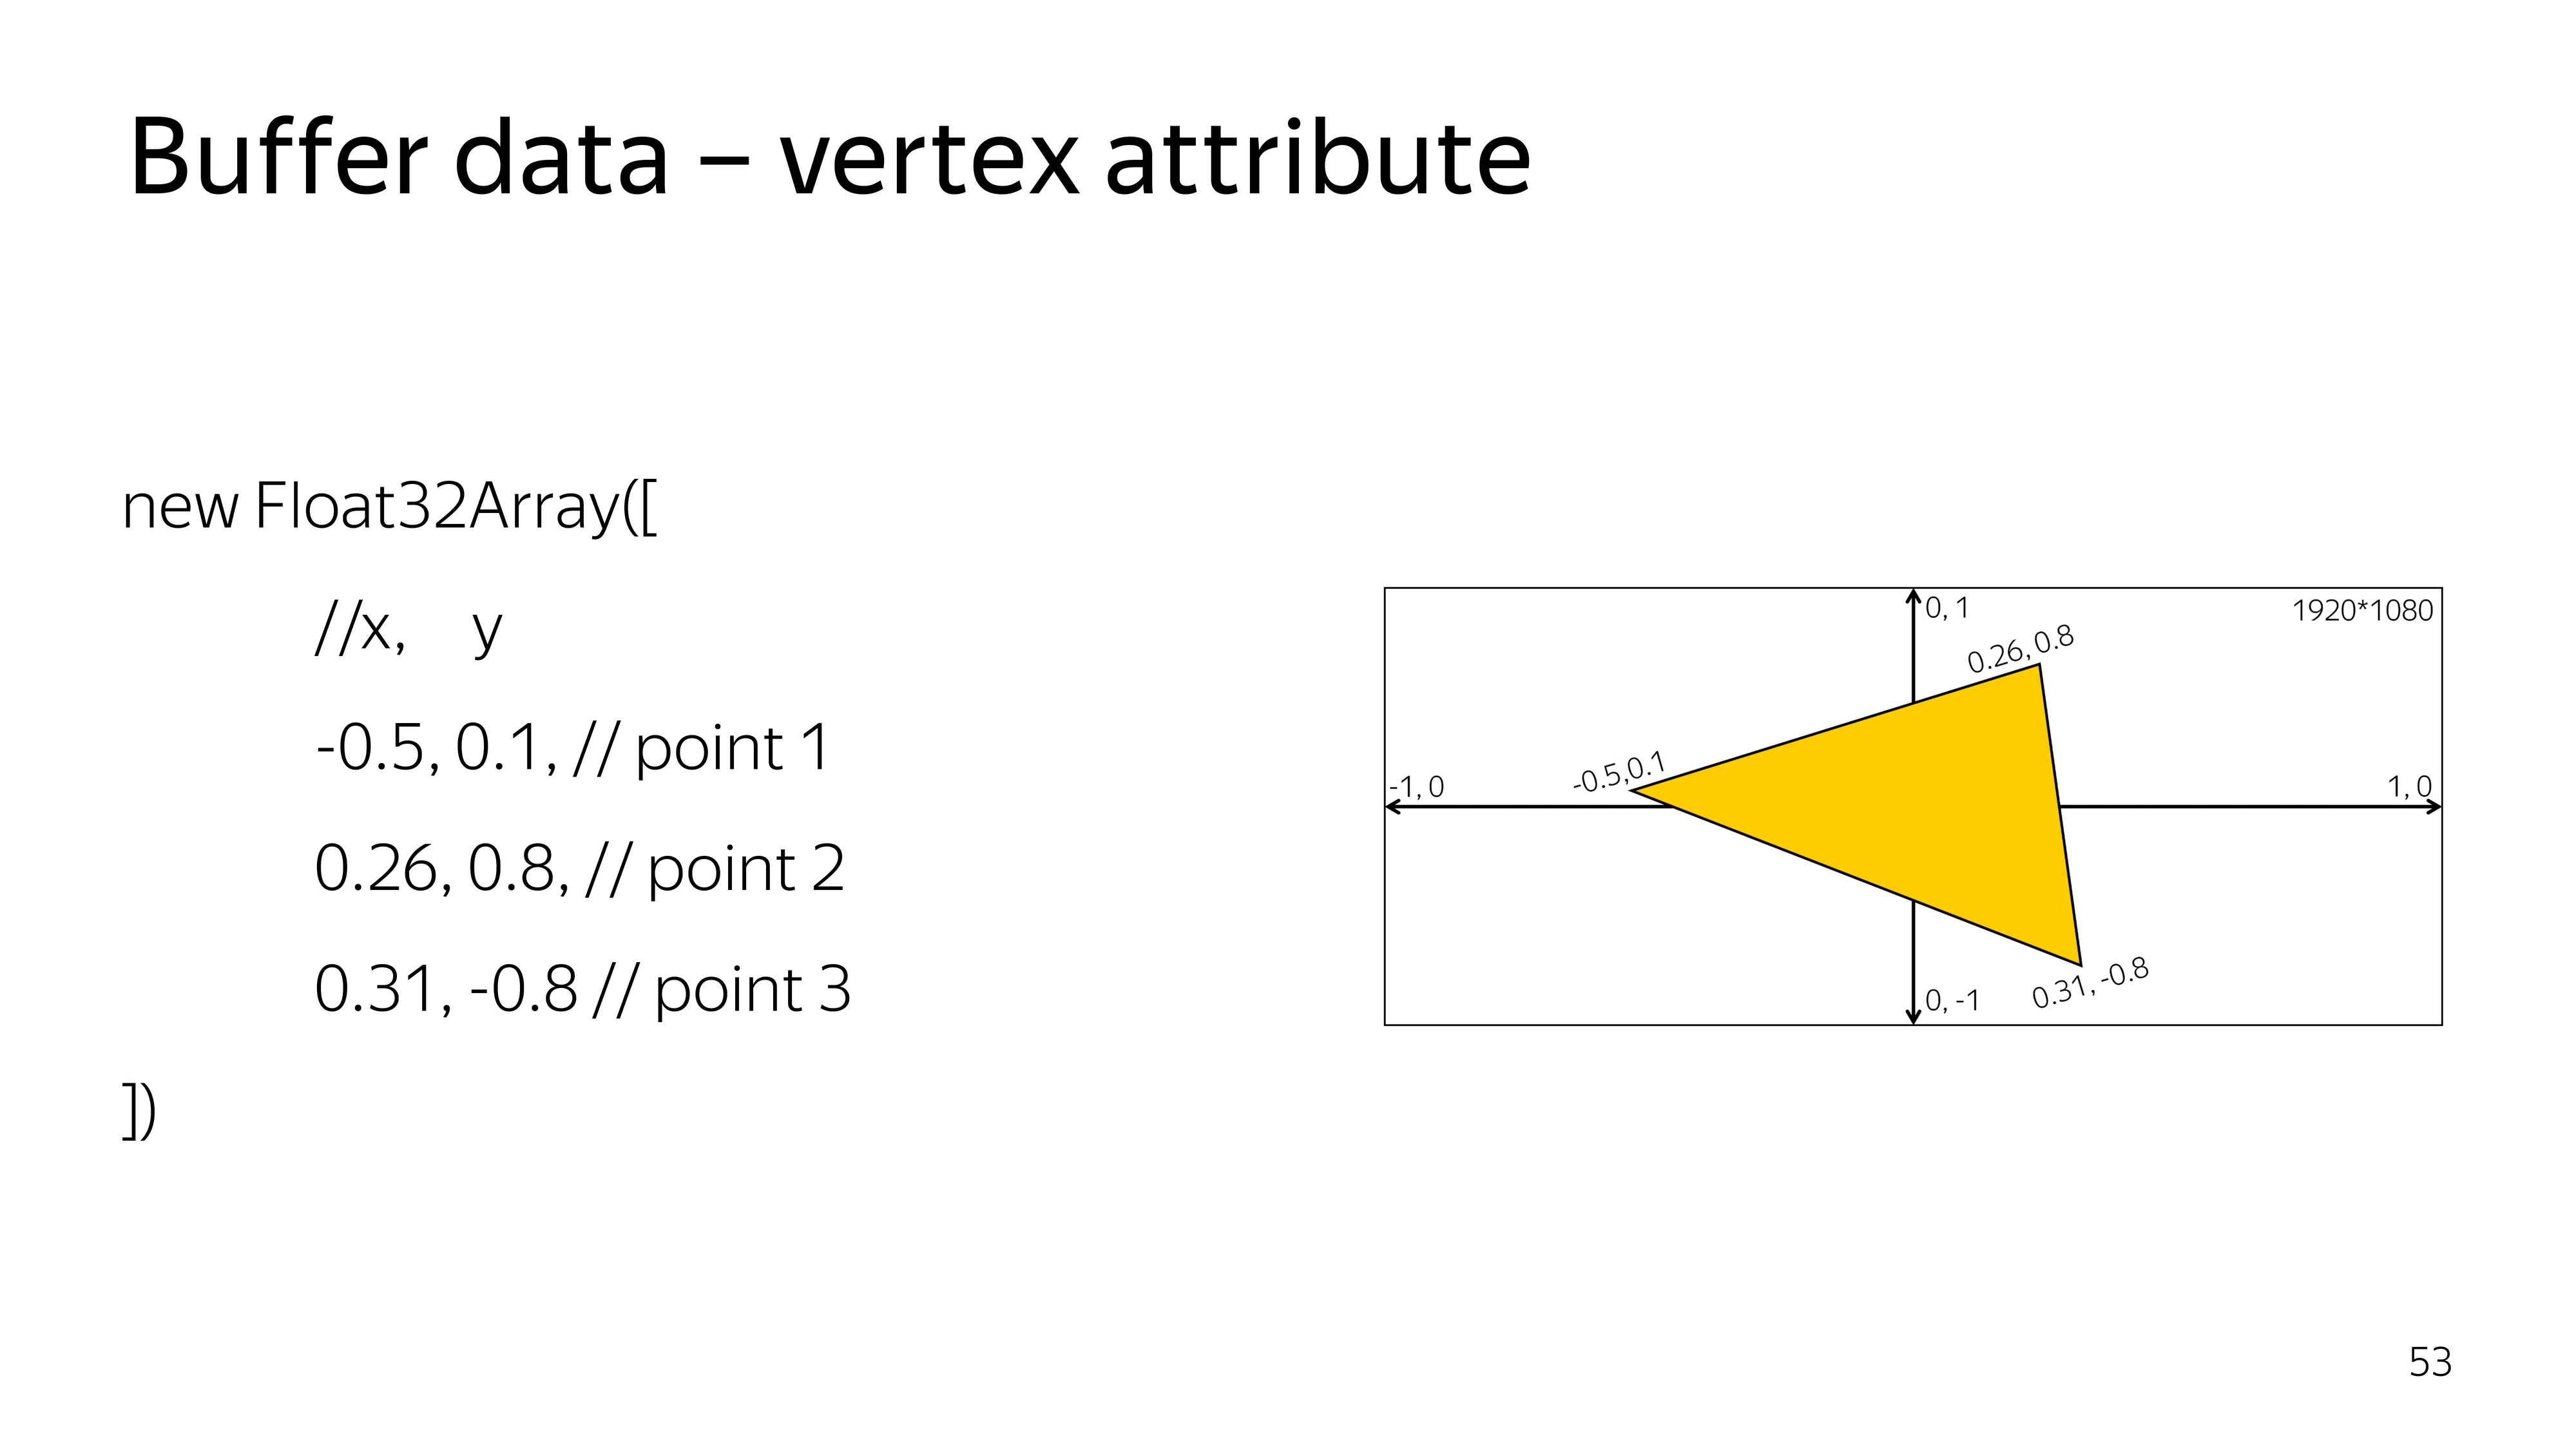
To draw something, you need to say what data you need to draw. Specifically for a triangle, we define a typed array of three vertices, each consisting of three components, x, y, and sufficient.
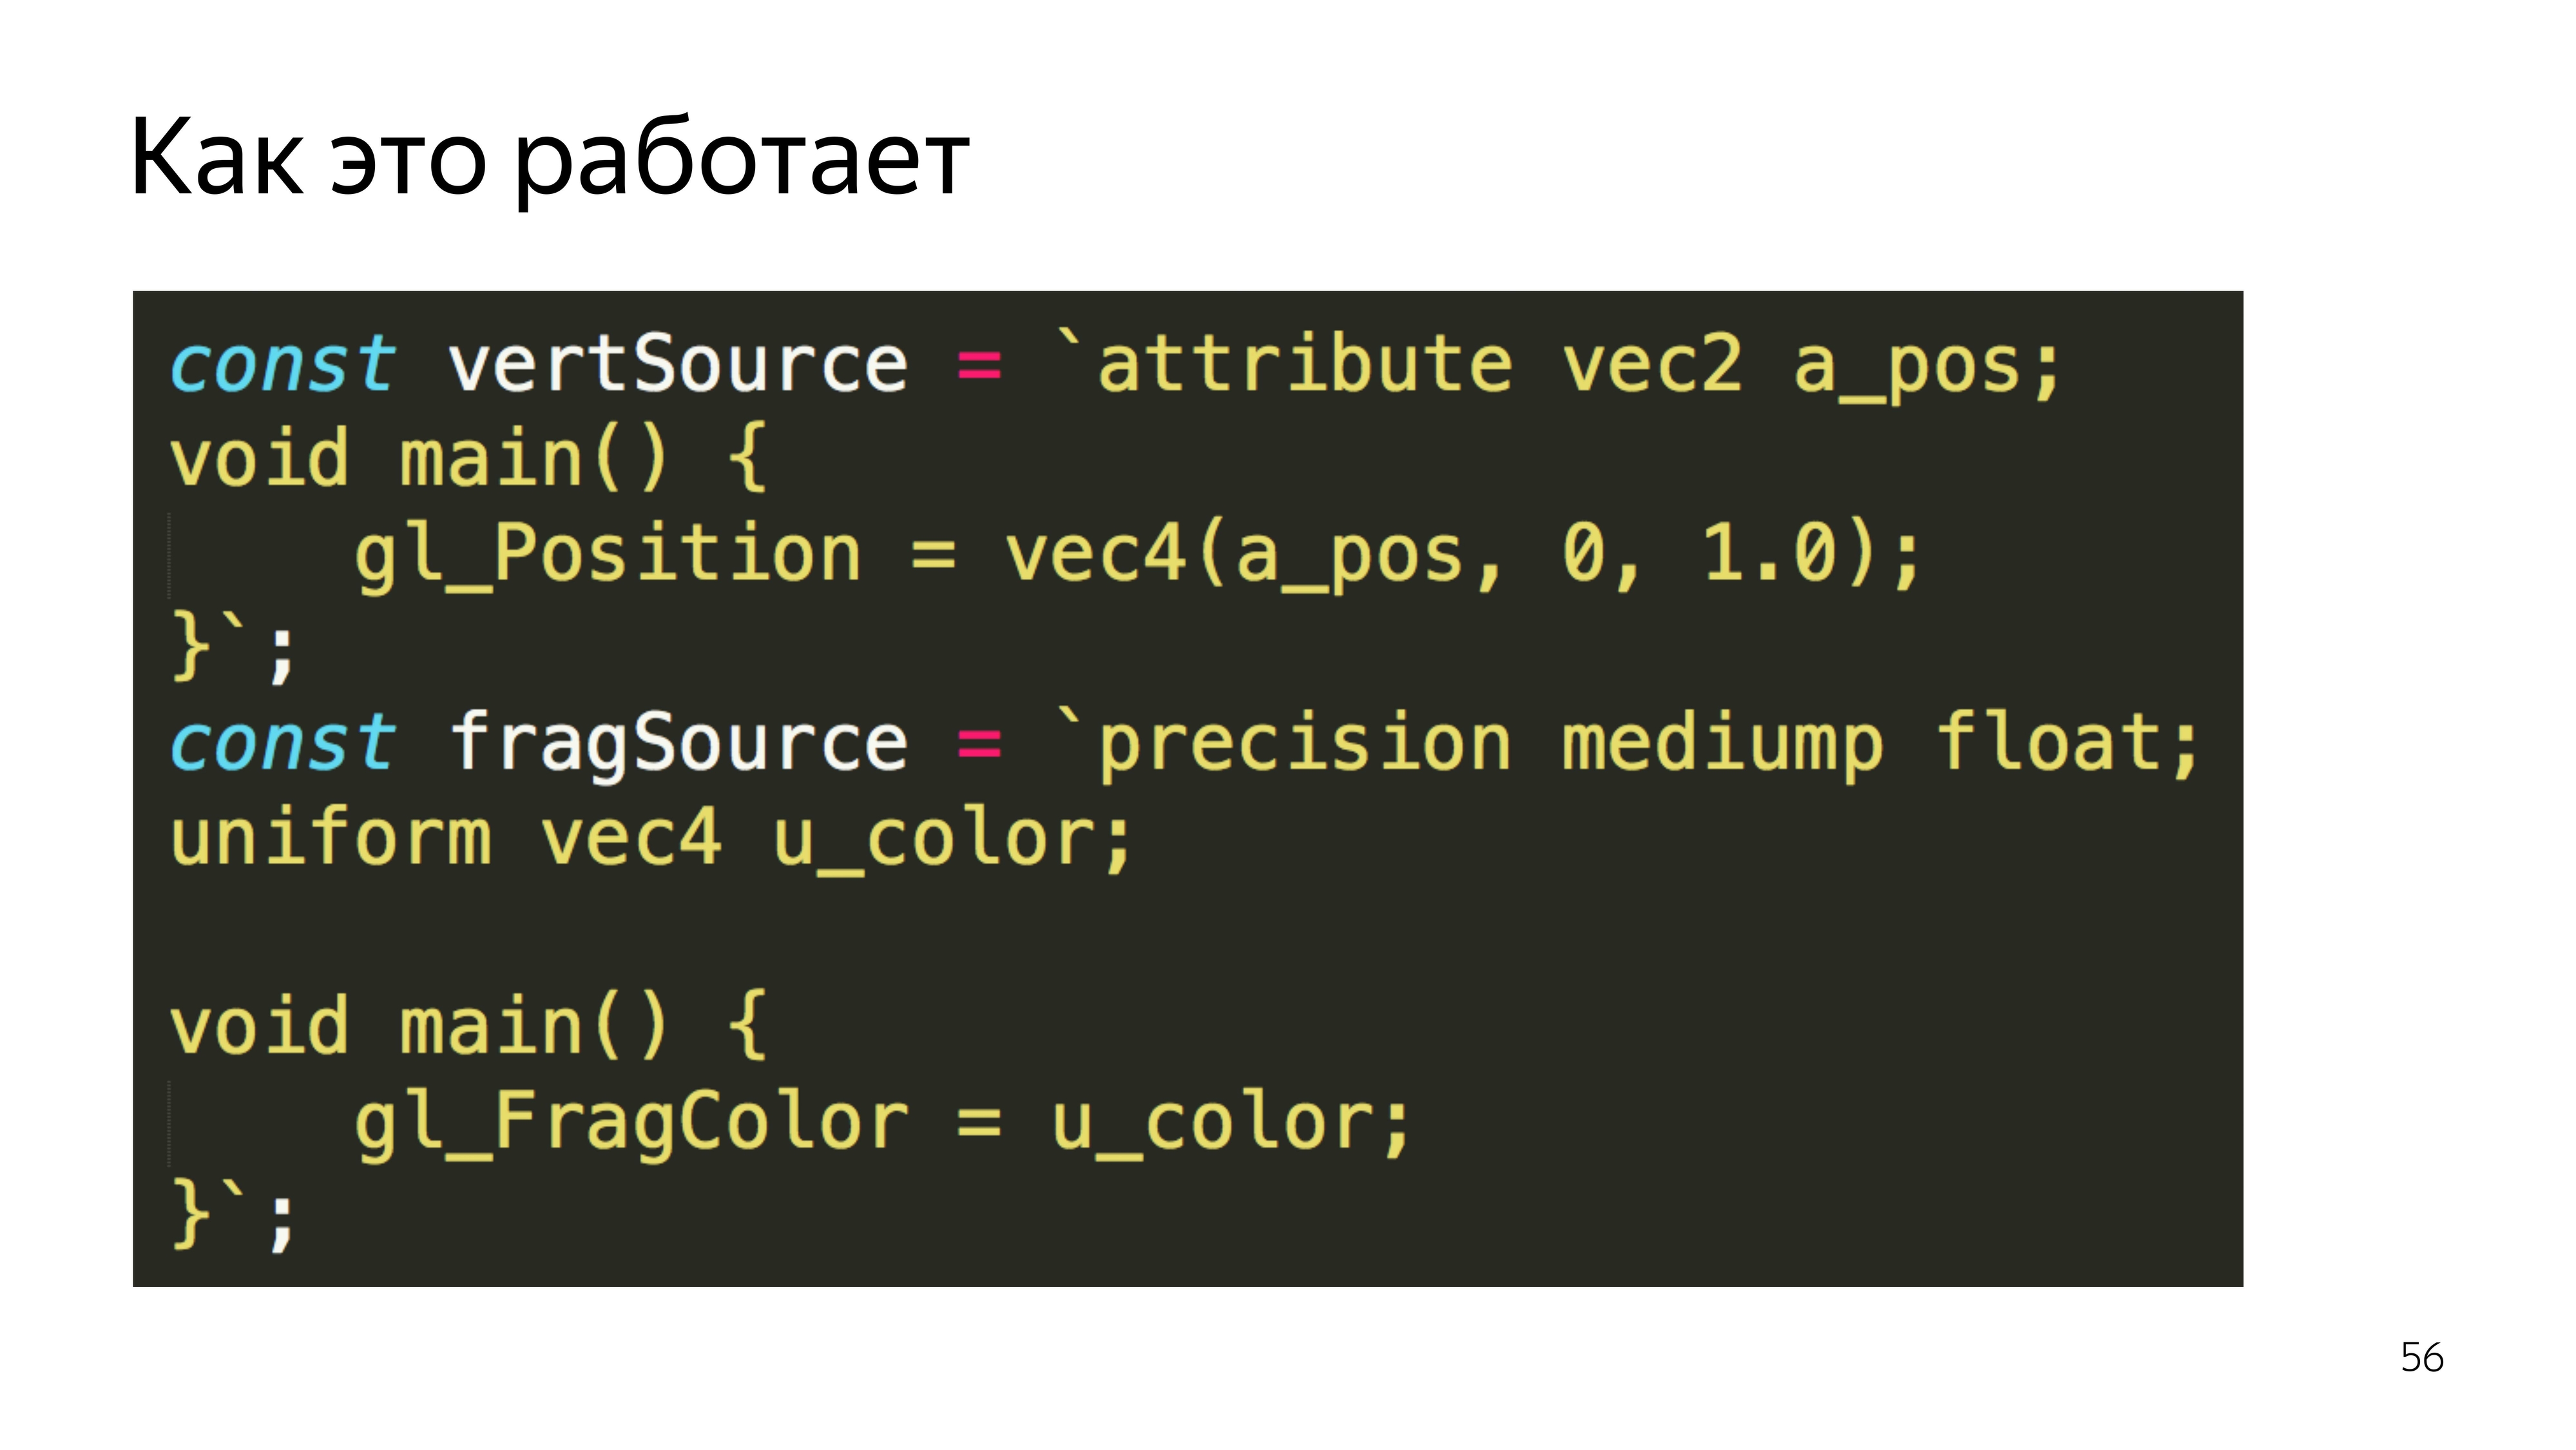
For such a case, the vertex shader looks like getting the current pair of points, coordinates, as well as setting this coordinate on the screen. Here, as it is, without transformations, we put a full stop on the screen.
The fragment shader can color out the constants passed from JS, also without additional calculations. Moreover, if some variables in the fragment shader are transmitted from the outside or from the previous shader, then you need to specify the accuracy. In this case, the average accuracy is enough, and almost always it is enough.
Go to JS. We assign the same shaders to variables and declare the function that will create these shaders. That is, a shader is created, the source is poured into it, and then compiled.
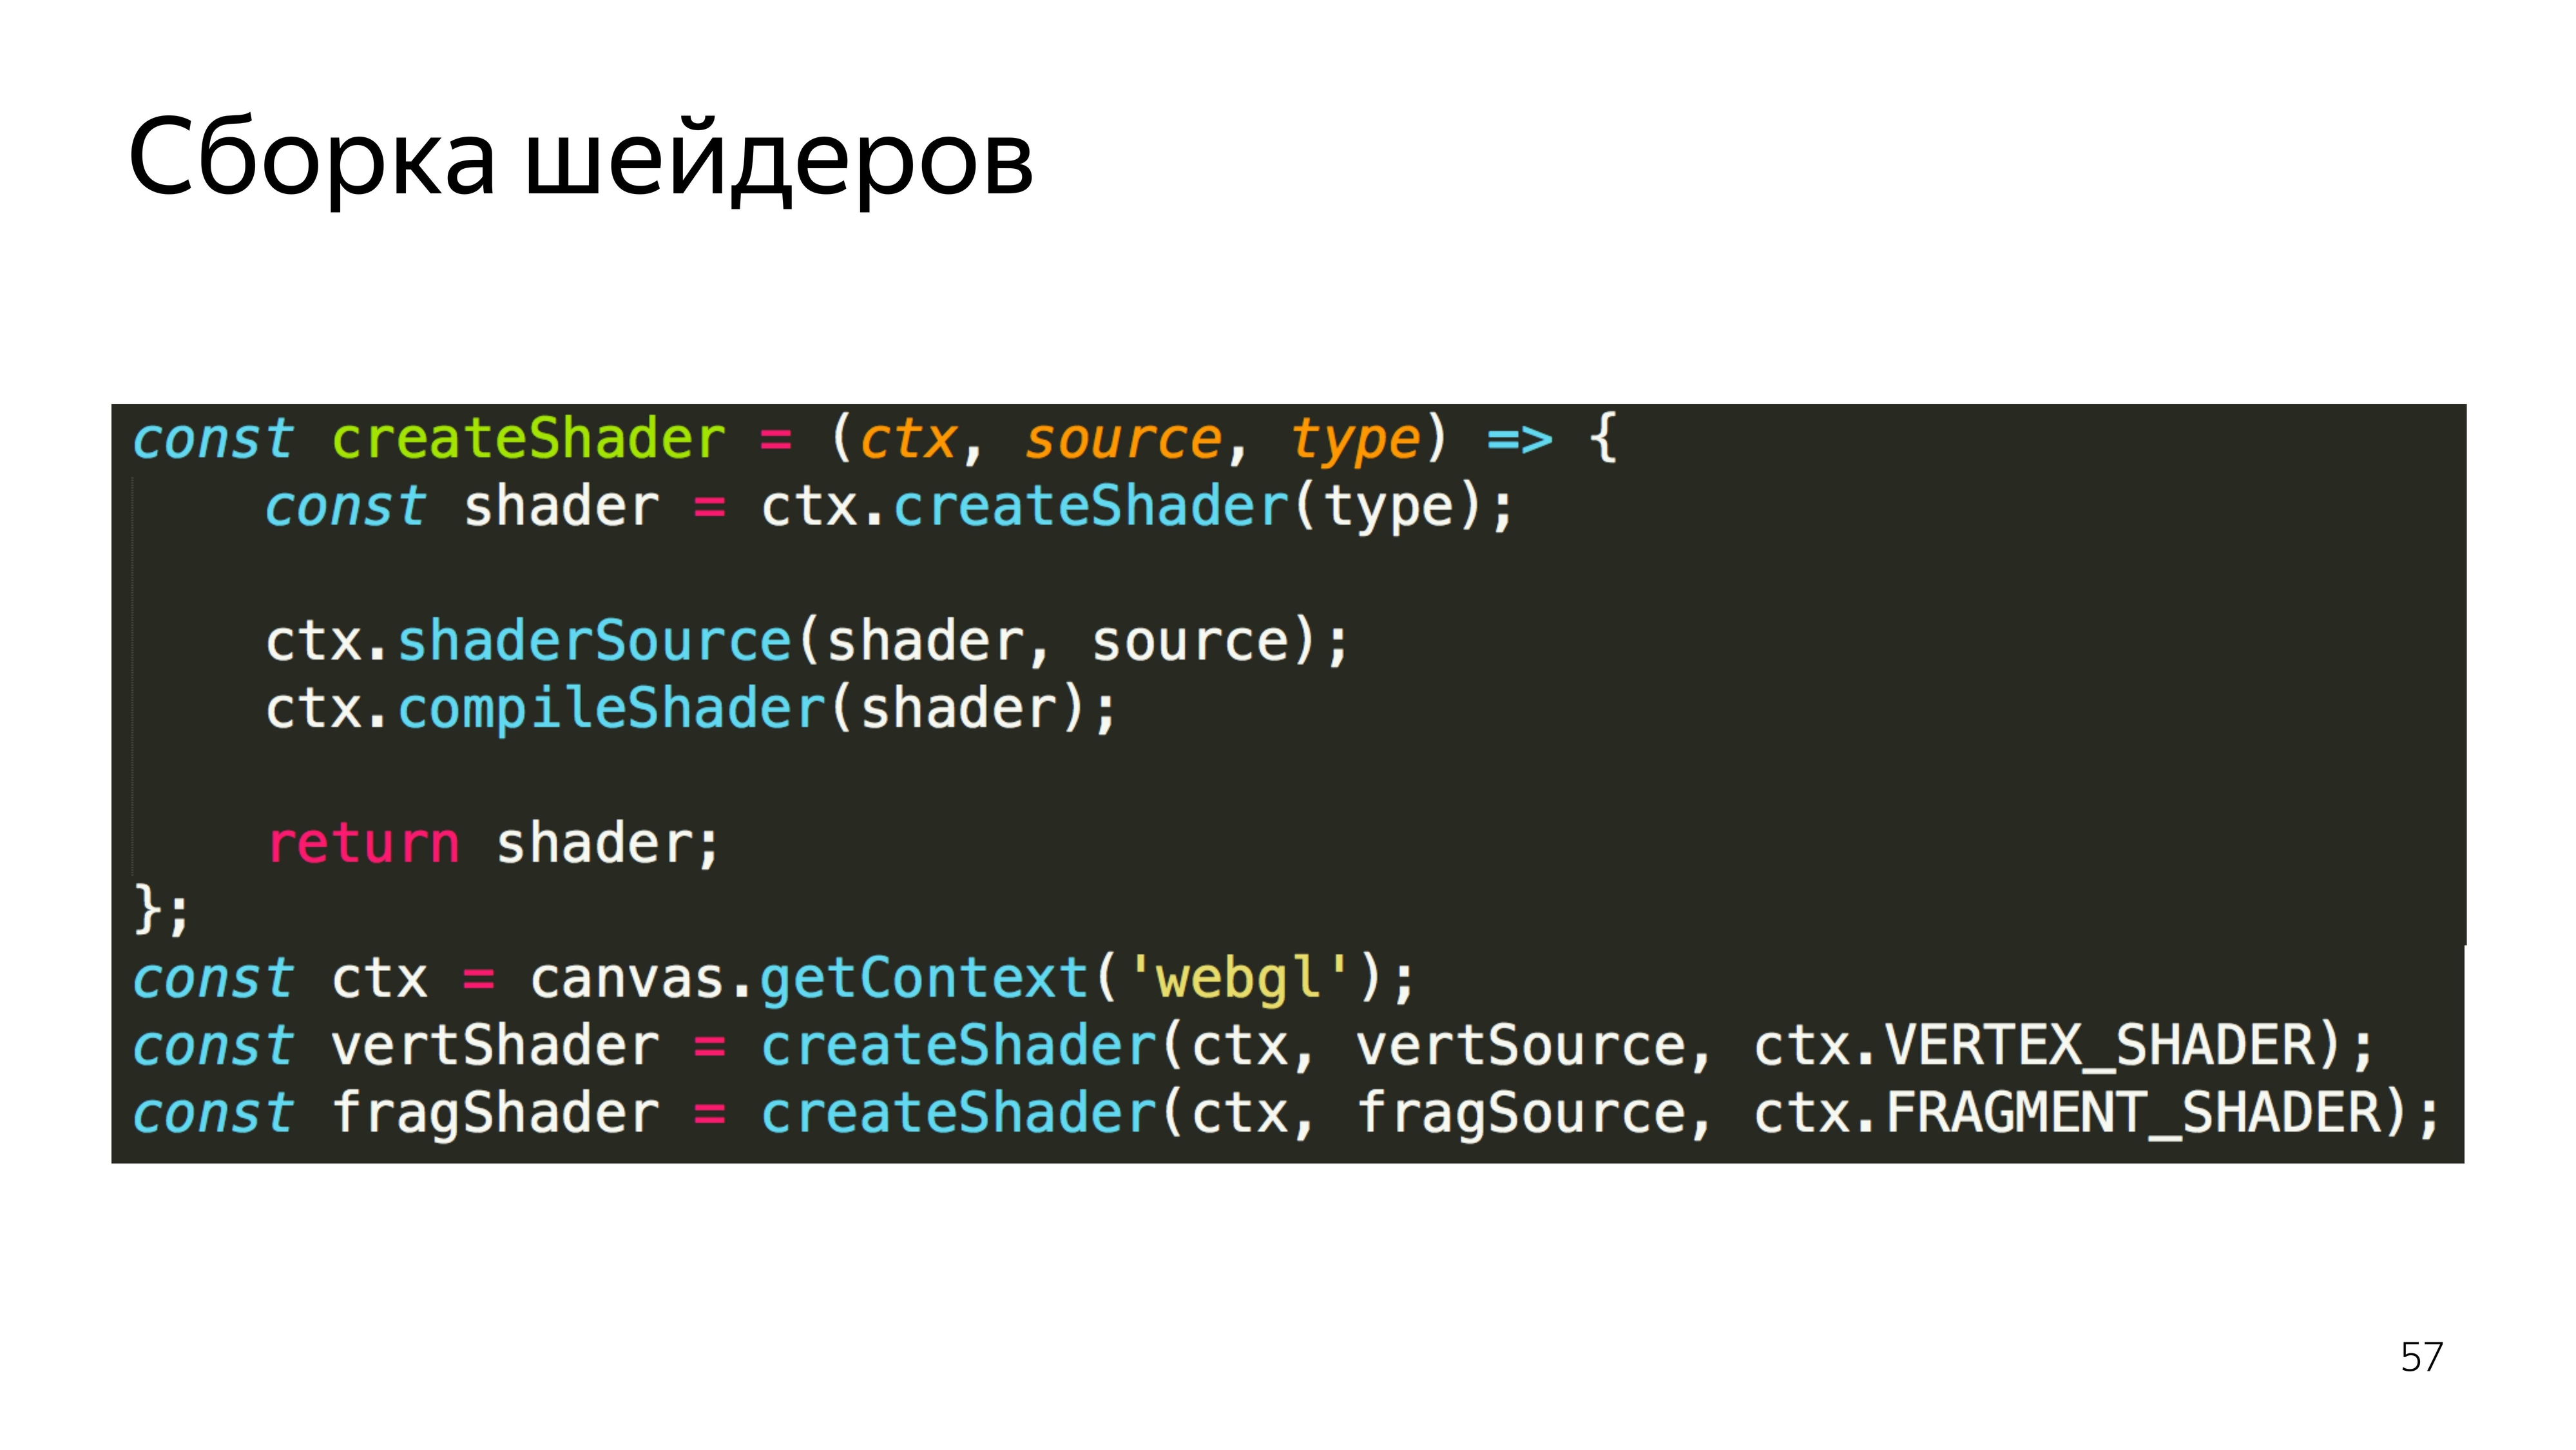
Make two shaders, vertex and fragment.
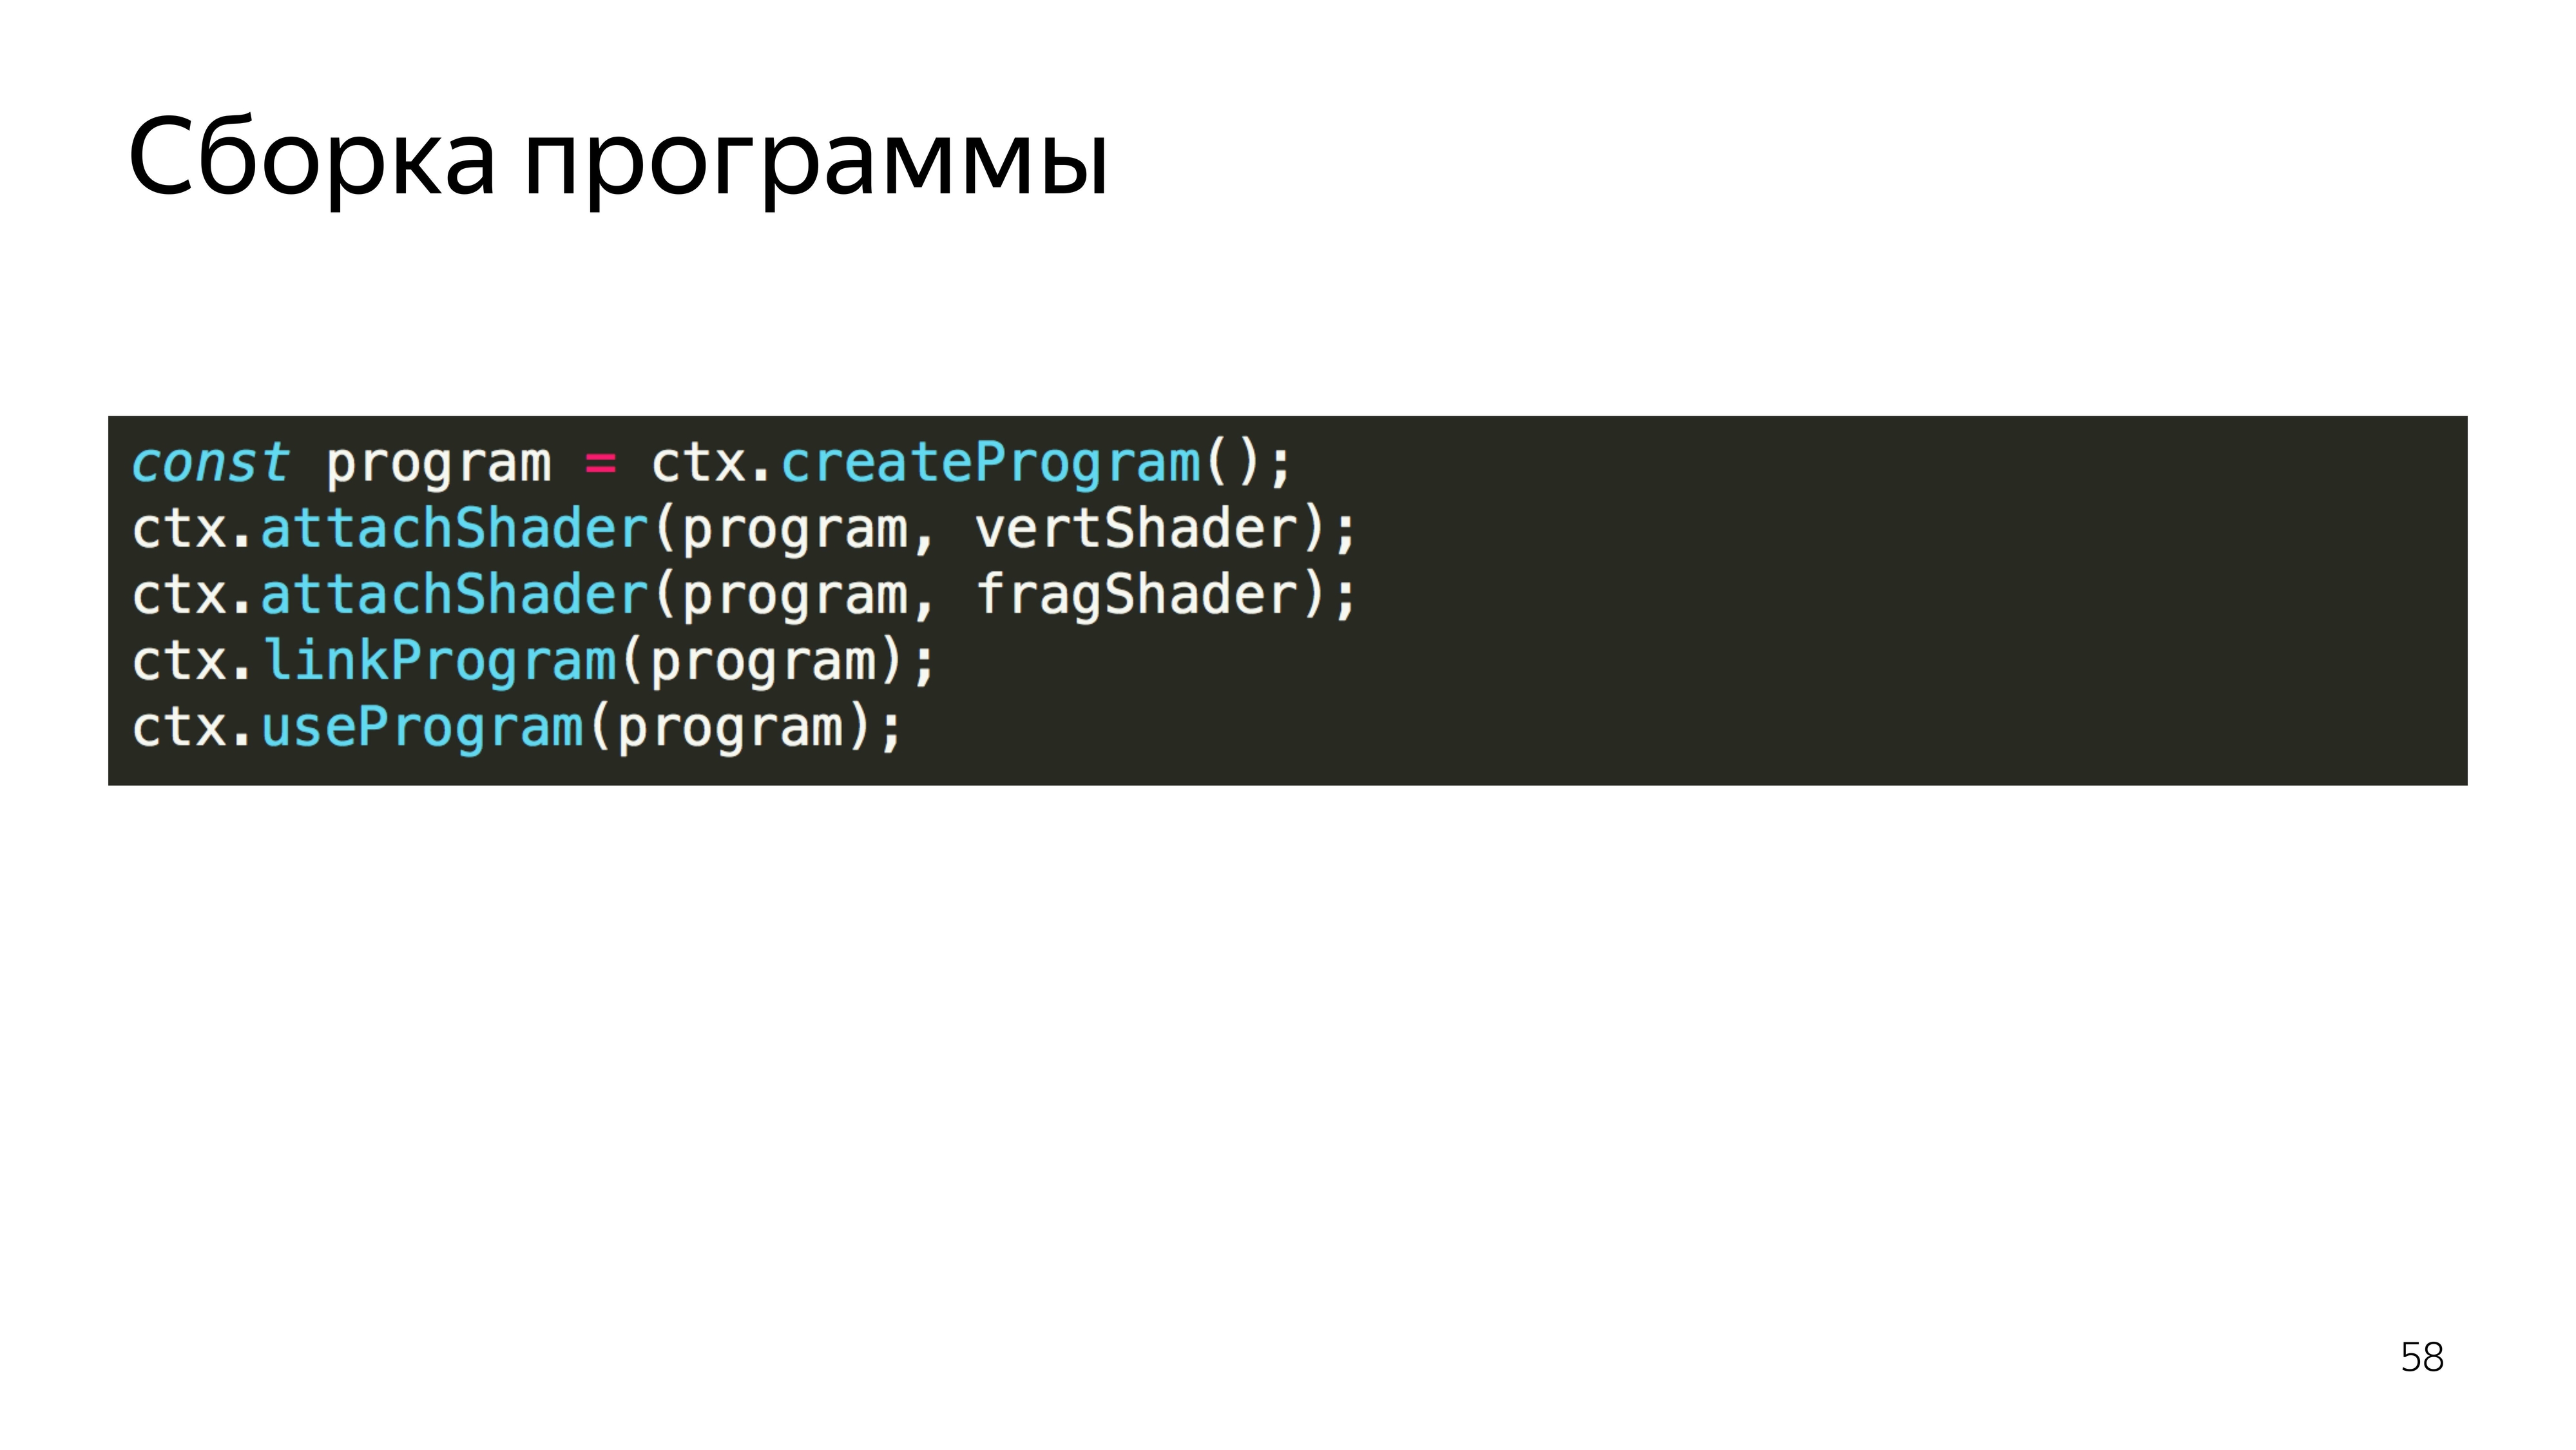
After that, we create a program, upload already compiled shaders. We link the program, because shaders can exchange variables between each other. And at this stage, the correspondence of the types of variables that these shaders exchange is checked.
We say that use this program.

Next we create a list of vertices that we want to visualize. There is an interesting feature in WebGL for some variables. To change a specific data type, you need to set a global context for editing array_buffer, and then upload something to this address. There is no explicit assignment of any data to a variable. Here everything is done through the inclusion of some context.
You must also set the rules for reading from this buffer. It can be seen that we specified an array of six elements, but the program needs to be explained that each vertex consists of two components, the type of which is float, this is done in the last line.
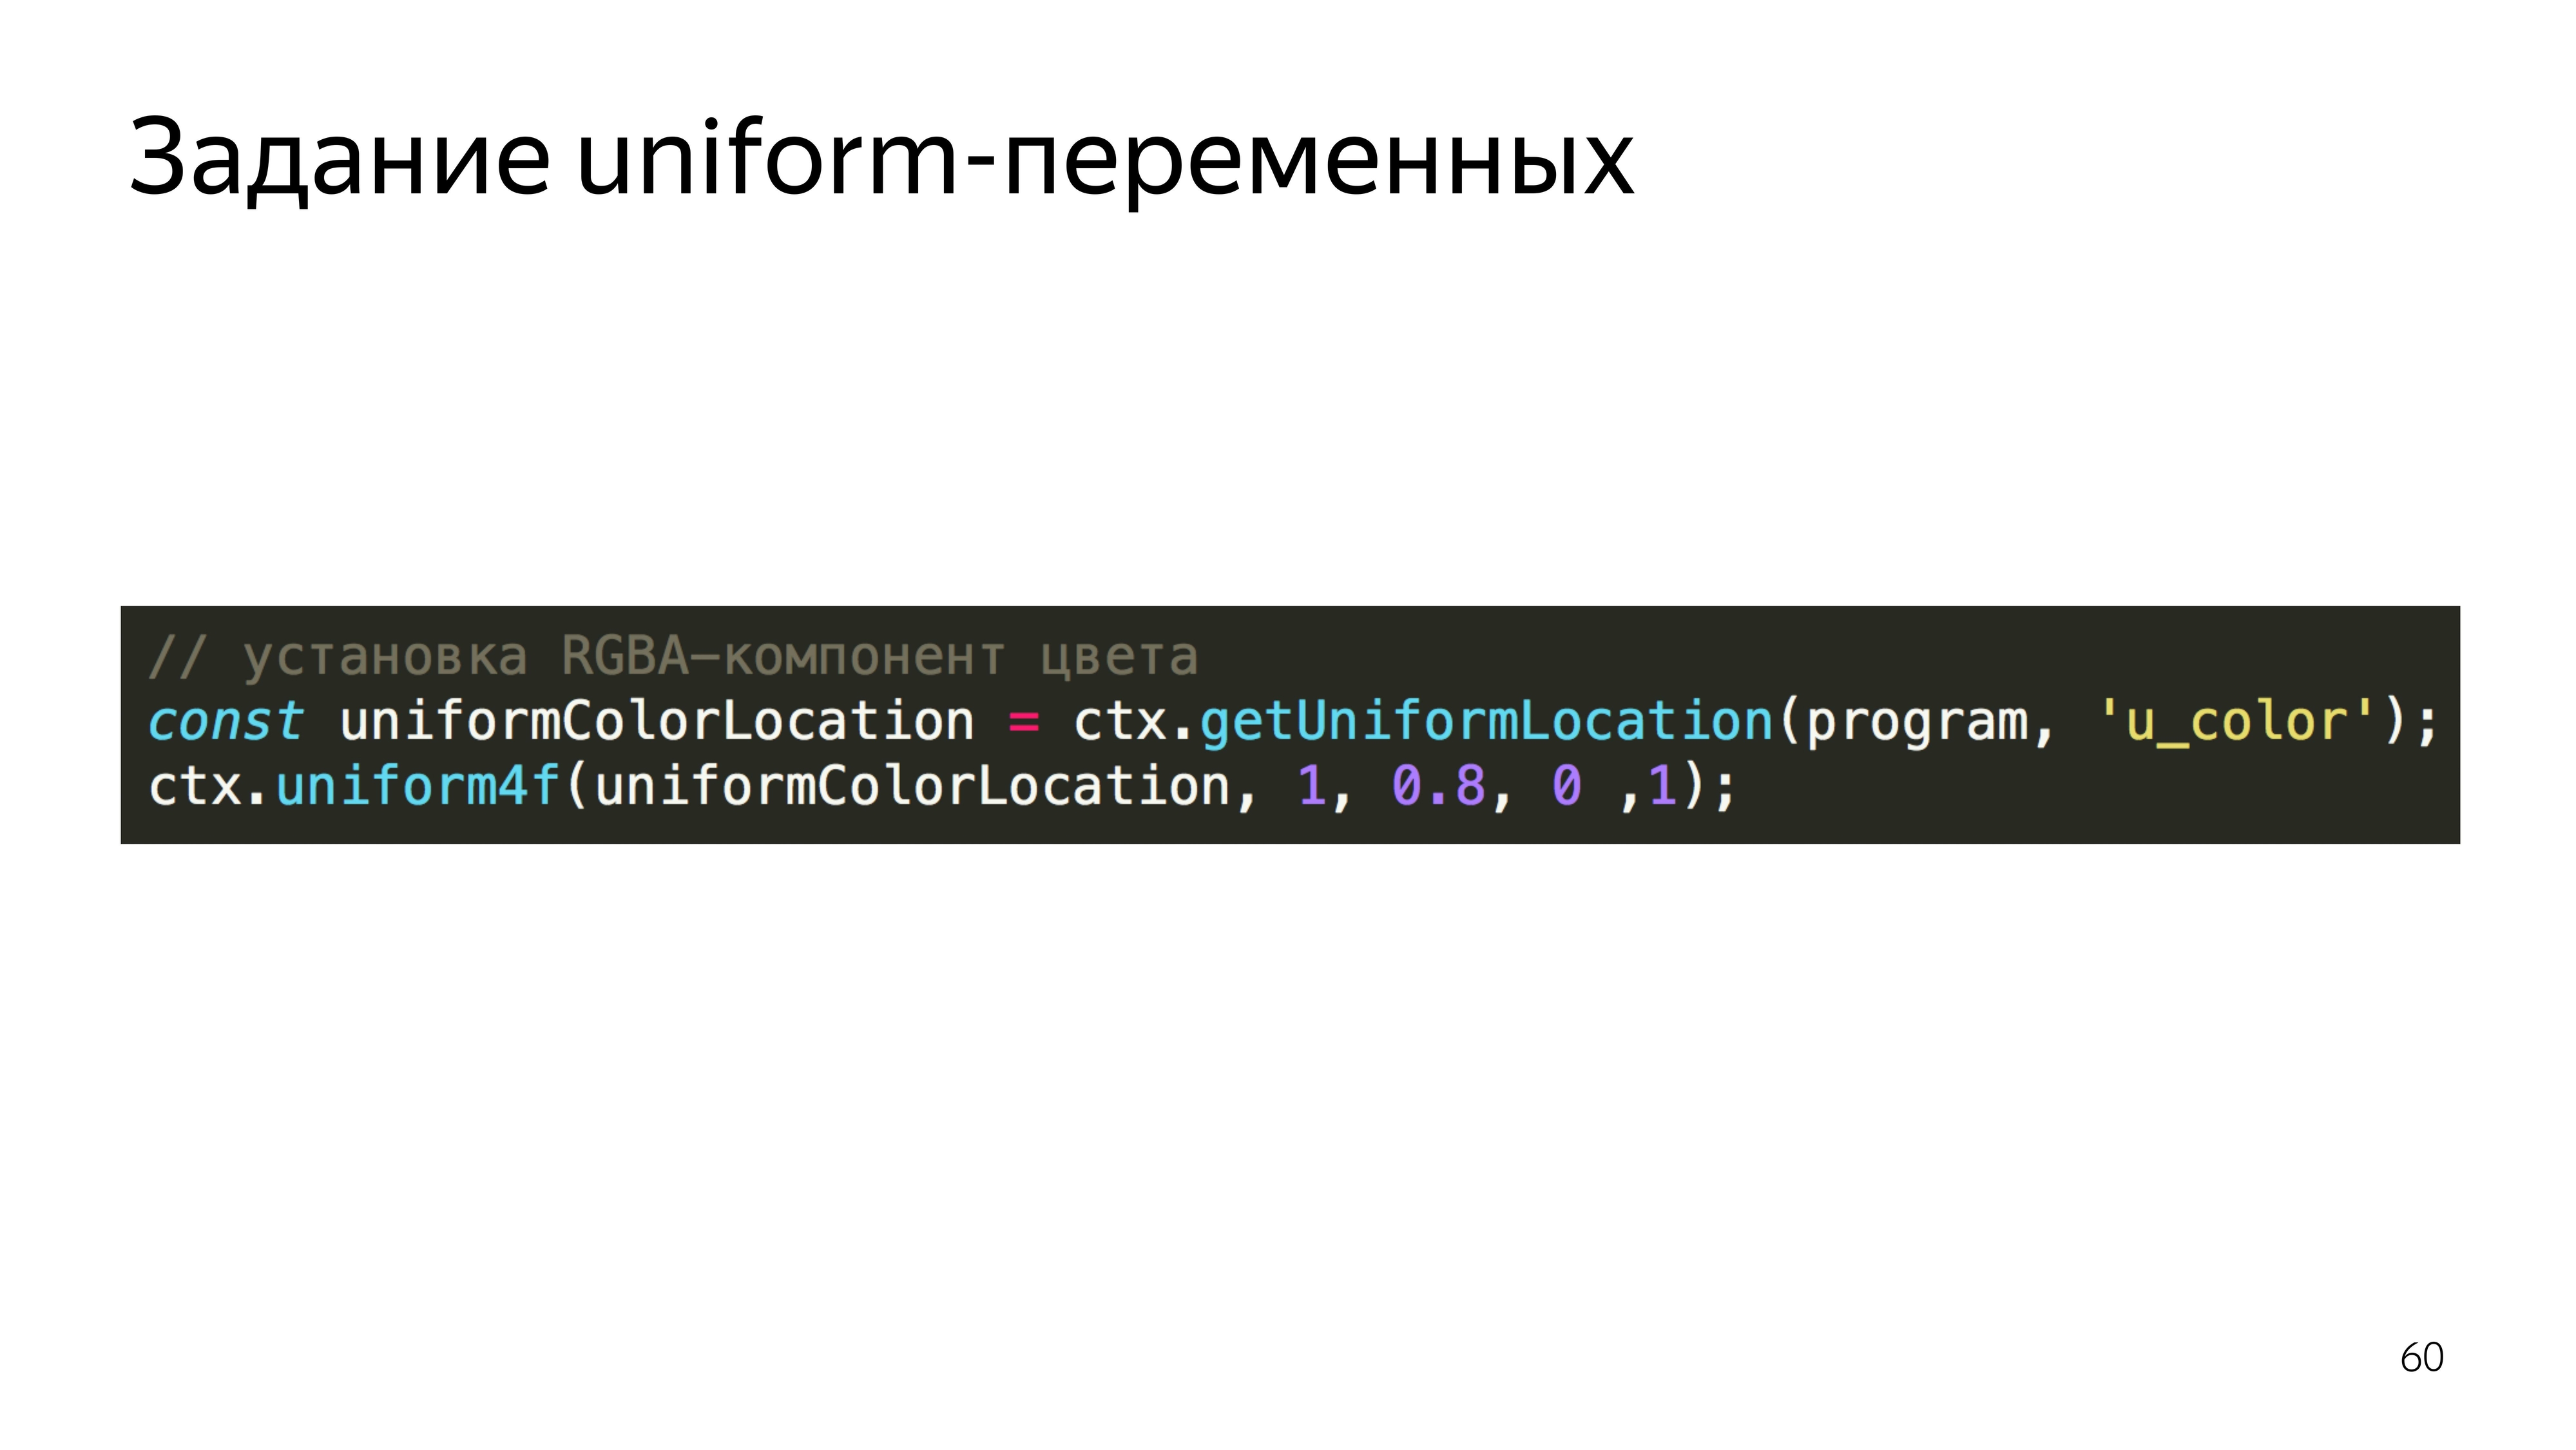
To set the color, the program searches for the address for the variable u_color and sets the value for this variable. We set the color, red 255, 0.8 from green, 0 blue and completely opaque pixel - it turns yellow. And we say to execute this program using triangle primitives, in WebGL you can draw points, lines, triangles, triangles of complex shape, and so on. And make three peaks.
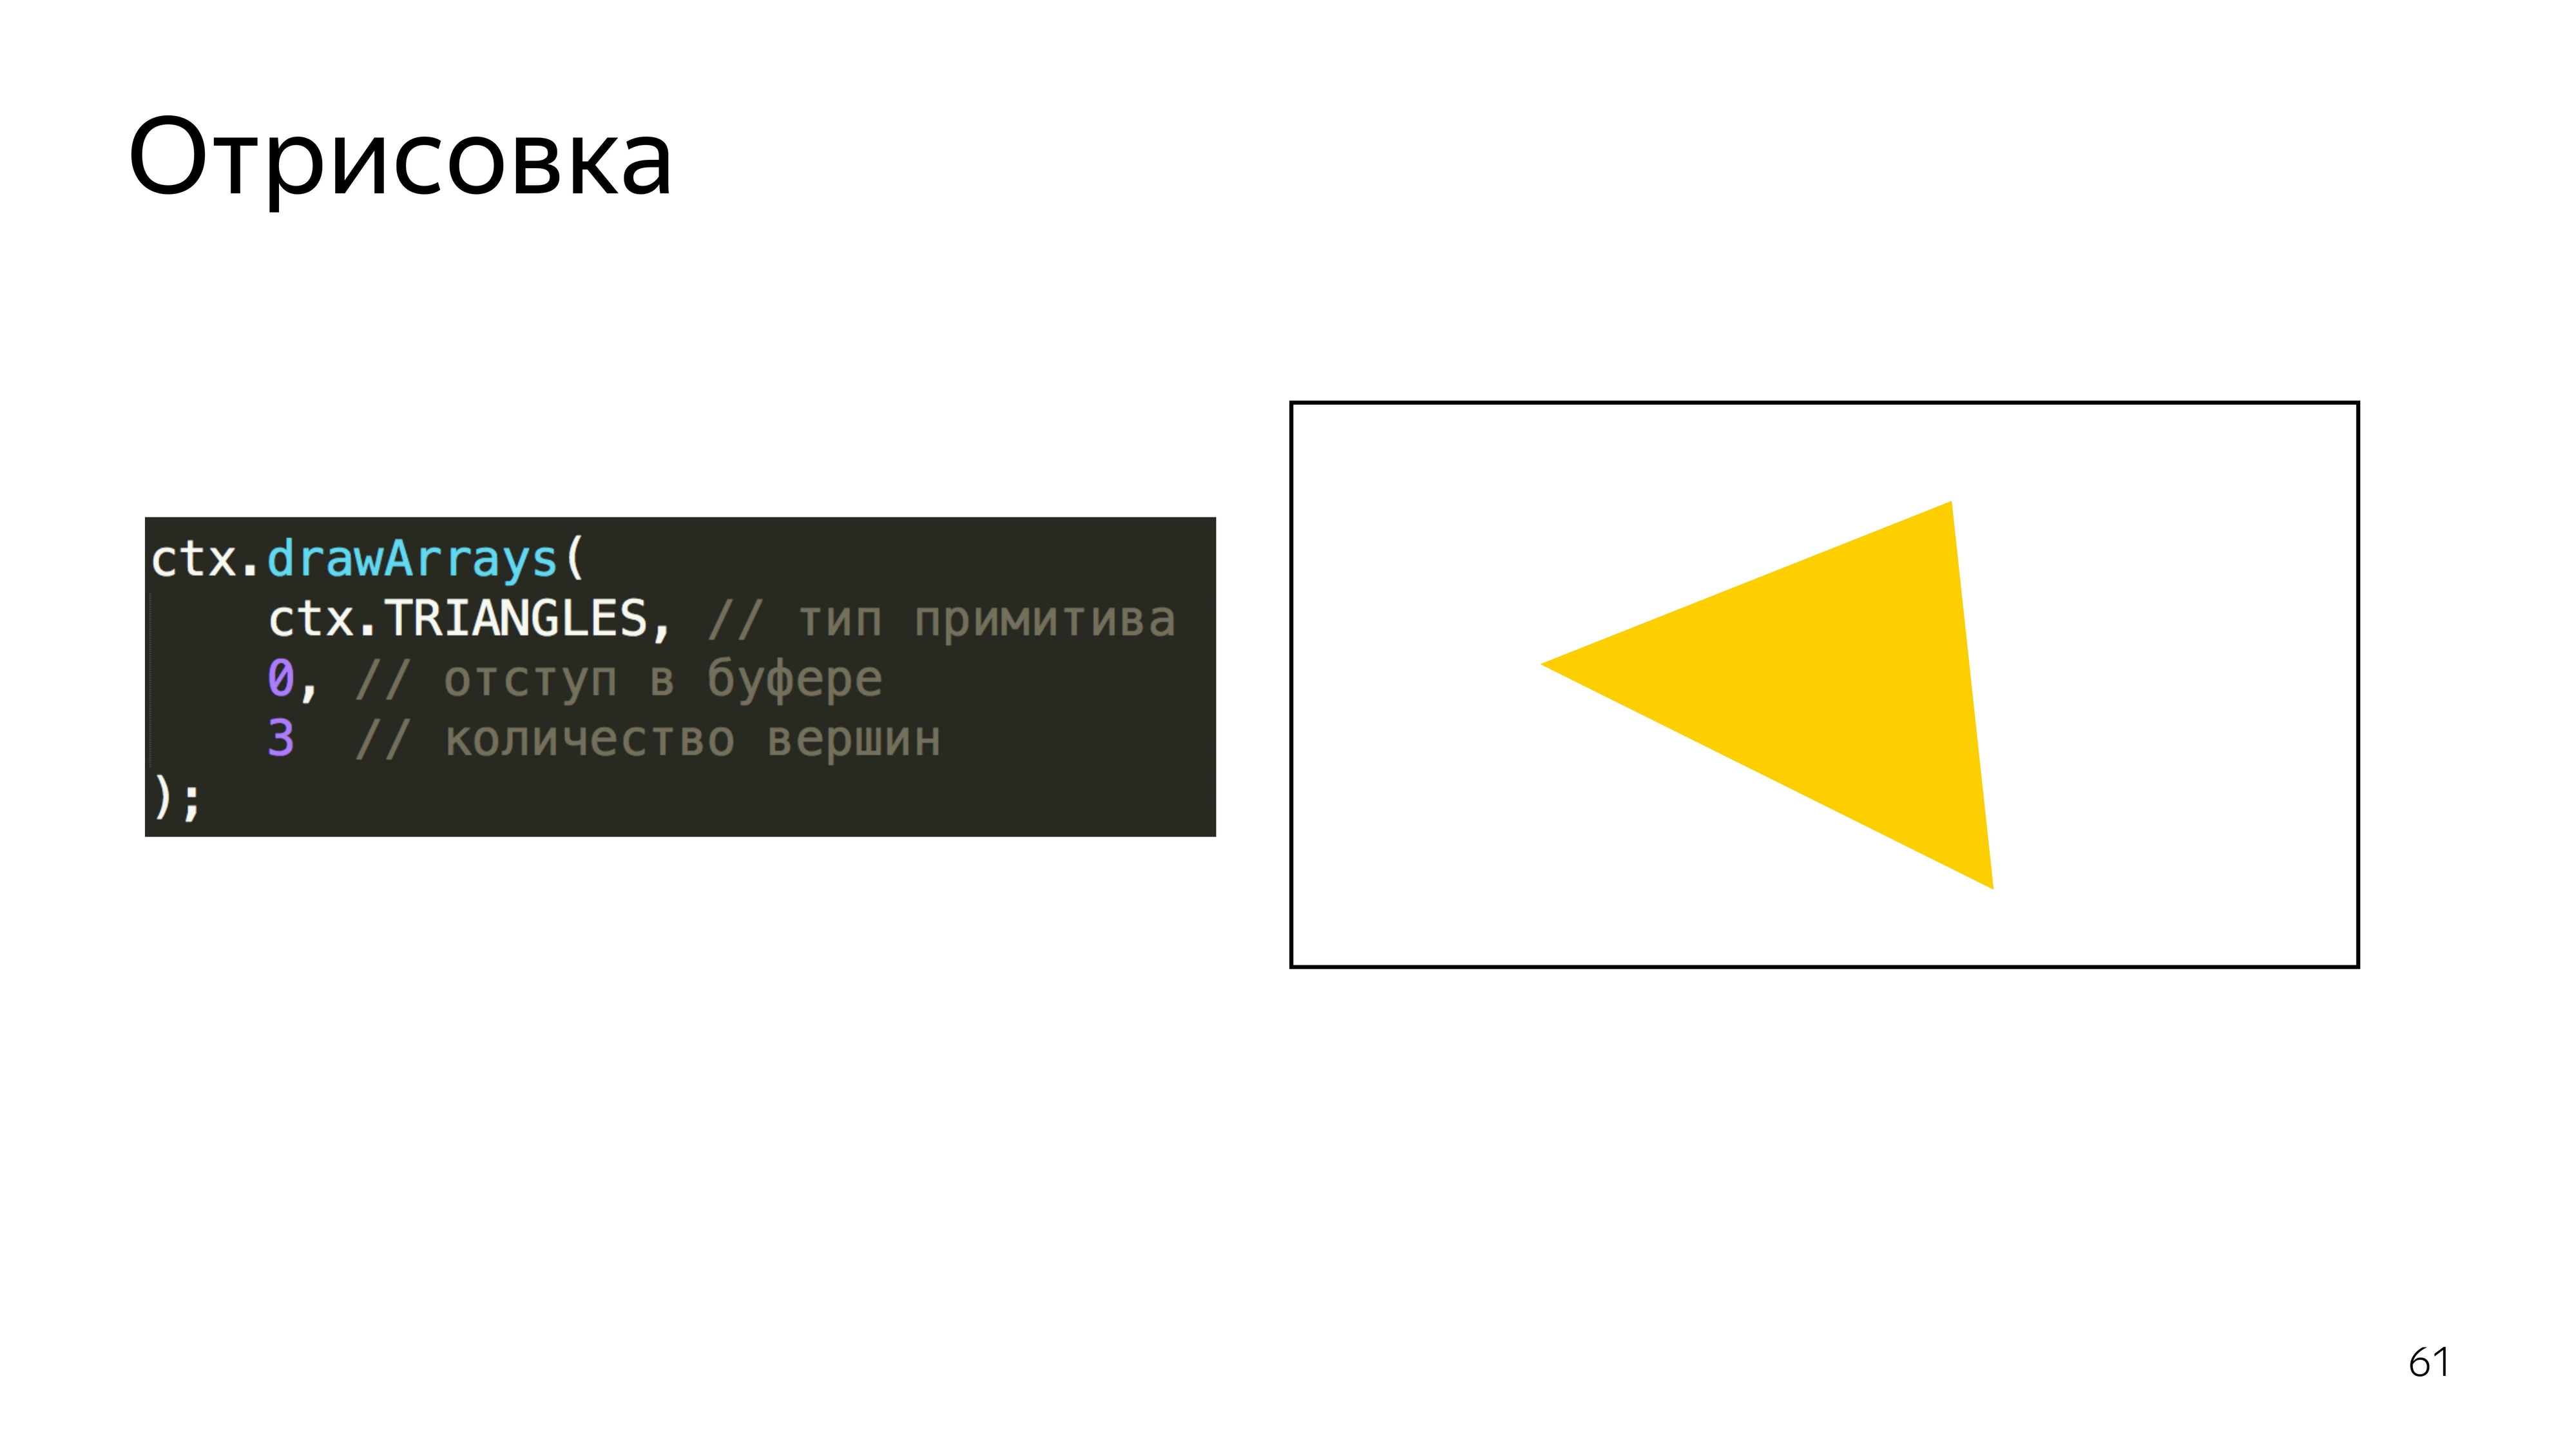
You can also specify that the array, on which we perform the drawing, should be considered from the very beginning.
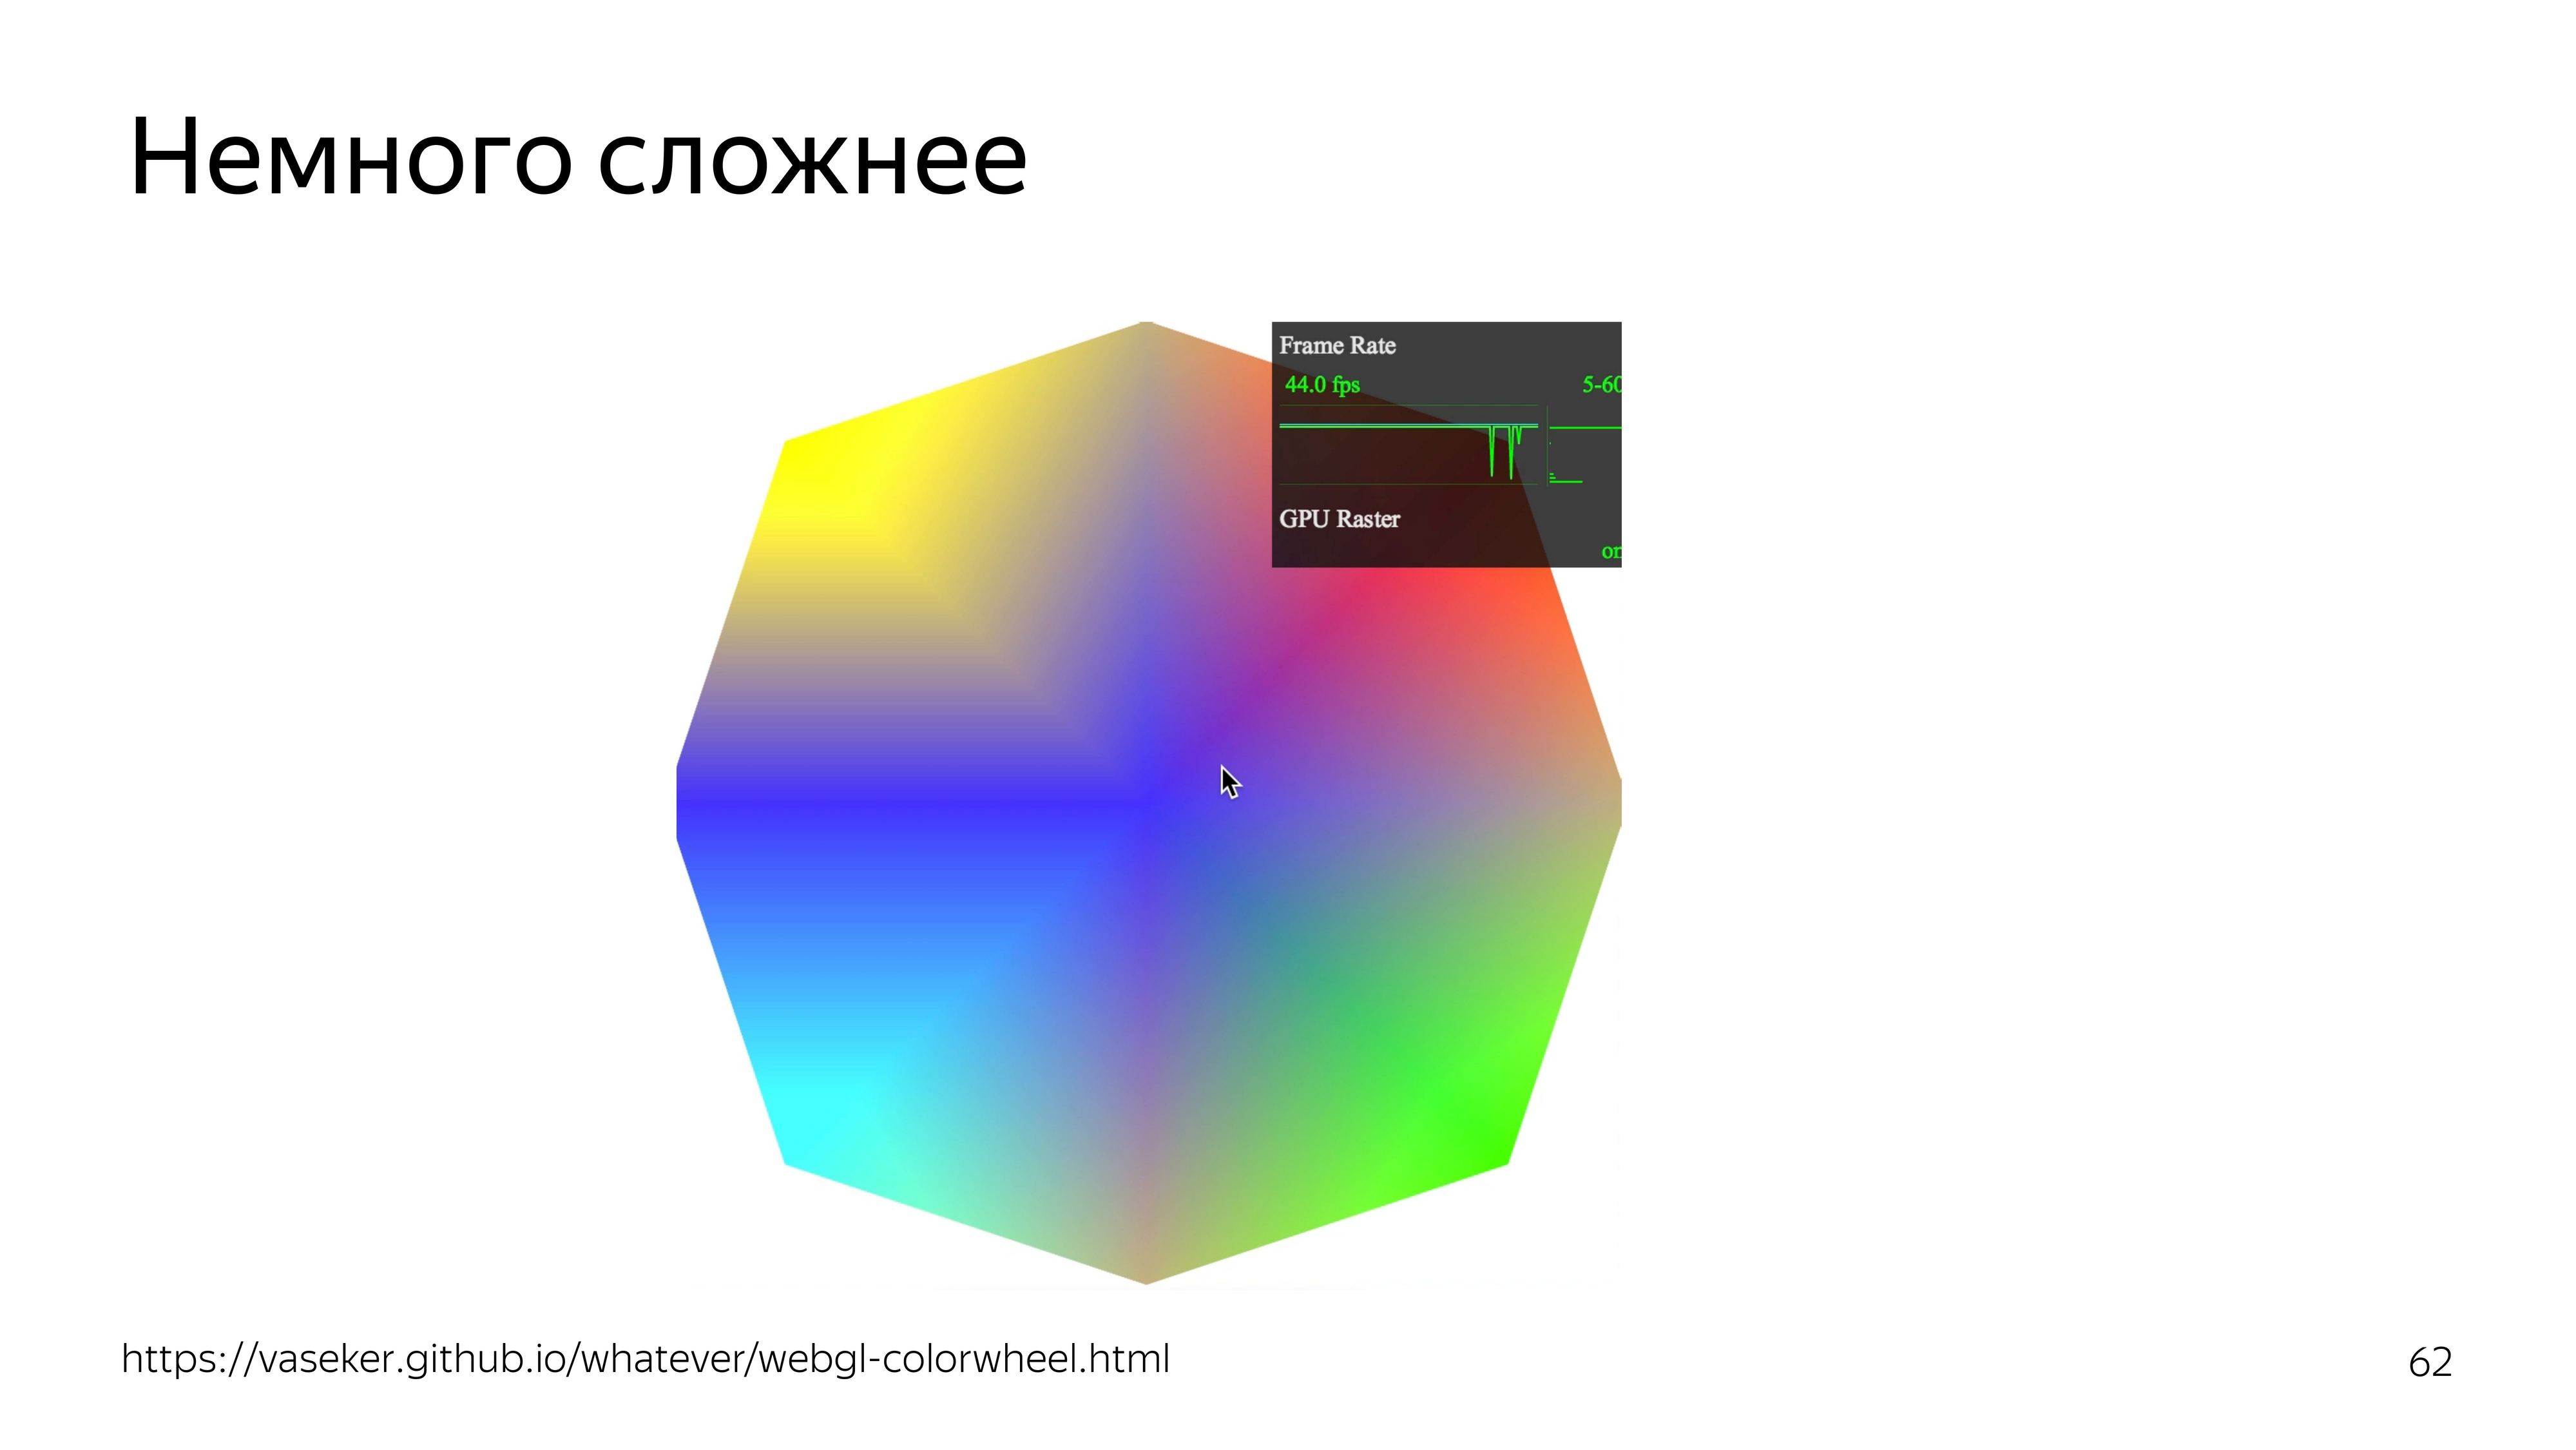
If you slightly complicate the example, you can add color dependence on the position of the cursor. At the same time fps rolls over.
To draw particles all over the world, you need to know the wind speed at every point of this world.
To increase and somehow move the map, you need to create containers that correspond to the current position of the map.
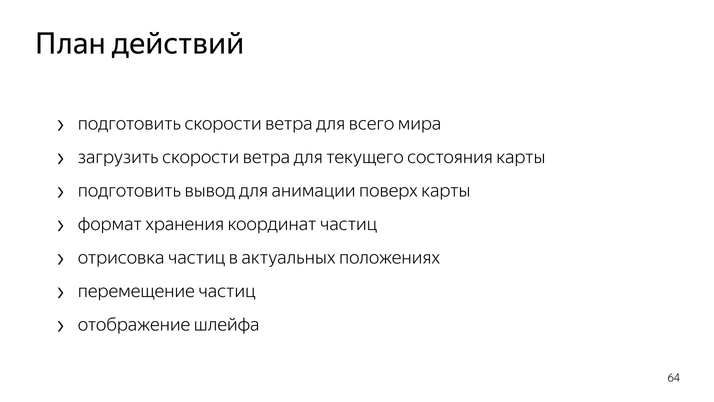
To move the particles themselves, you need to come up with a data format that could be updated using a graphics processor. Make drawing and loop drawing itself.

All the data we do through teksturku. We use 22 channels to determine horizontal and vertical speeds, where zero wind speed corresponds to the middle of the color range. This is about 128. Since the speed can be negative and positive, we set the color relative to the middle of the range.
It turns out this picture.
To load it on the map, we need to cut it. To connect the image to the map, we use the standard Yandex.Map Layer tool, in which we determine the address from which to get the cut tiles, and add this layer to the map.

We get a picture where the unpleasant green color is the coded wind speed.
Next you need to get a place in which we will draw the animation itself, while this place must correspond to the coordinates of the map, its movements and other actions.
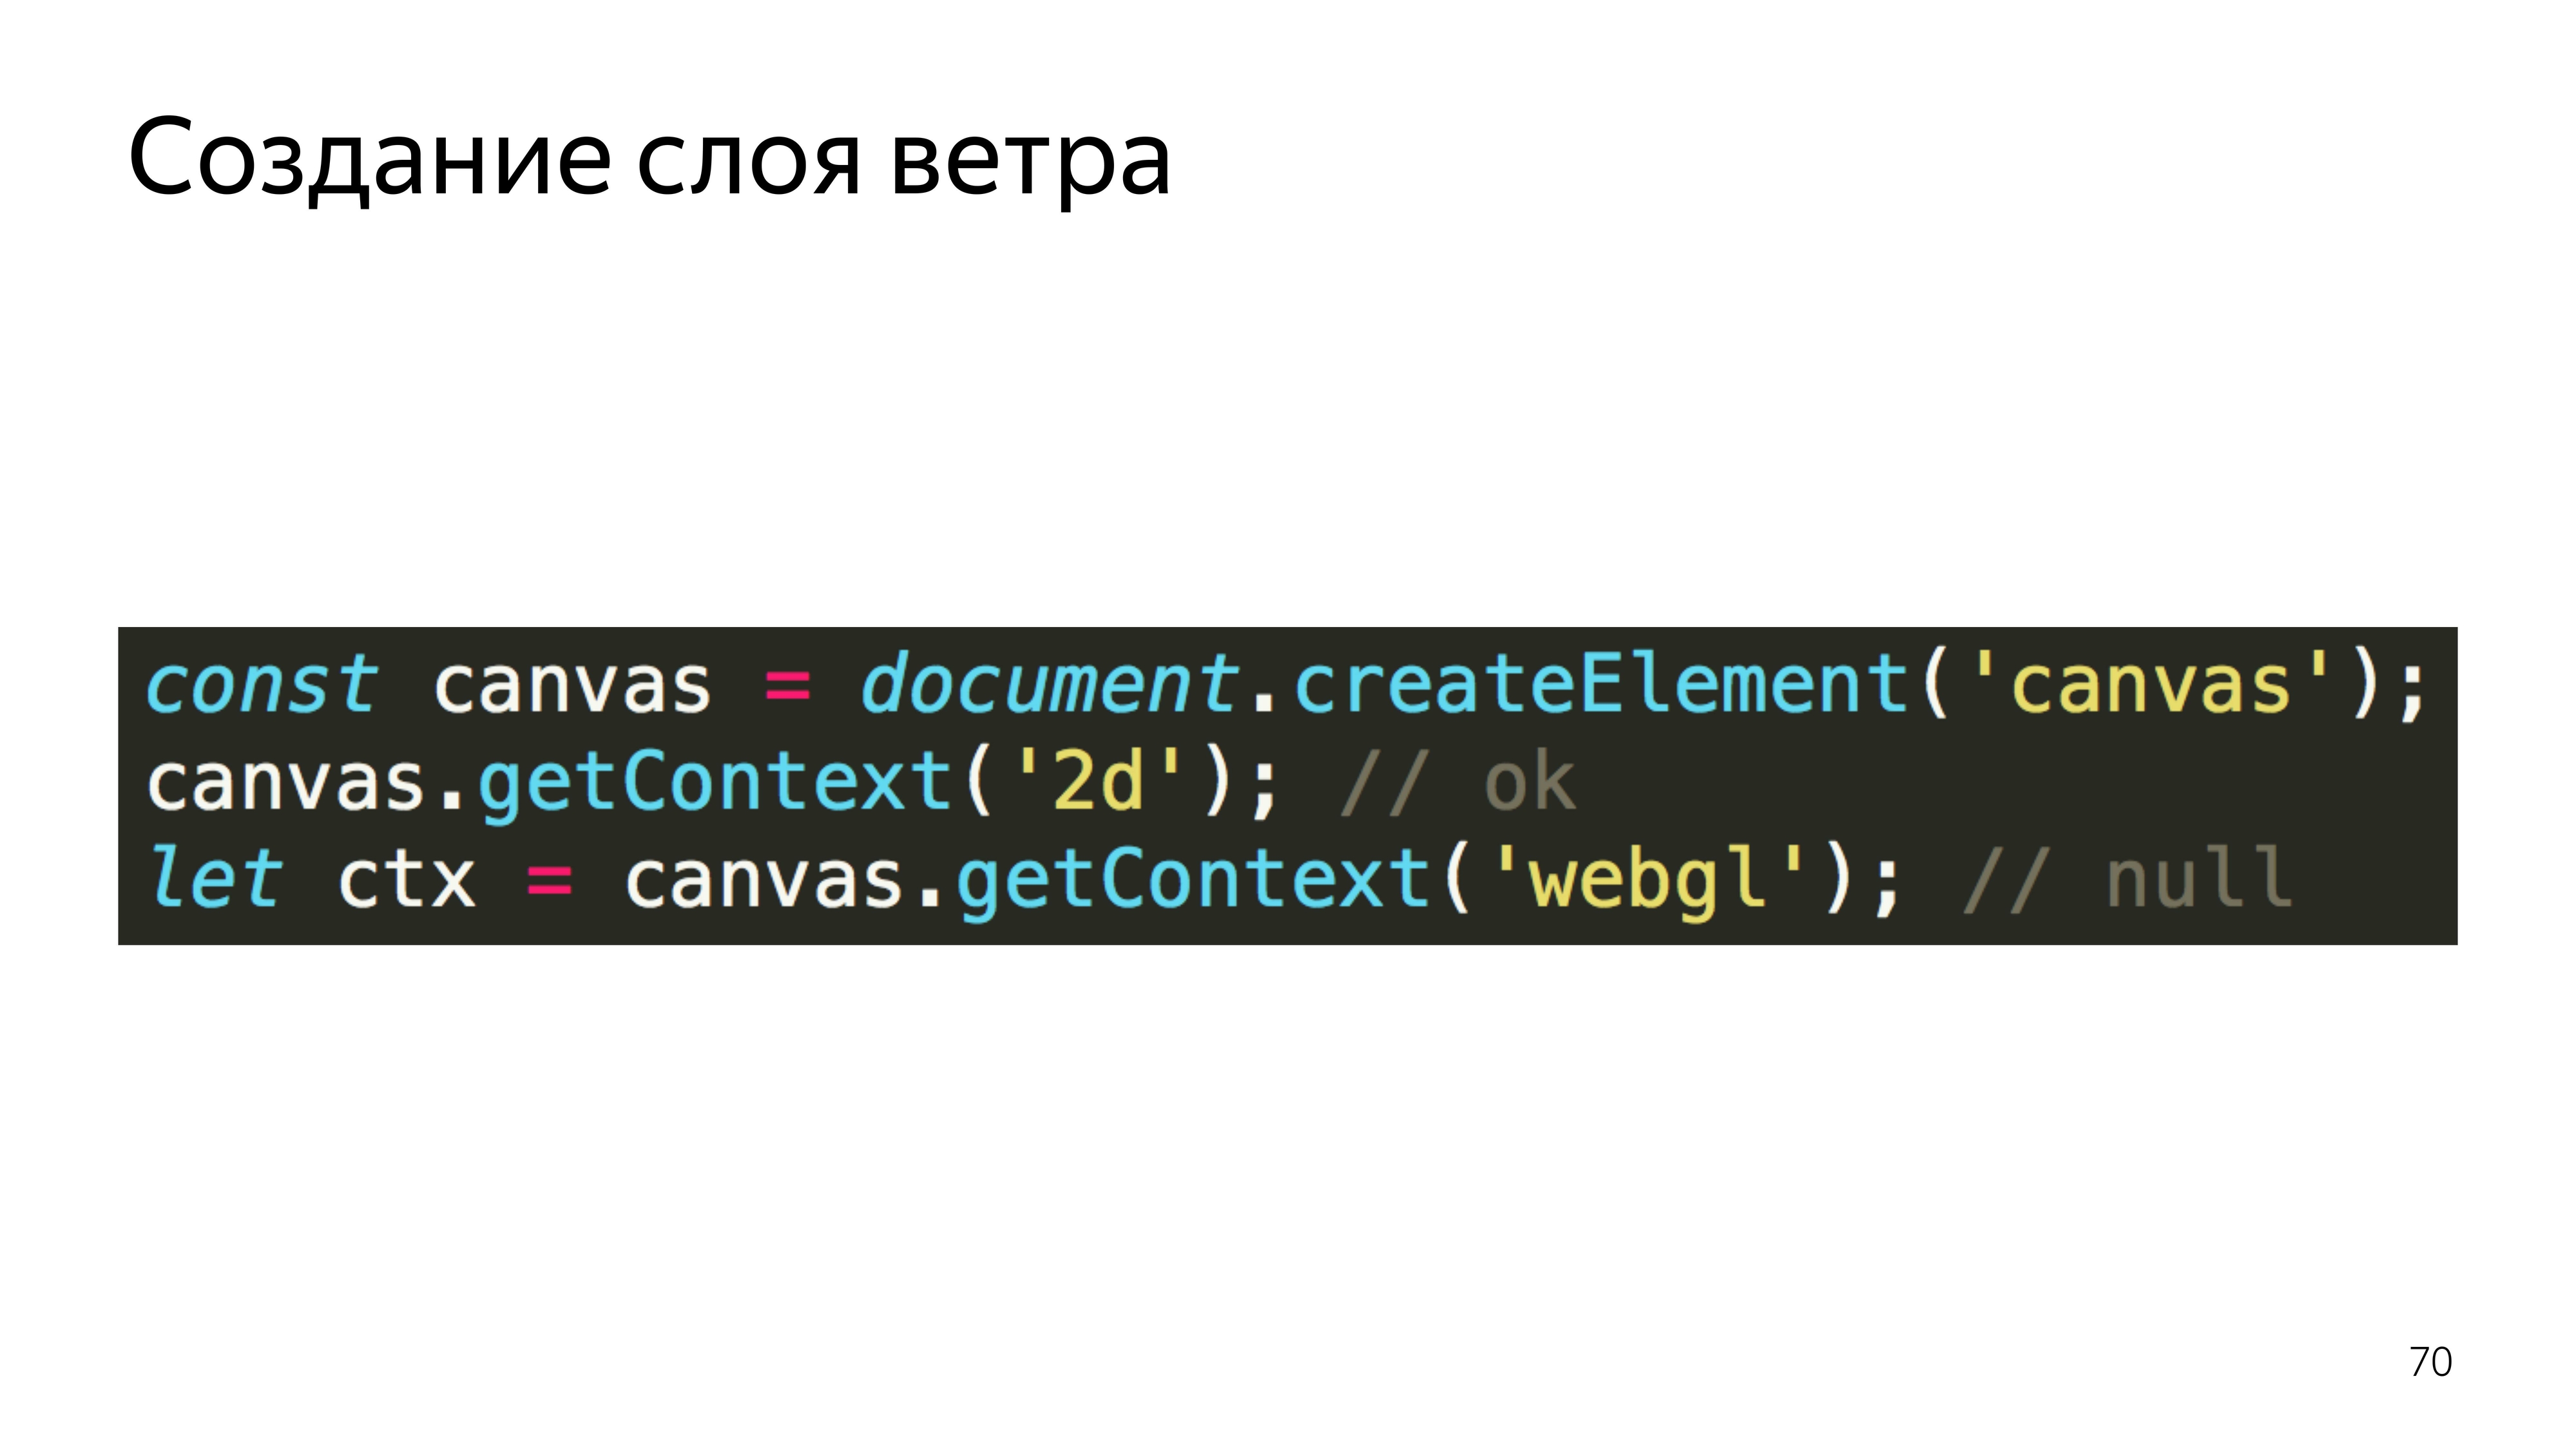
By default, we can assume that we would use the Layer, but the card Layer creates a canvas, from which it immediately captures the 2D context, which it turns out to capture. But if we try to take from the canvas, which already has a context of another type, and take the GL context from it, we will end up with null. If you turn to it, the program crashes.

Therefore, we used Pane, these are containers for layers, and added our canvas there, from which we have already taken the context we need.
In order to somehow place the particles on the screen and be able to move them, the format of the position of the particles in the texture was used.
How it works? It creates a square texture for optimization, and here the size of its side is known.
By drawing the particles in order and knowing the sequence number of the particles and the size of the texture in which they are stored, you can calculate the specific pixel in which the position is encoded on the real screen.
In the shader itself, it looks like reading a rendered index, a texture with the current position of the particles and the size of the side. Next, we determine the x, y coordinates for this particle, read this value, and decode it. What is this magic: rg / 255 + ba?
For the position of the particles we use 20 double channels. The color channel has a value from 0 to 255, and for a 1080 screen for some we cannot put particles at any position on the screen, because we can put a maximum of a particle at 255 pixels. Therefore, in one channel we store the knowledge of how many times a particle has passed 255 pixels, and in the second channel we store the exact value of how much it has passed after.
Next, the vertex shader must convert these values to its work space, that is, from -1 to 1, and set this point on the display.
To just look at our particles, it is enough to paint them in white. There is such a sugar in GLSL that if we define the type of a variable and pass it into a constant, then this constant will be distributed over all four components, for example.
Having drawn such a program, we see a set of identical squares. Let's try to add them beauty.
First, add the dependence of these squares on the current wind speed. We simply read the current speed and the corresponding textures for each particle. We obtain the length of the vector, which corresponds to the absolute velocity at a point, and add this velocity to the particle size.

Further, in order not to draw the squares, in the fragment shader, we cut off all the pixels that fall outside the radius, which are not included in the radius of the inscribed circle. That is, our shader turns into such a thing.
Calculate the distance to draw the pixel from the center. If it exceeds half the space, then we do not show it.
We get a more diverse picture.
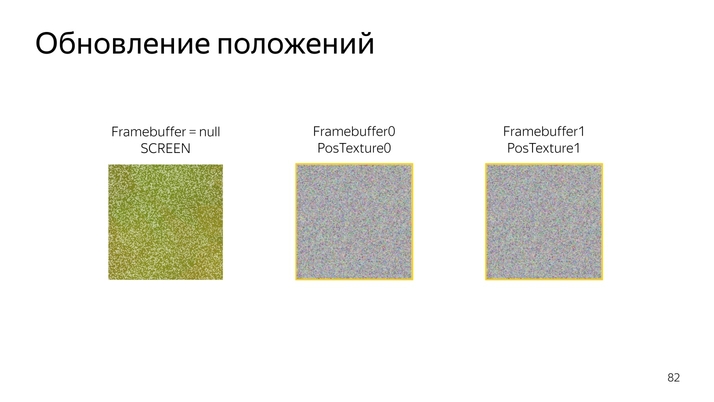
Next you need to somehow move these things. Since WebGL 1 does not know how to calculate something, work directly with data, we will use the possibilities of drawing programs into special components, frame buffers.
Frame buffers can bind, for example, textures that can be updated. If the frame buffer is not declared, then the default drawing is performed on the screen.
By switching the output from one position texture to another, we can update them one by one and then use them for drawing.
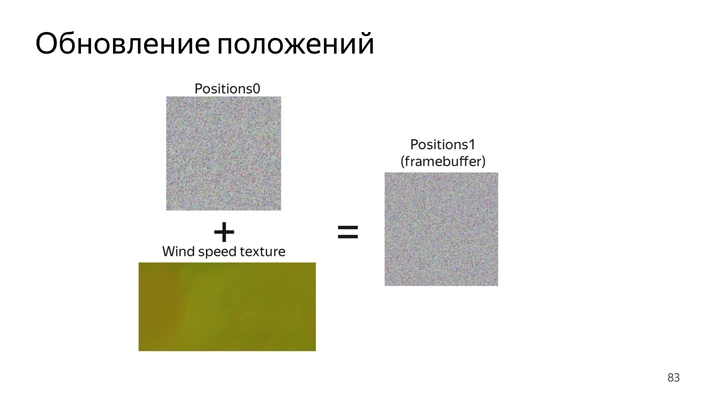
The very procedure of updating the position looks like this: read the current position, add up with the current velocity vector and fold, encode in a new color.

In the code, it looks like reading the current position, decoding, reading the current speed, bringing the speed to a normal form, folding the two components, encoding in color.
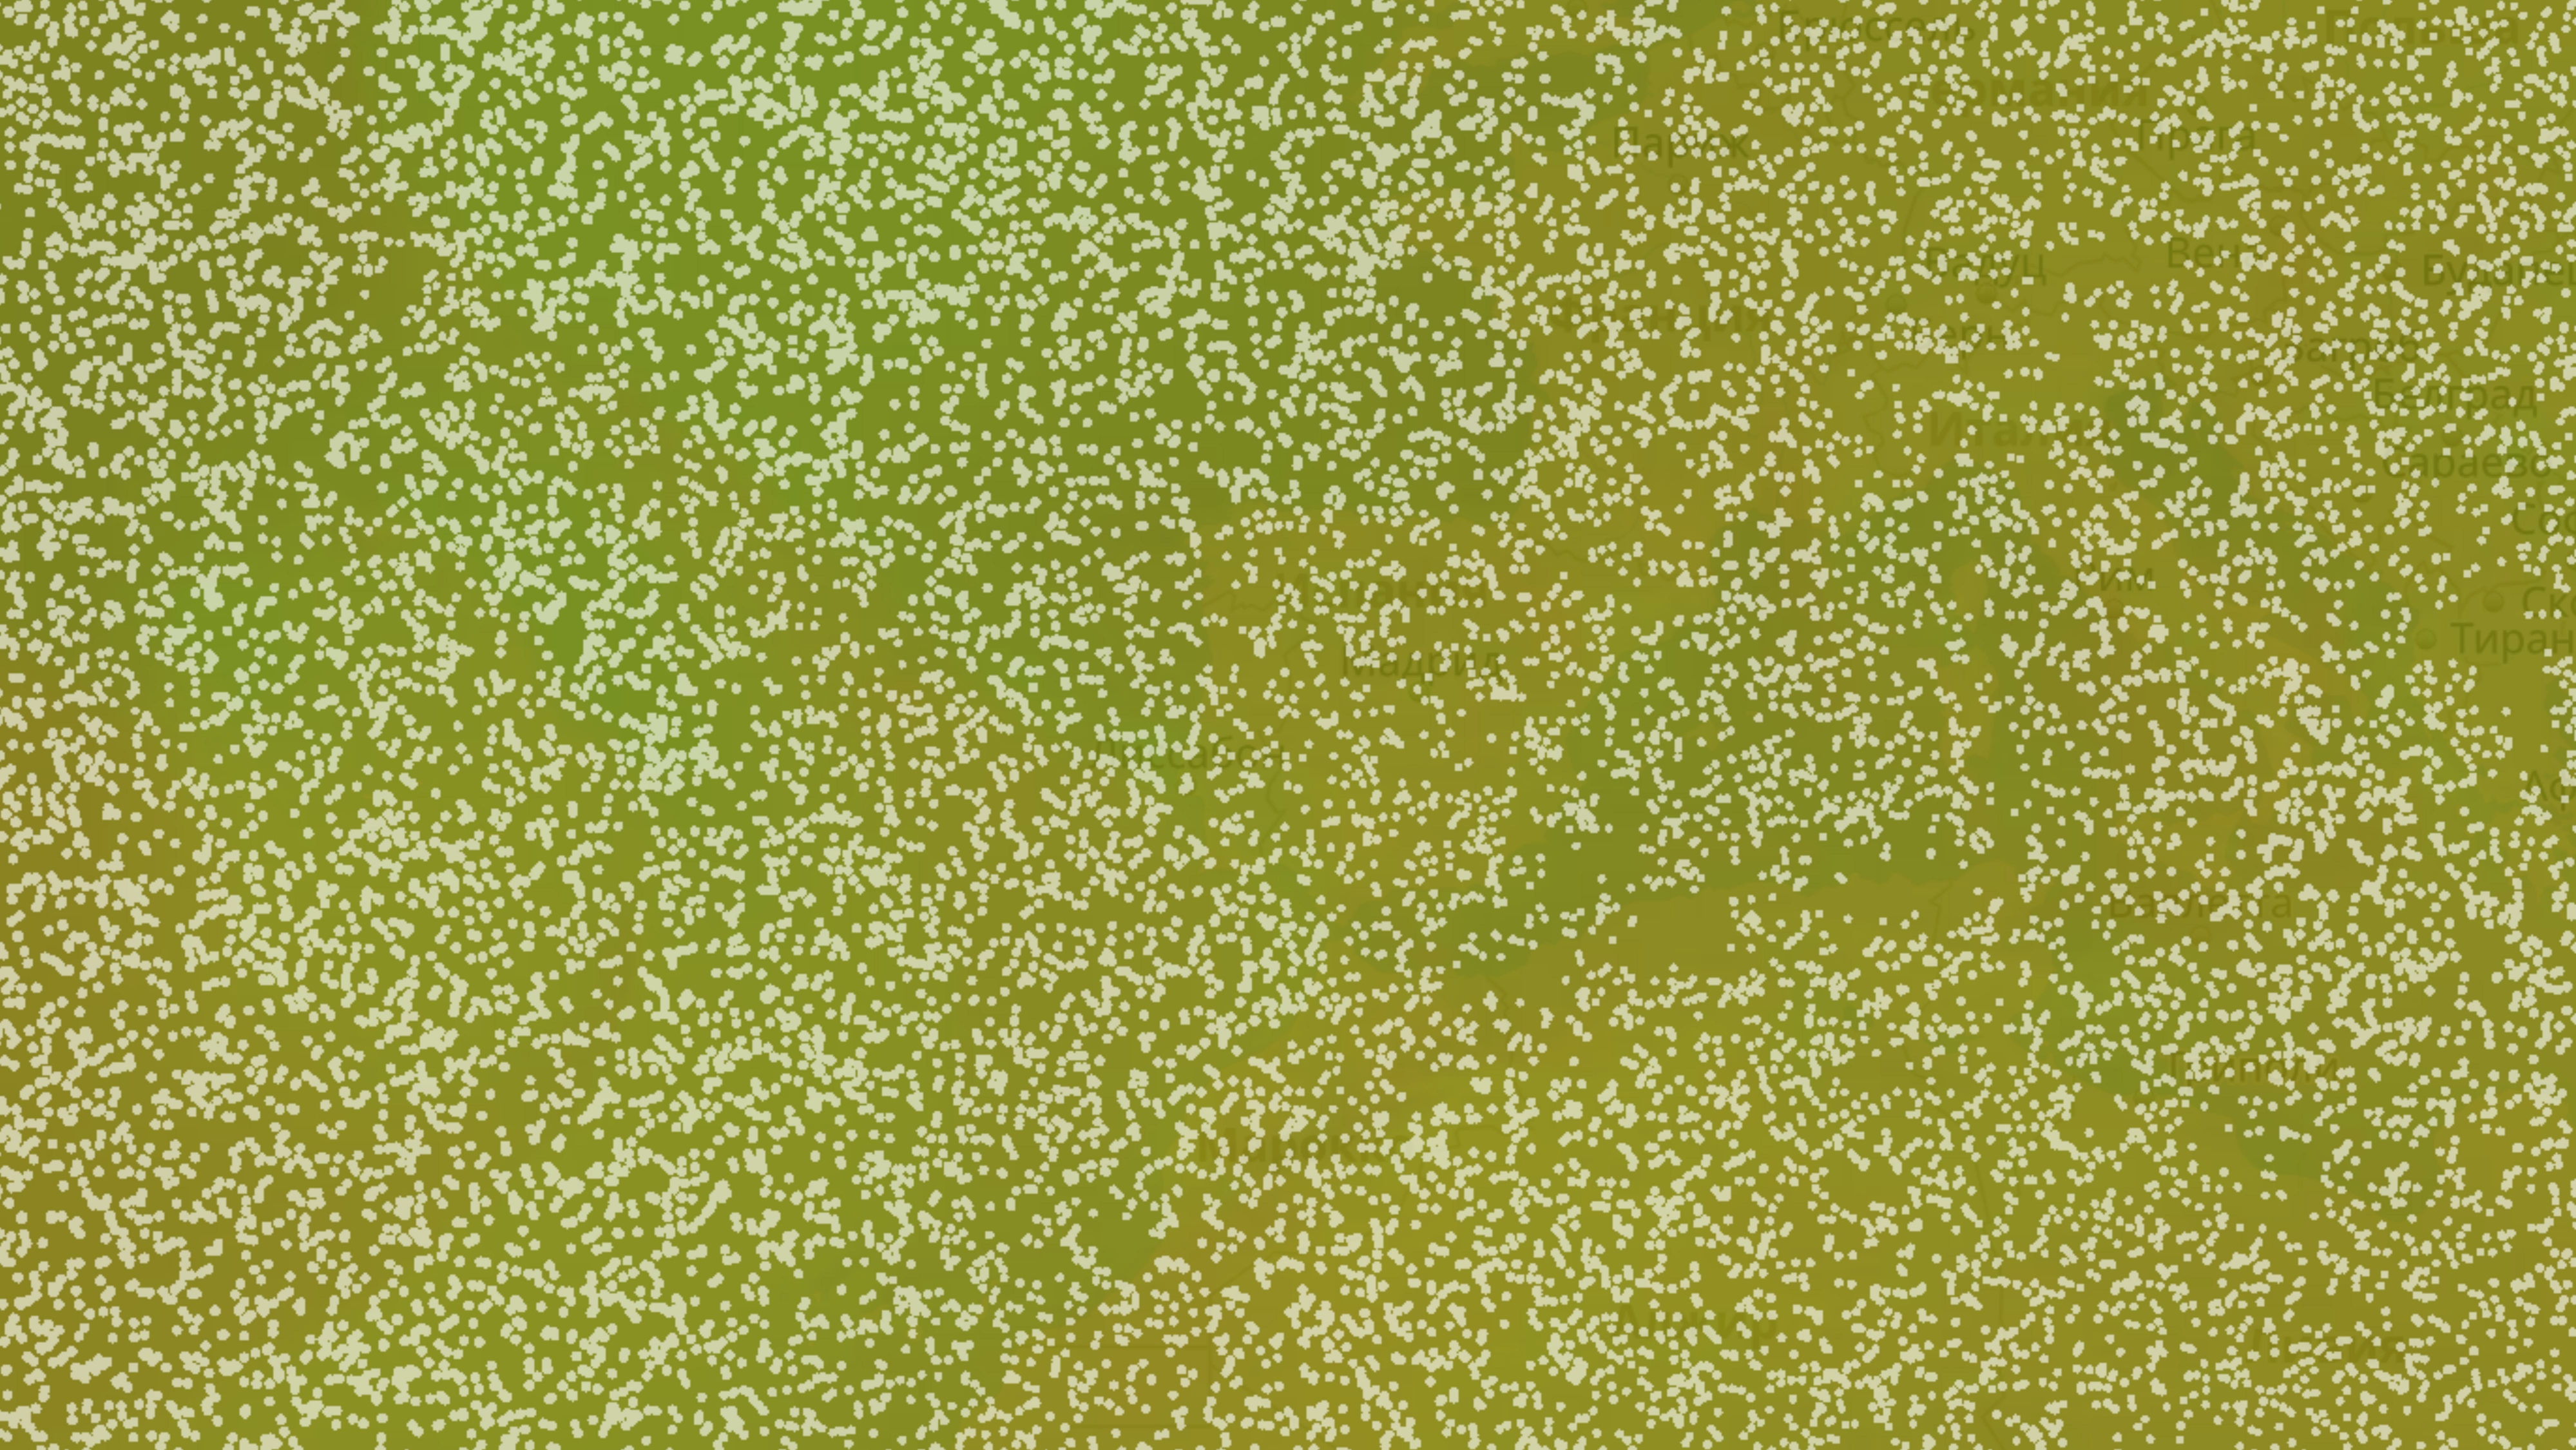
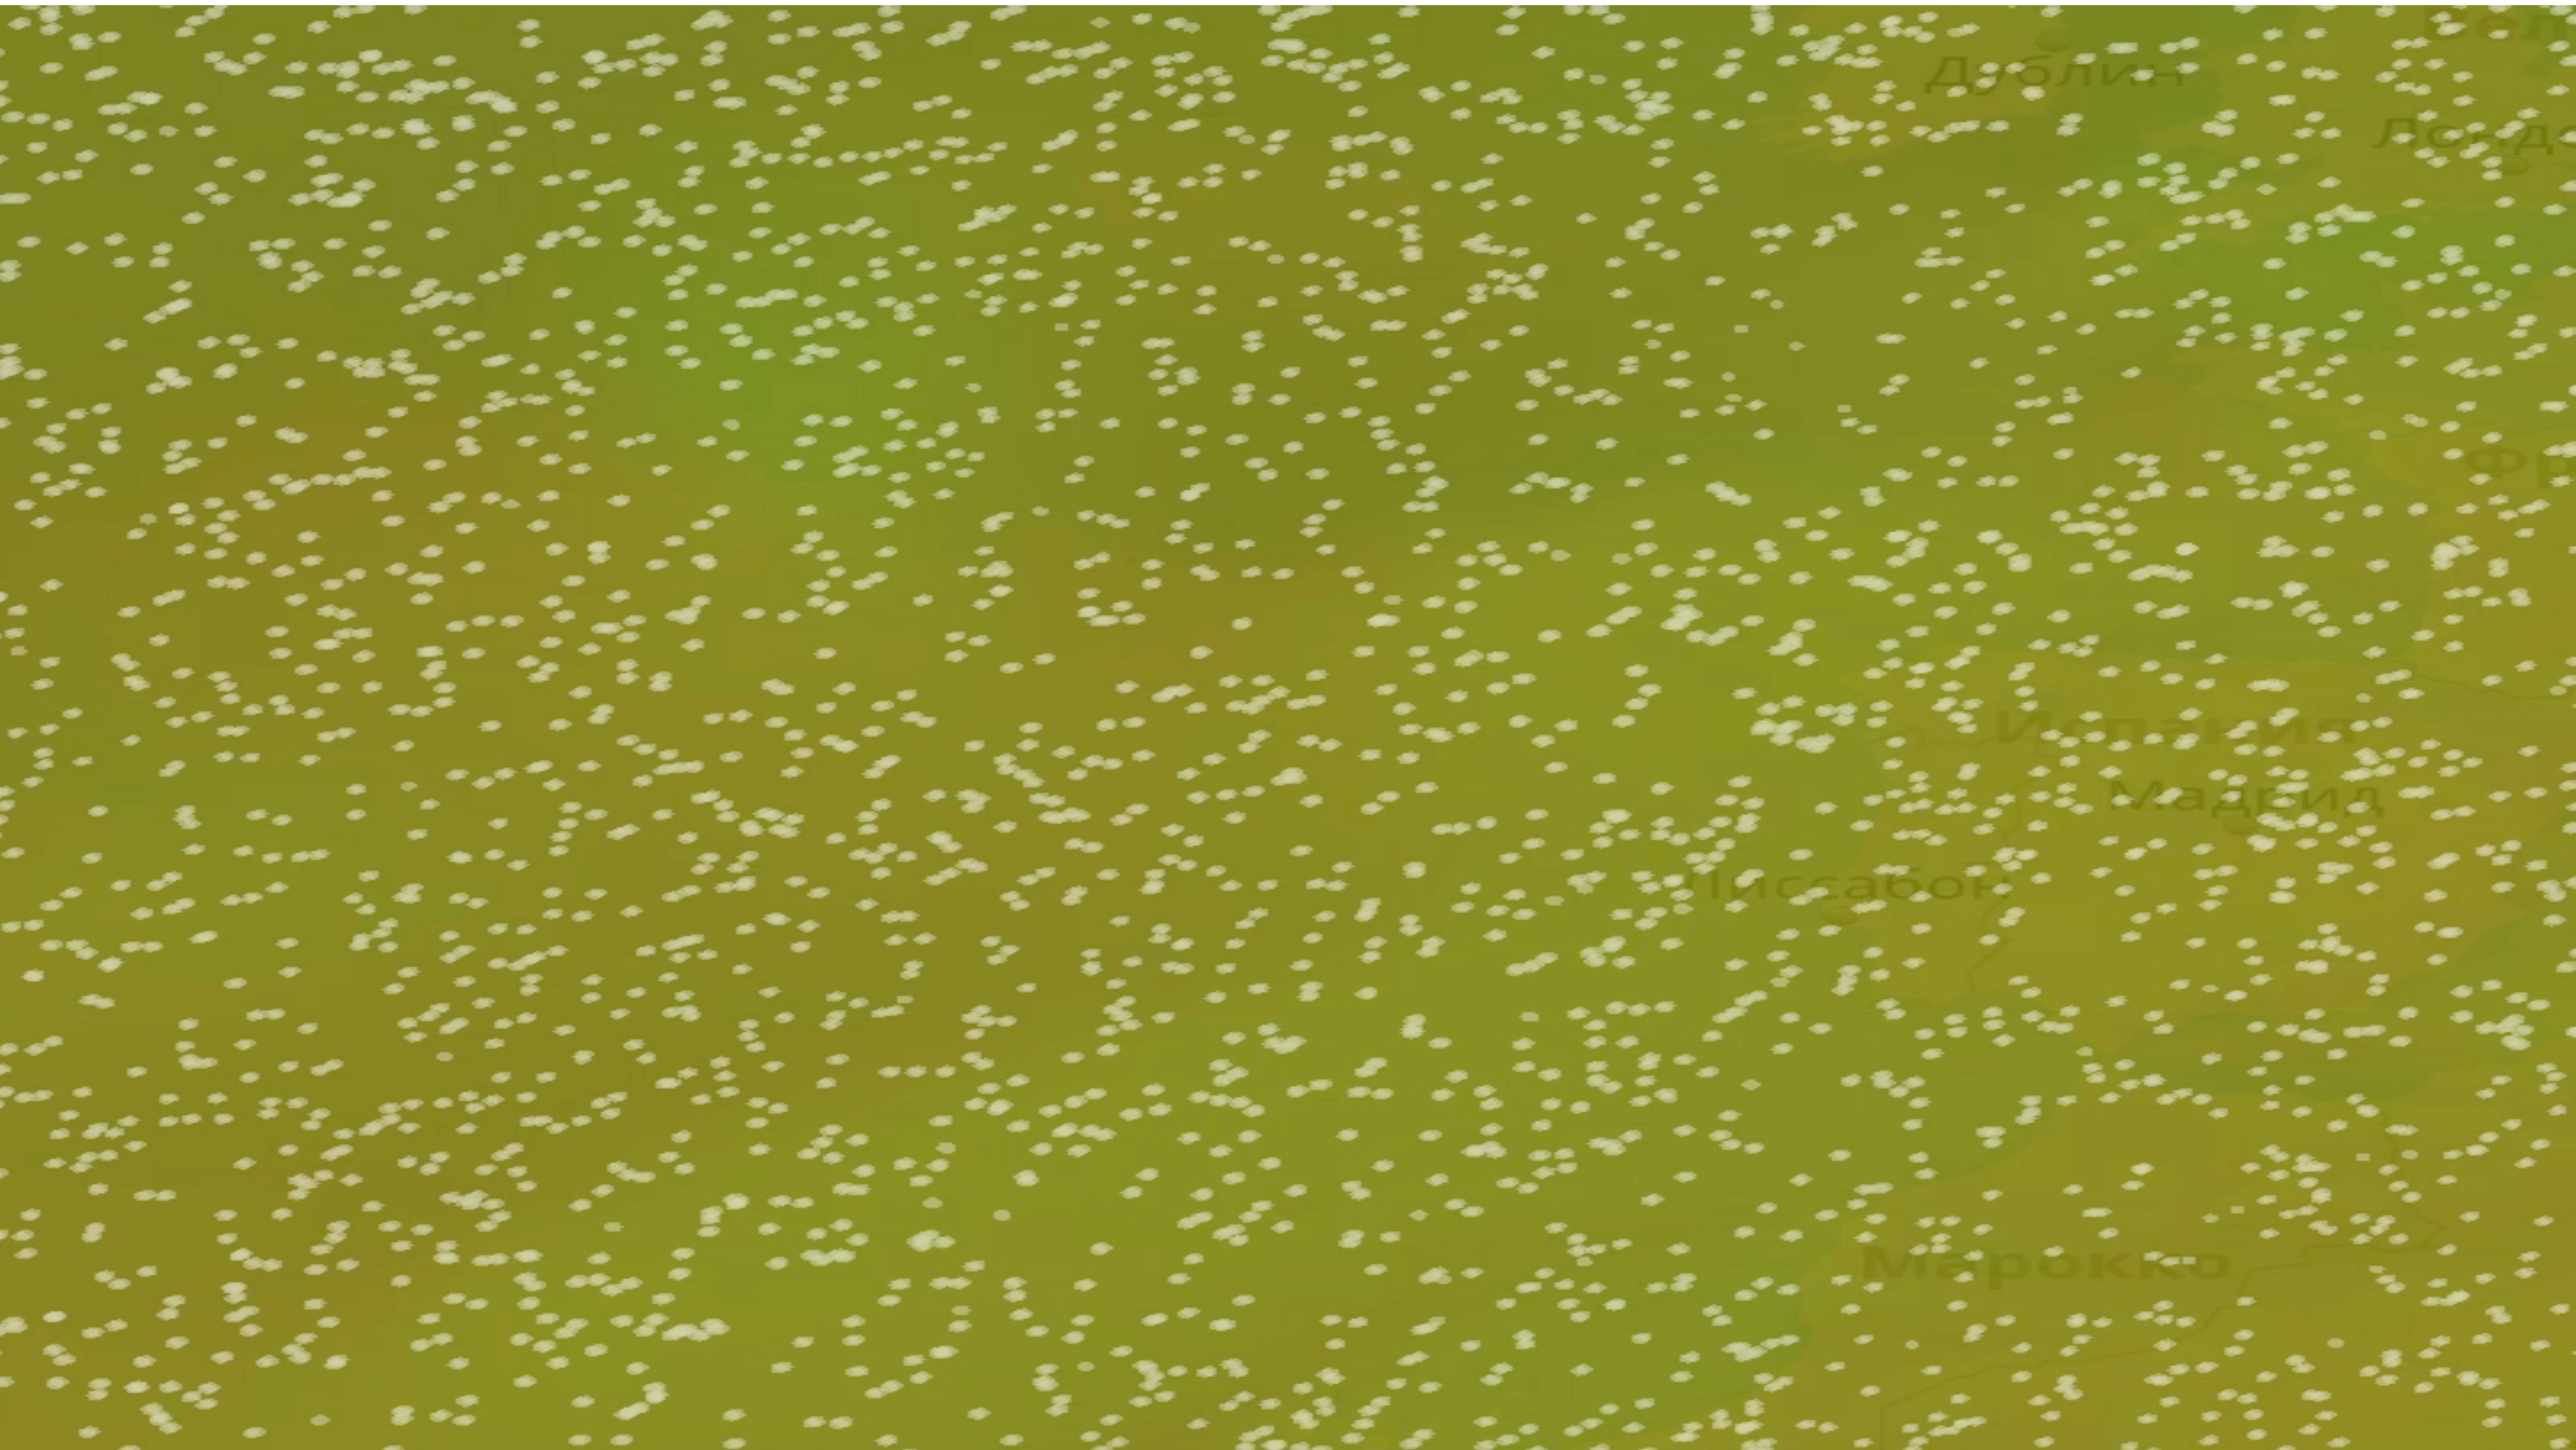
It turns out this picture. We are constantly changing the state of the particles, and there is some kind of animation.
If such an animation is run for 5–10 minutes, it will be seen that all particles will arrive at their final destination. They all slide into the funnel. It turns out this picture.

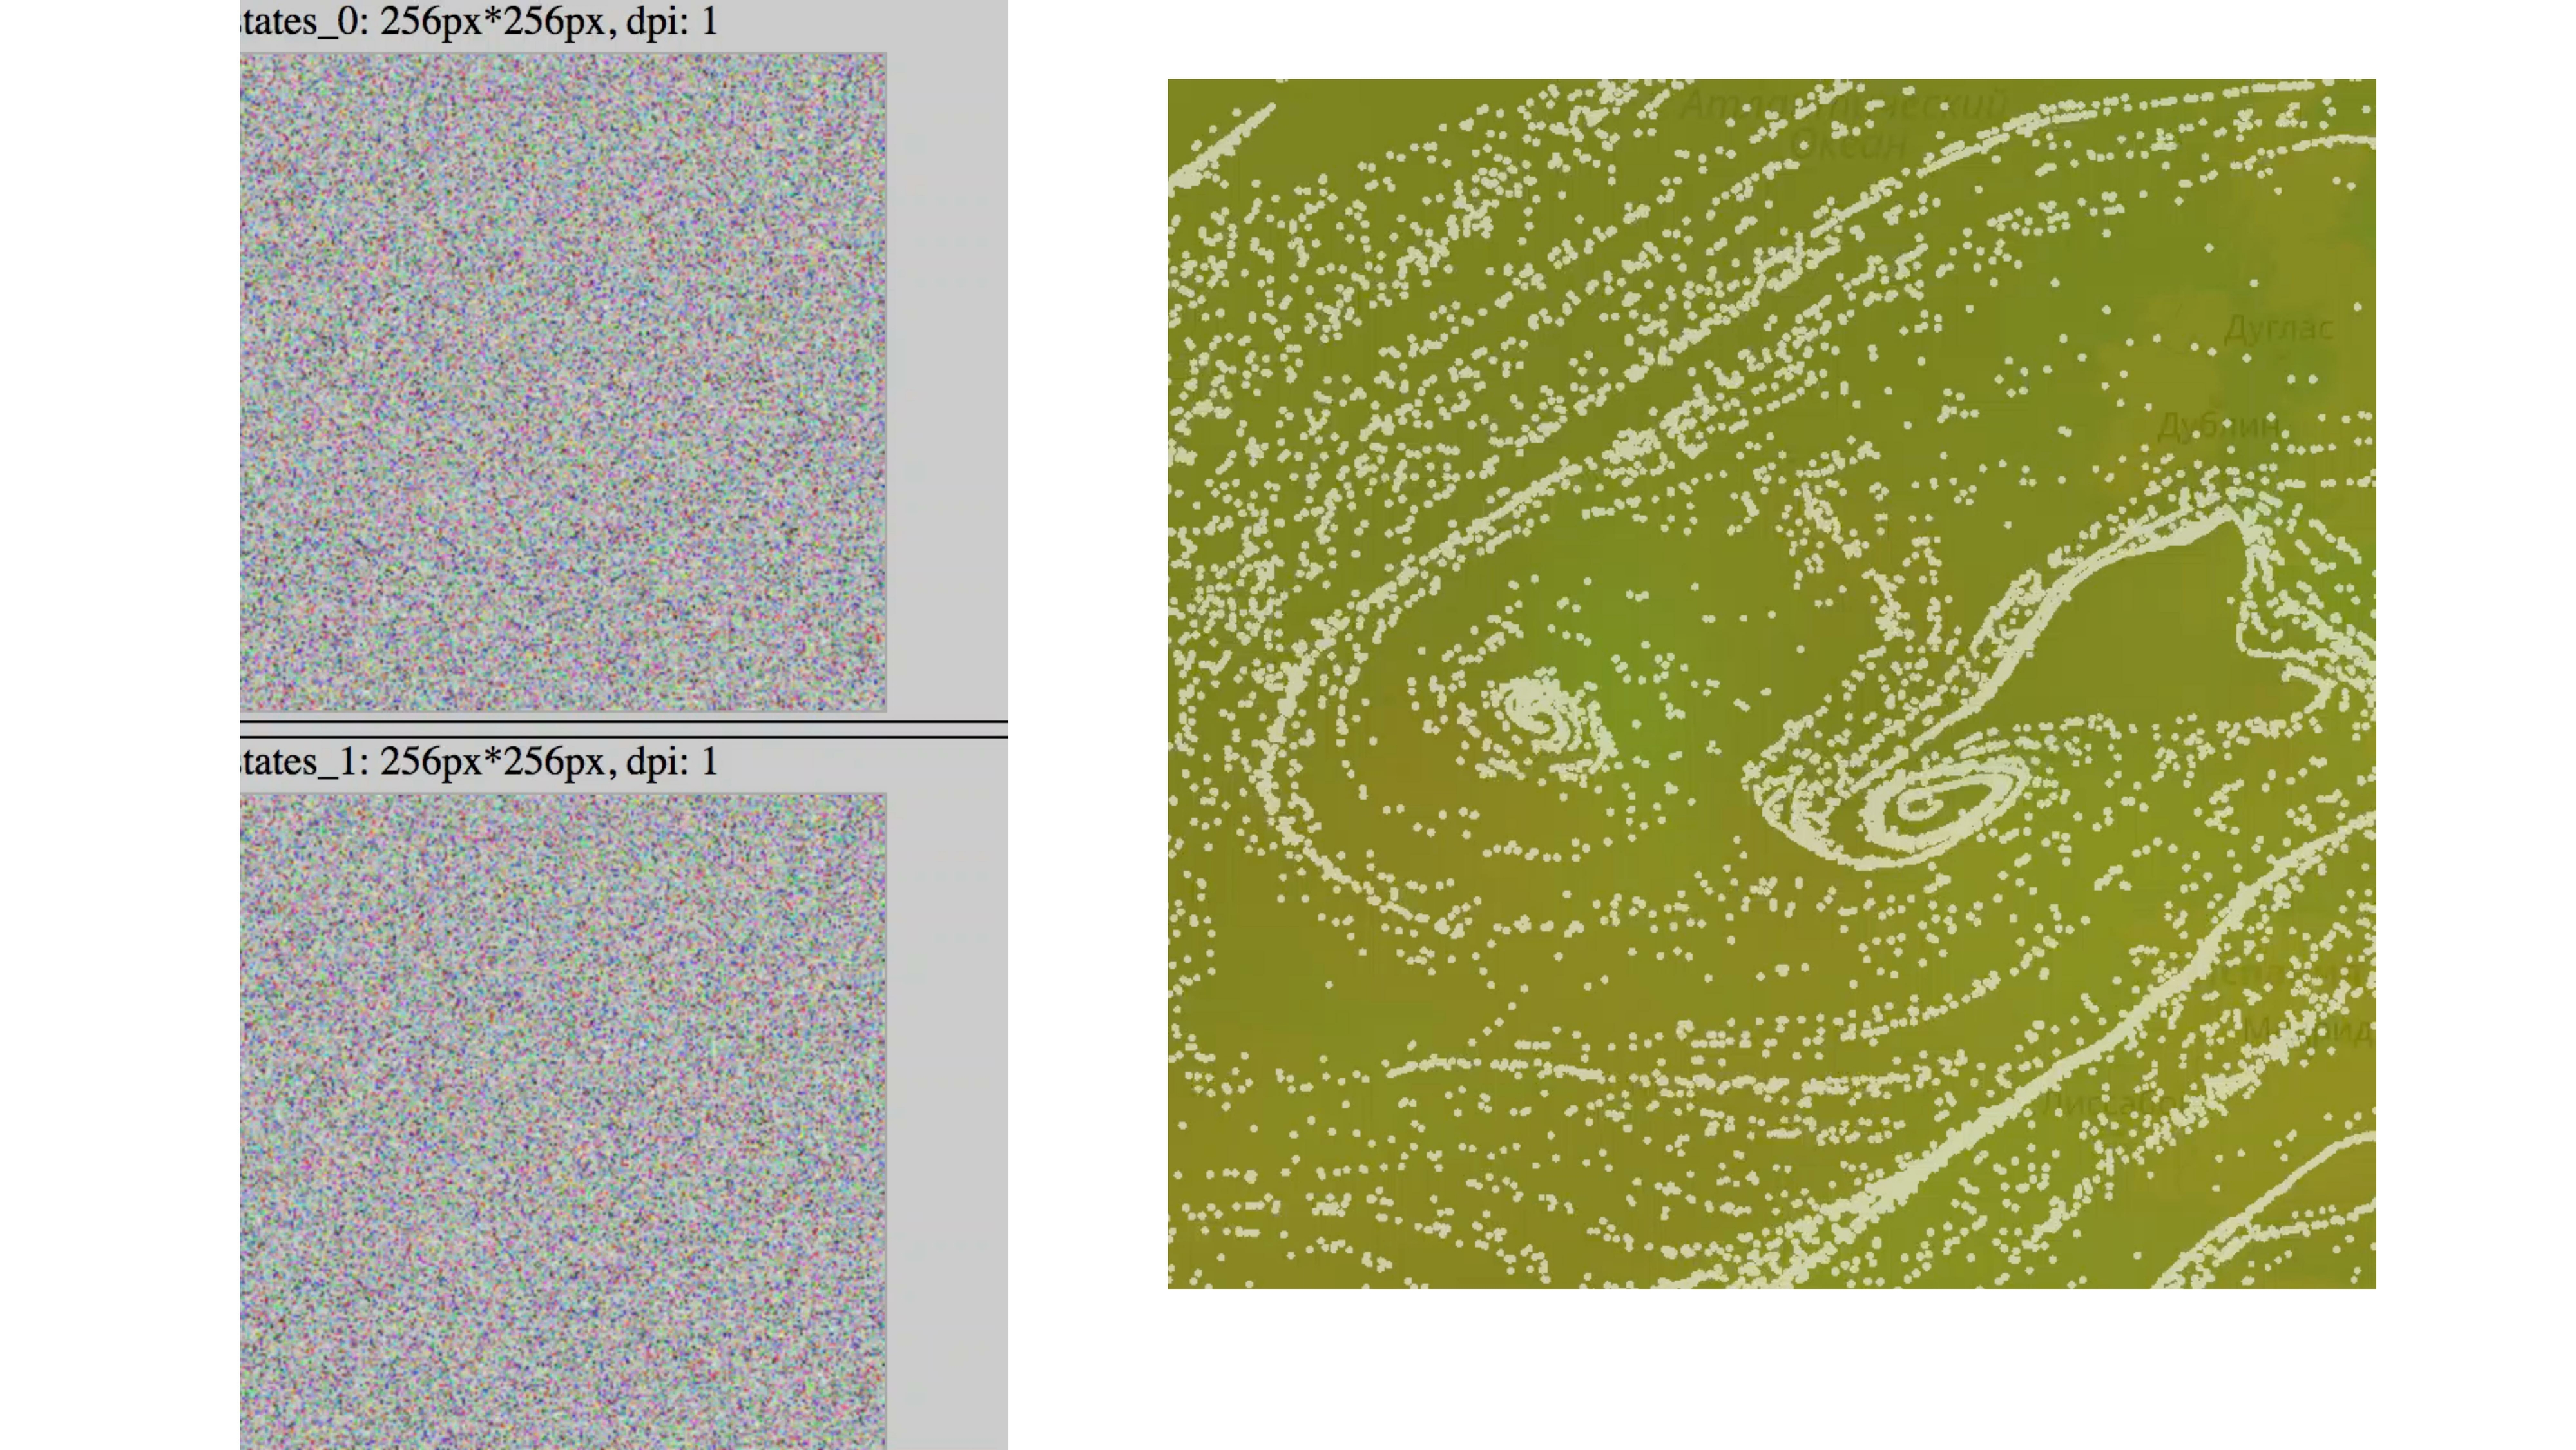
To avoid this, we introduce the particle permutation factor in a random place.
It depends on the current wind speed, on the current position of the particle and the random number that we transmit from JS - because in the first version of WebGL there is no randomization function built in and some noise-functions.
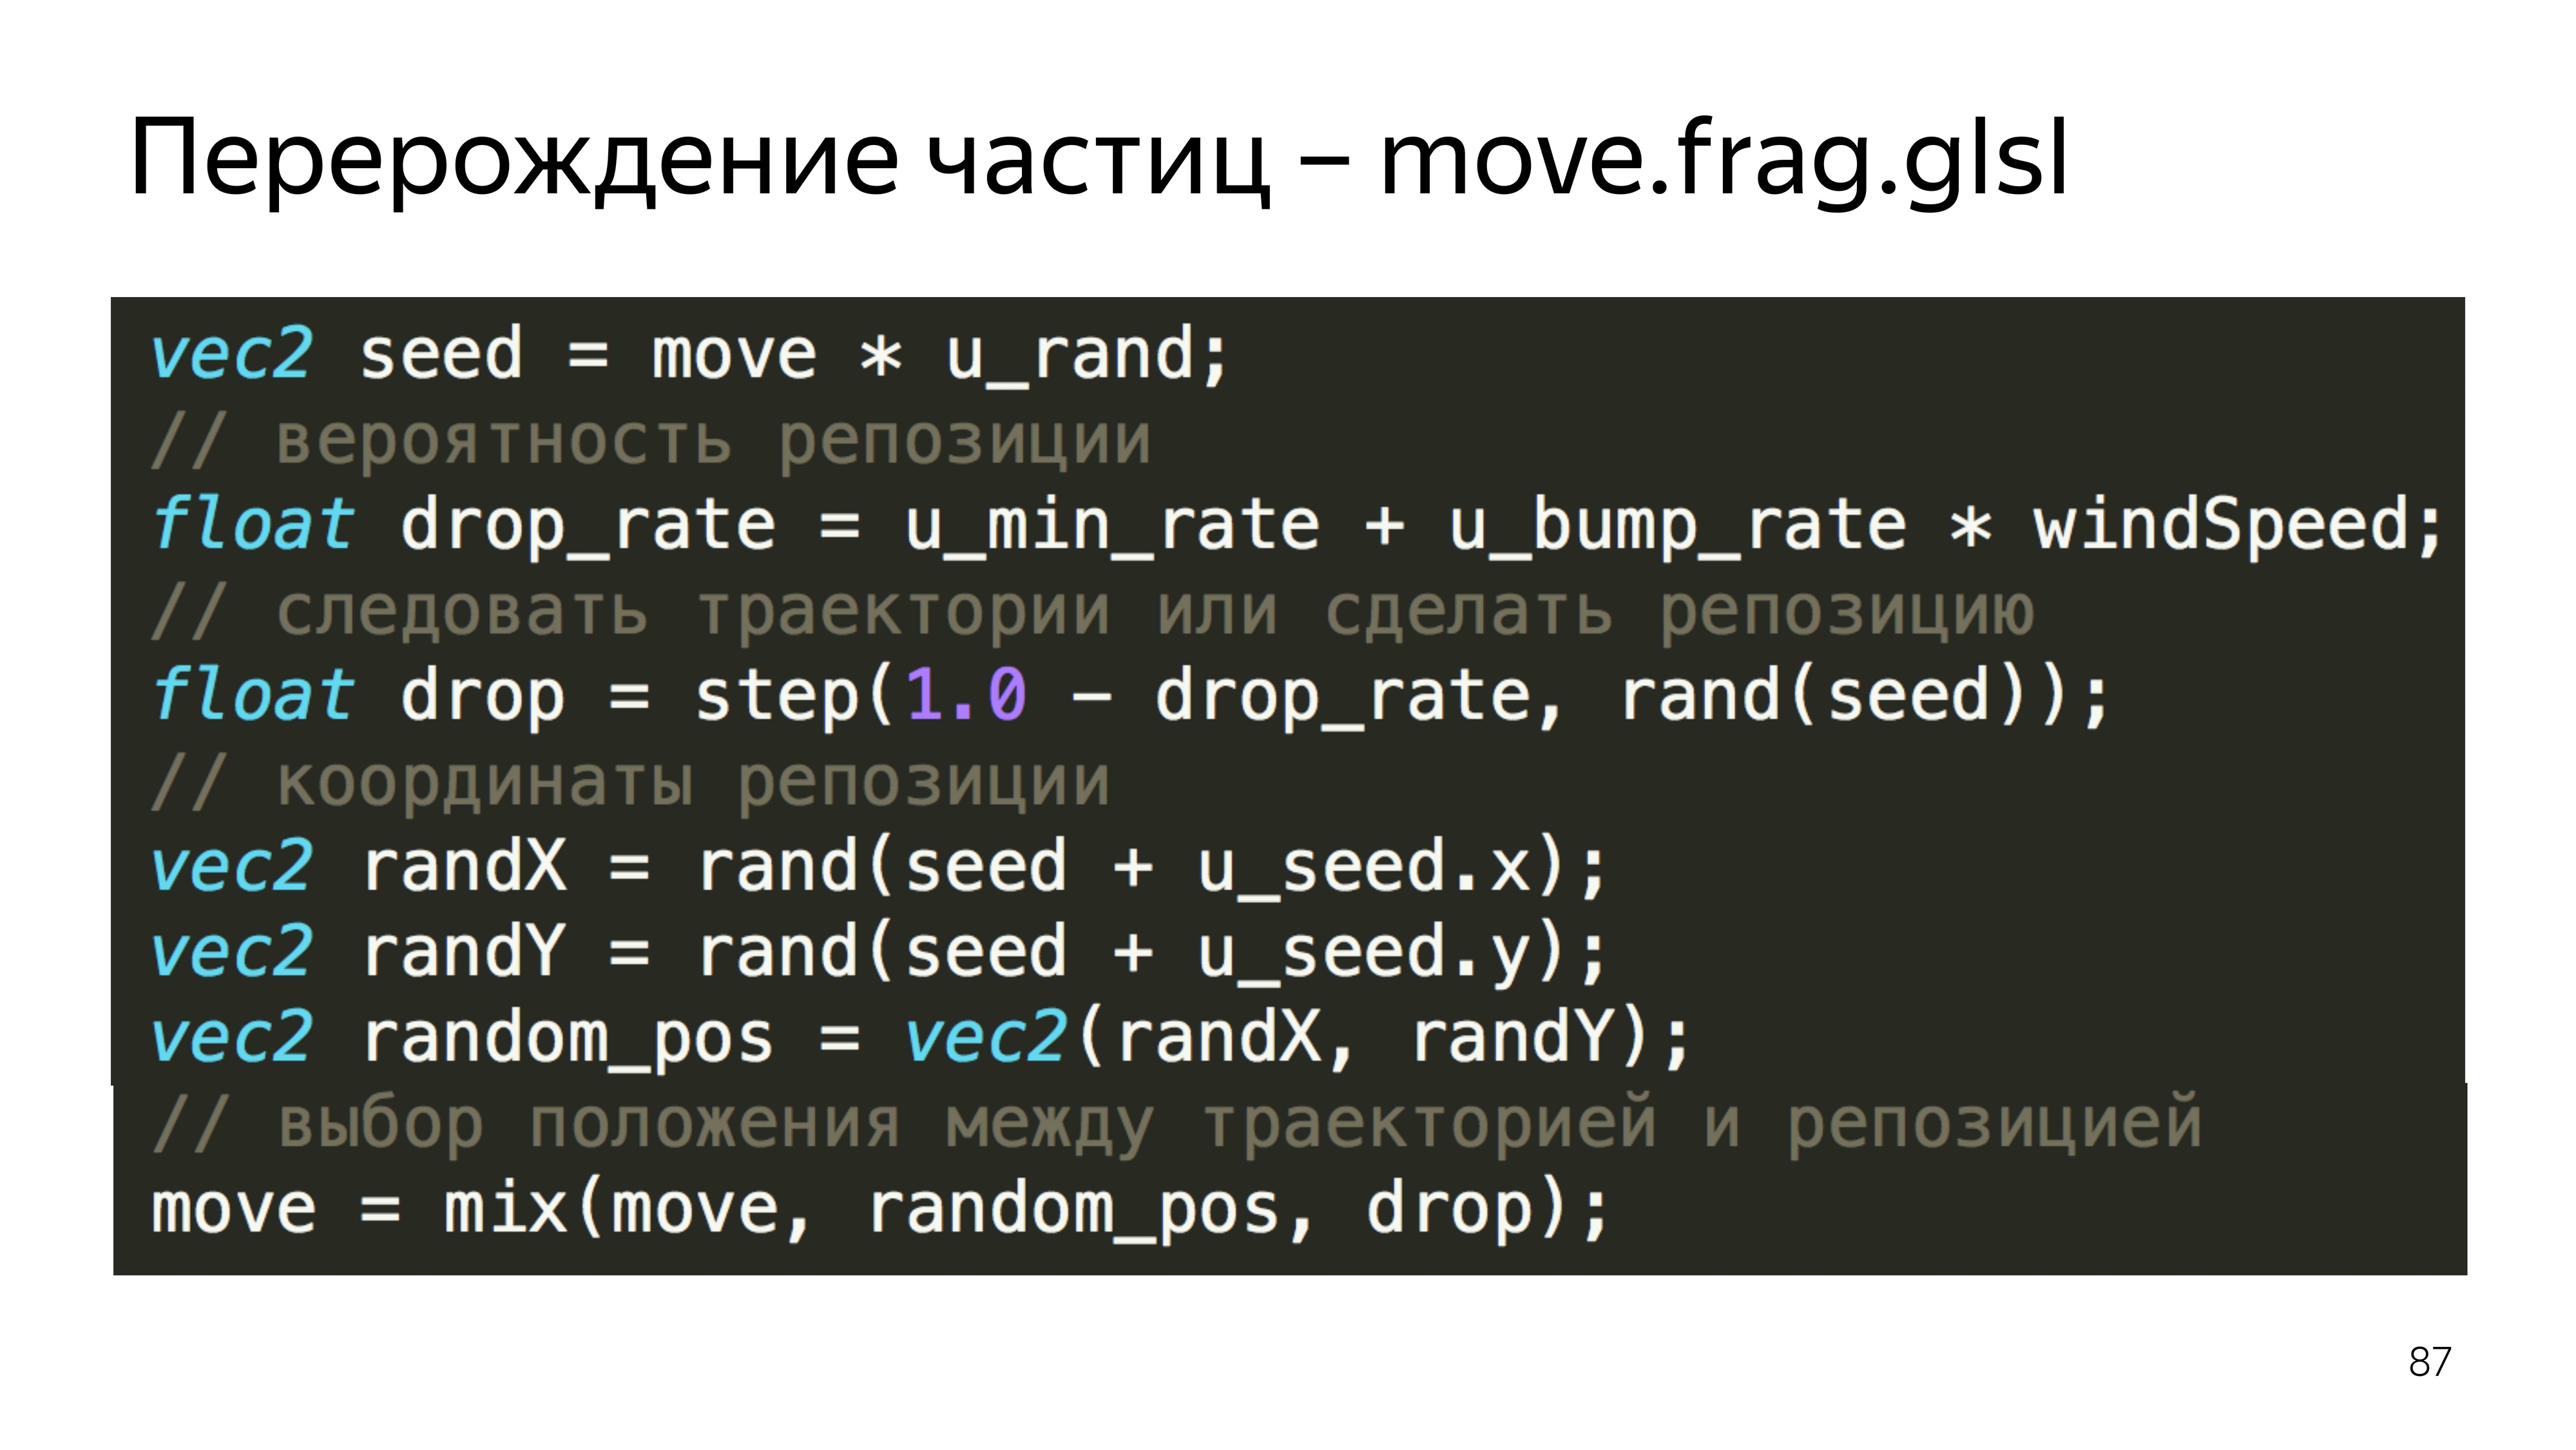
In this example, we calculate the predicted position of the particle, the random position, and choose either one or the other, depending on the reset factor.
To understand what was on the last slide, you can read these articles. The first provides a huge boost in understanding what WebGL gives, what it consists of and how not to err in it. At Khronos, this is a group that develops a standard; there is a description of all functions.

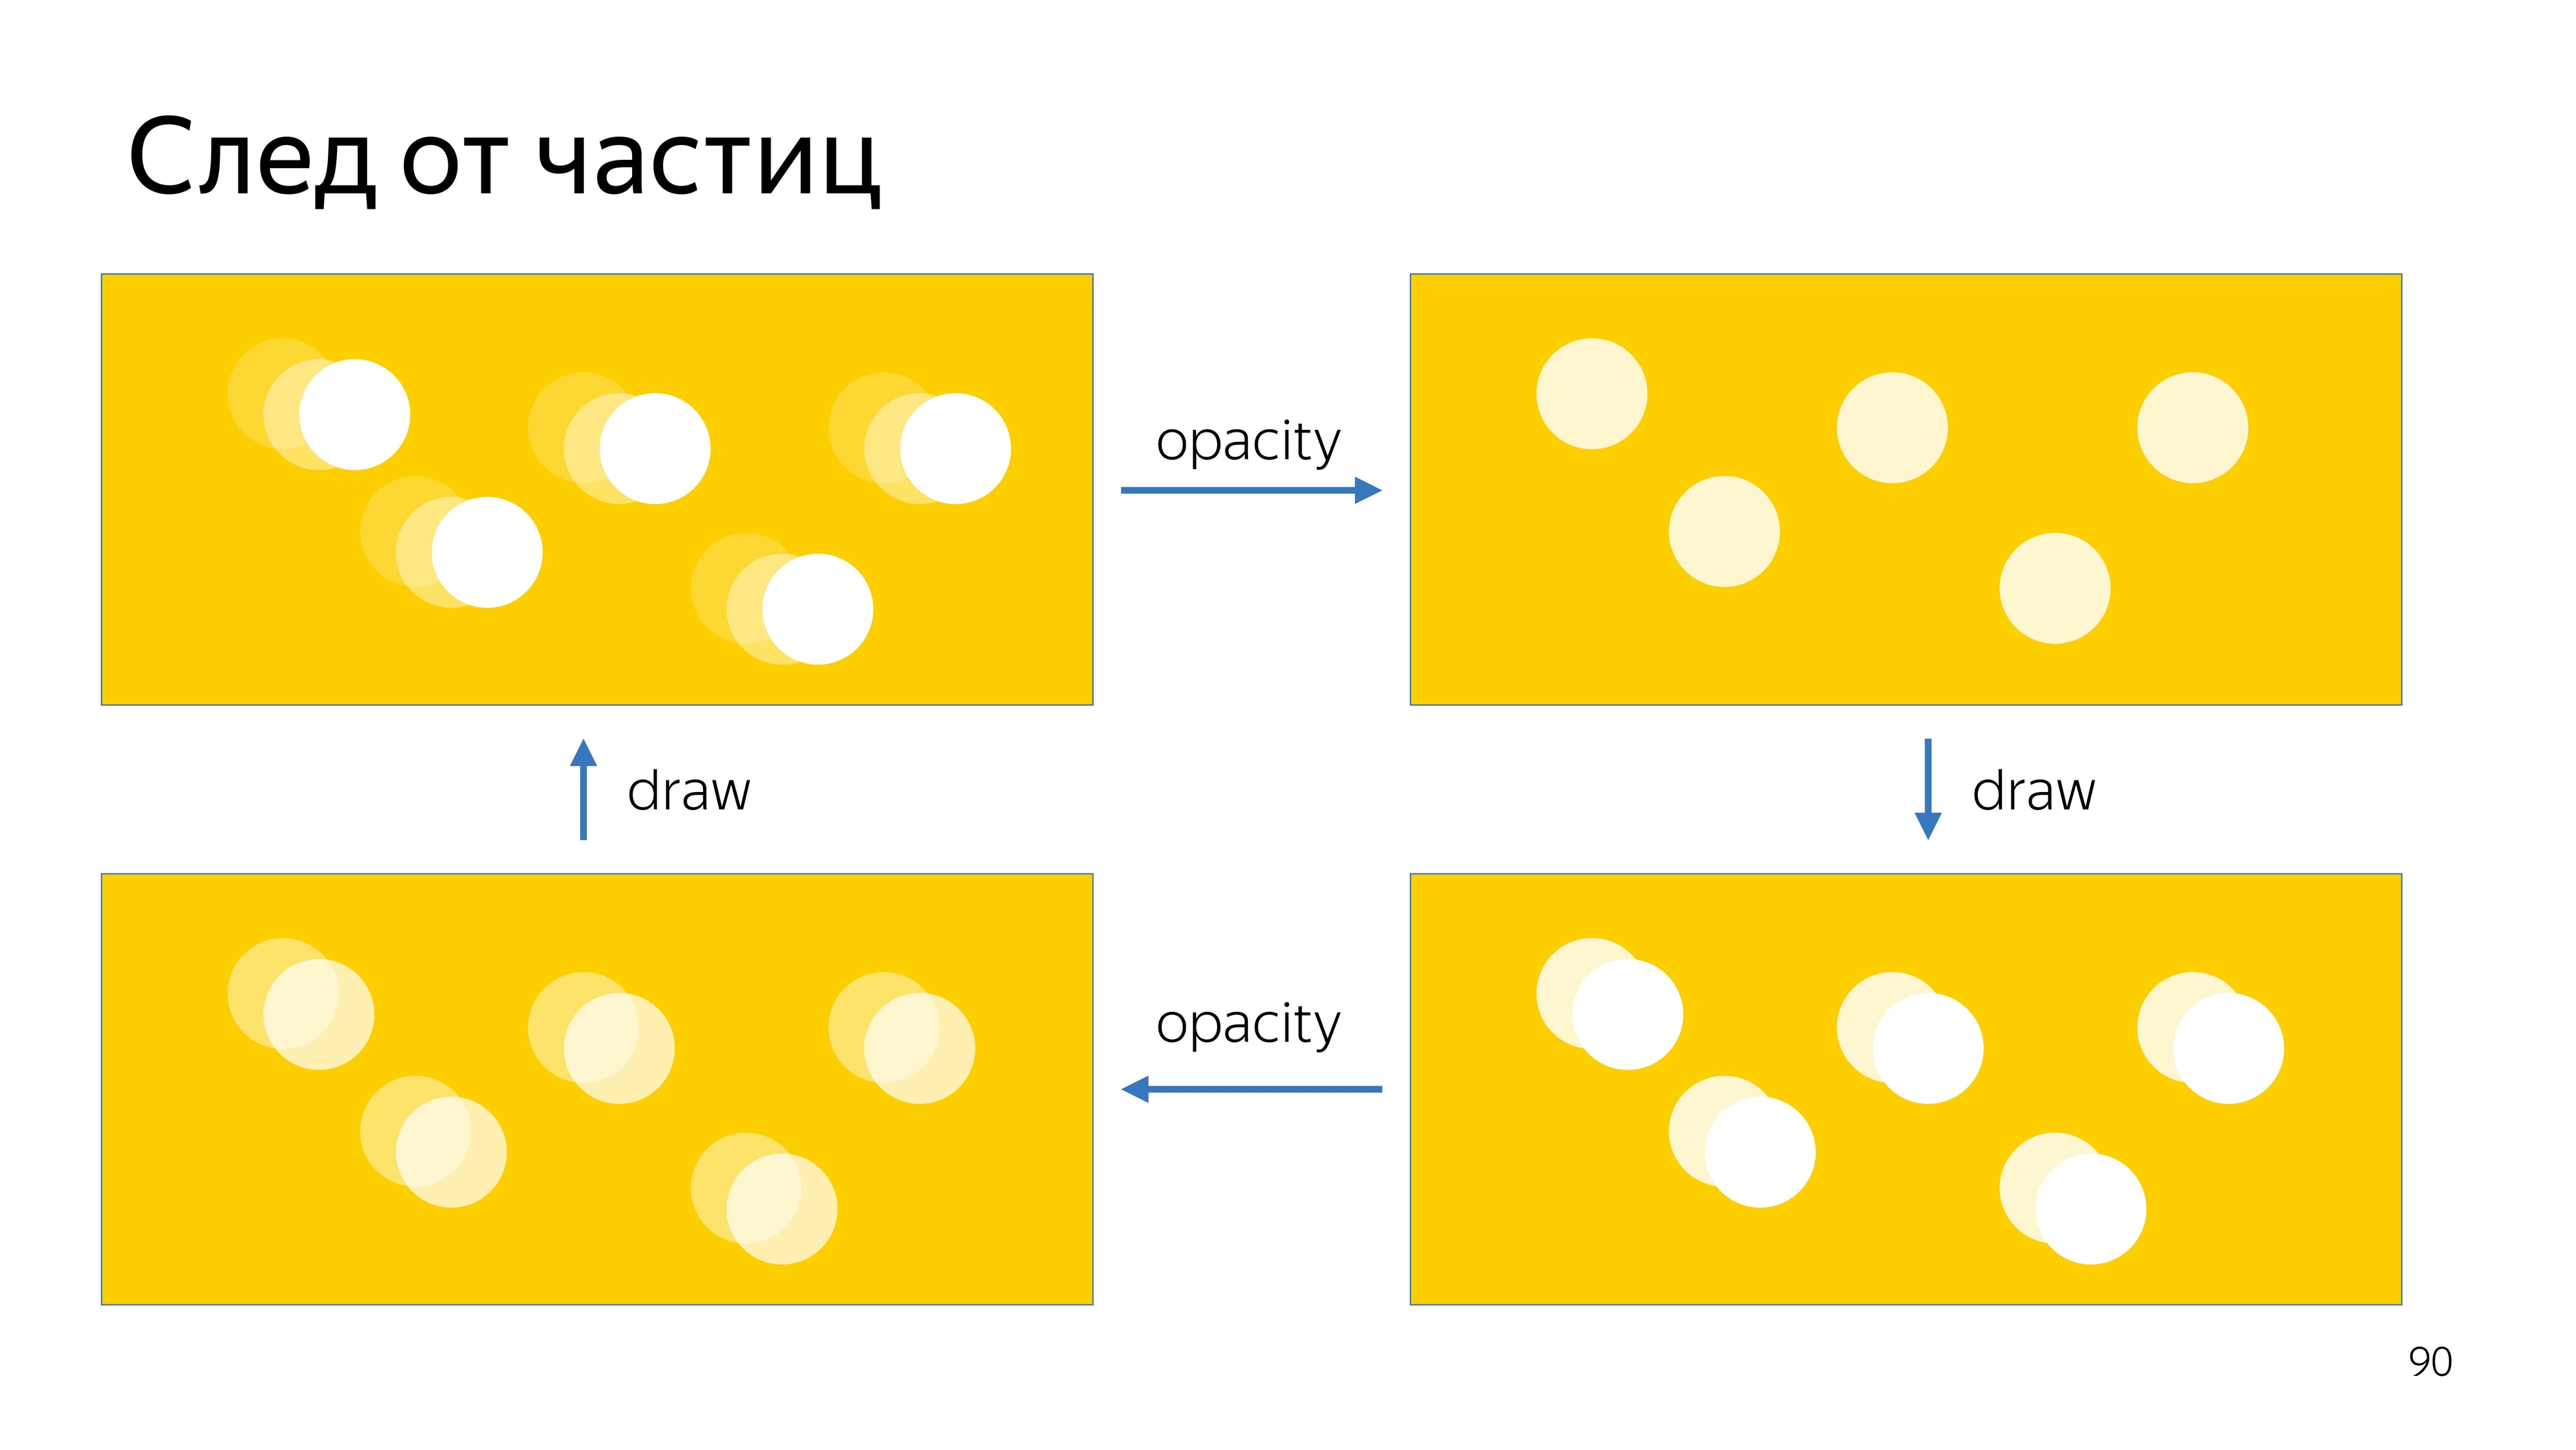
The last point of our task is to draw a trace from the particles. To do this, we will record the current position on the screen in two textures, and display the current position on the screen, slightly increasing its transparency, overlay the new position of the particles, then increase the transparency of this image and more impose a new position on top.
We get this animation plume.
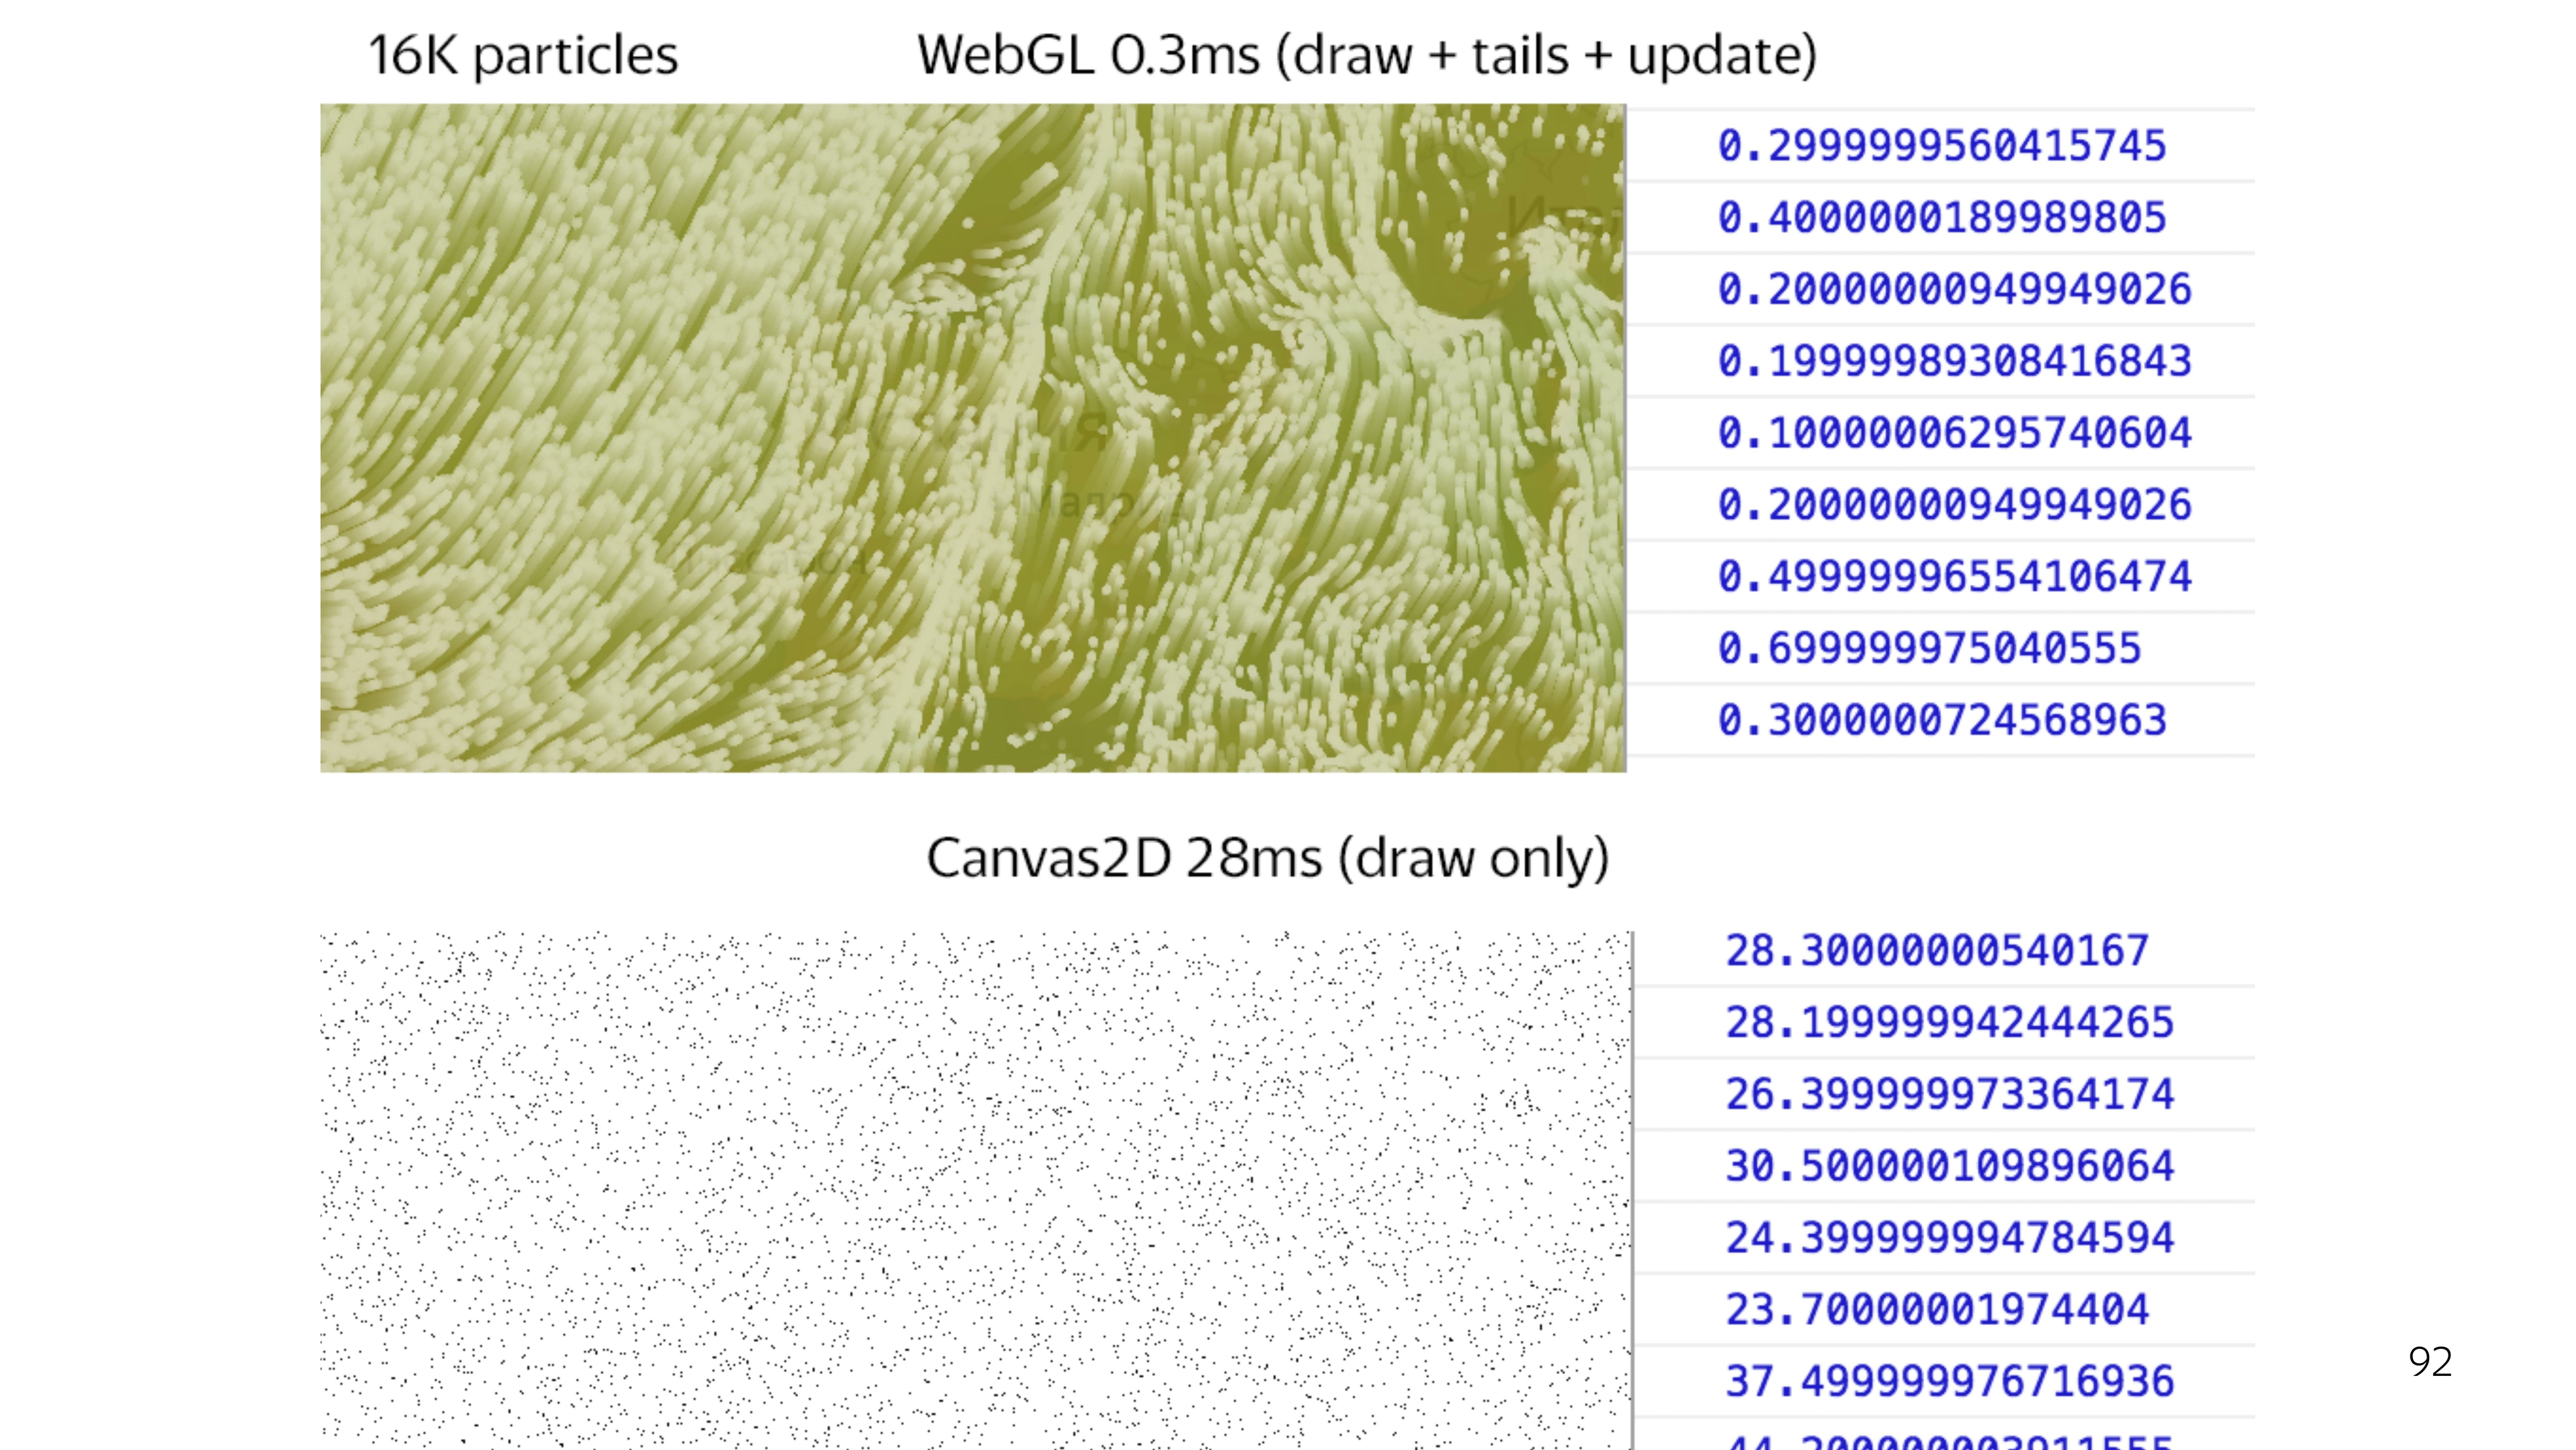
If you compare the full cycle of drawing WebGL with the output of some points on the screen using 2D canvas, you can see a big gap in speed. To draw 64 thousand points on 2D canvas, it takes an average of 25 ms, while WebGL blocks the main stream for 0.3 ms. This is a difference of a hundred times.
Thus, the use of WebGL allows you to less block the flow of the foundation, and this is especially important when working with the card when high responsiveness of the card itself is important.
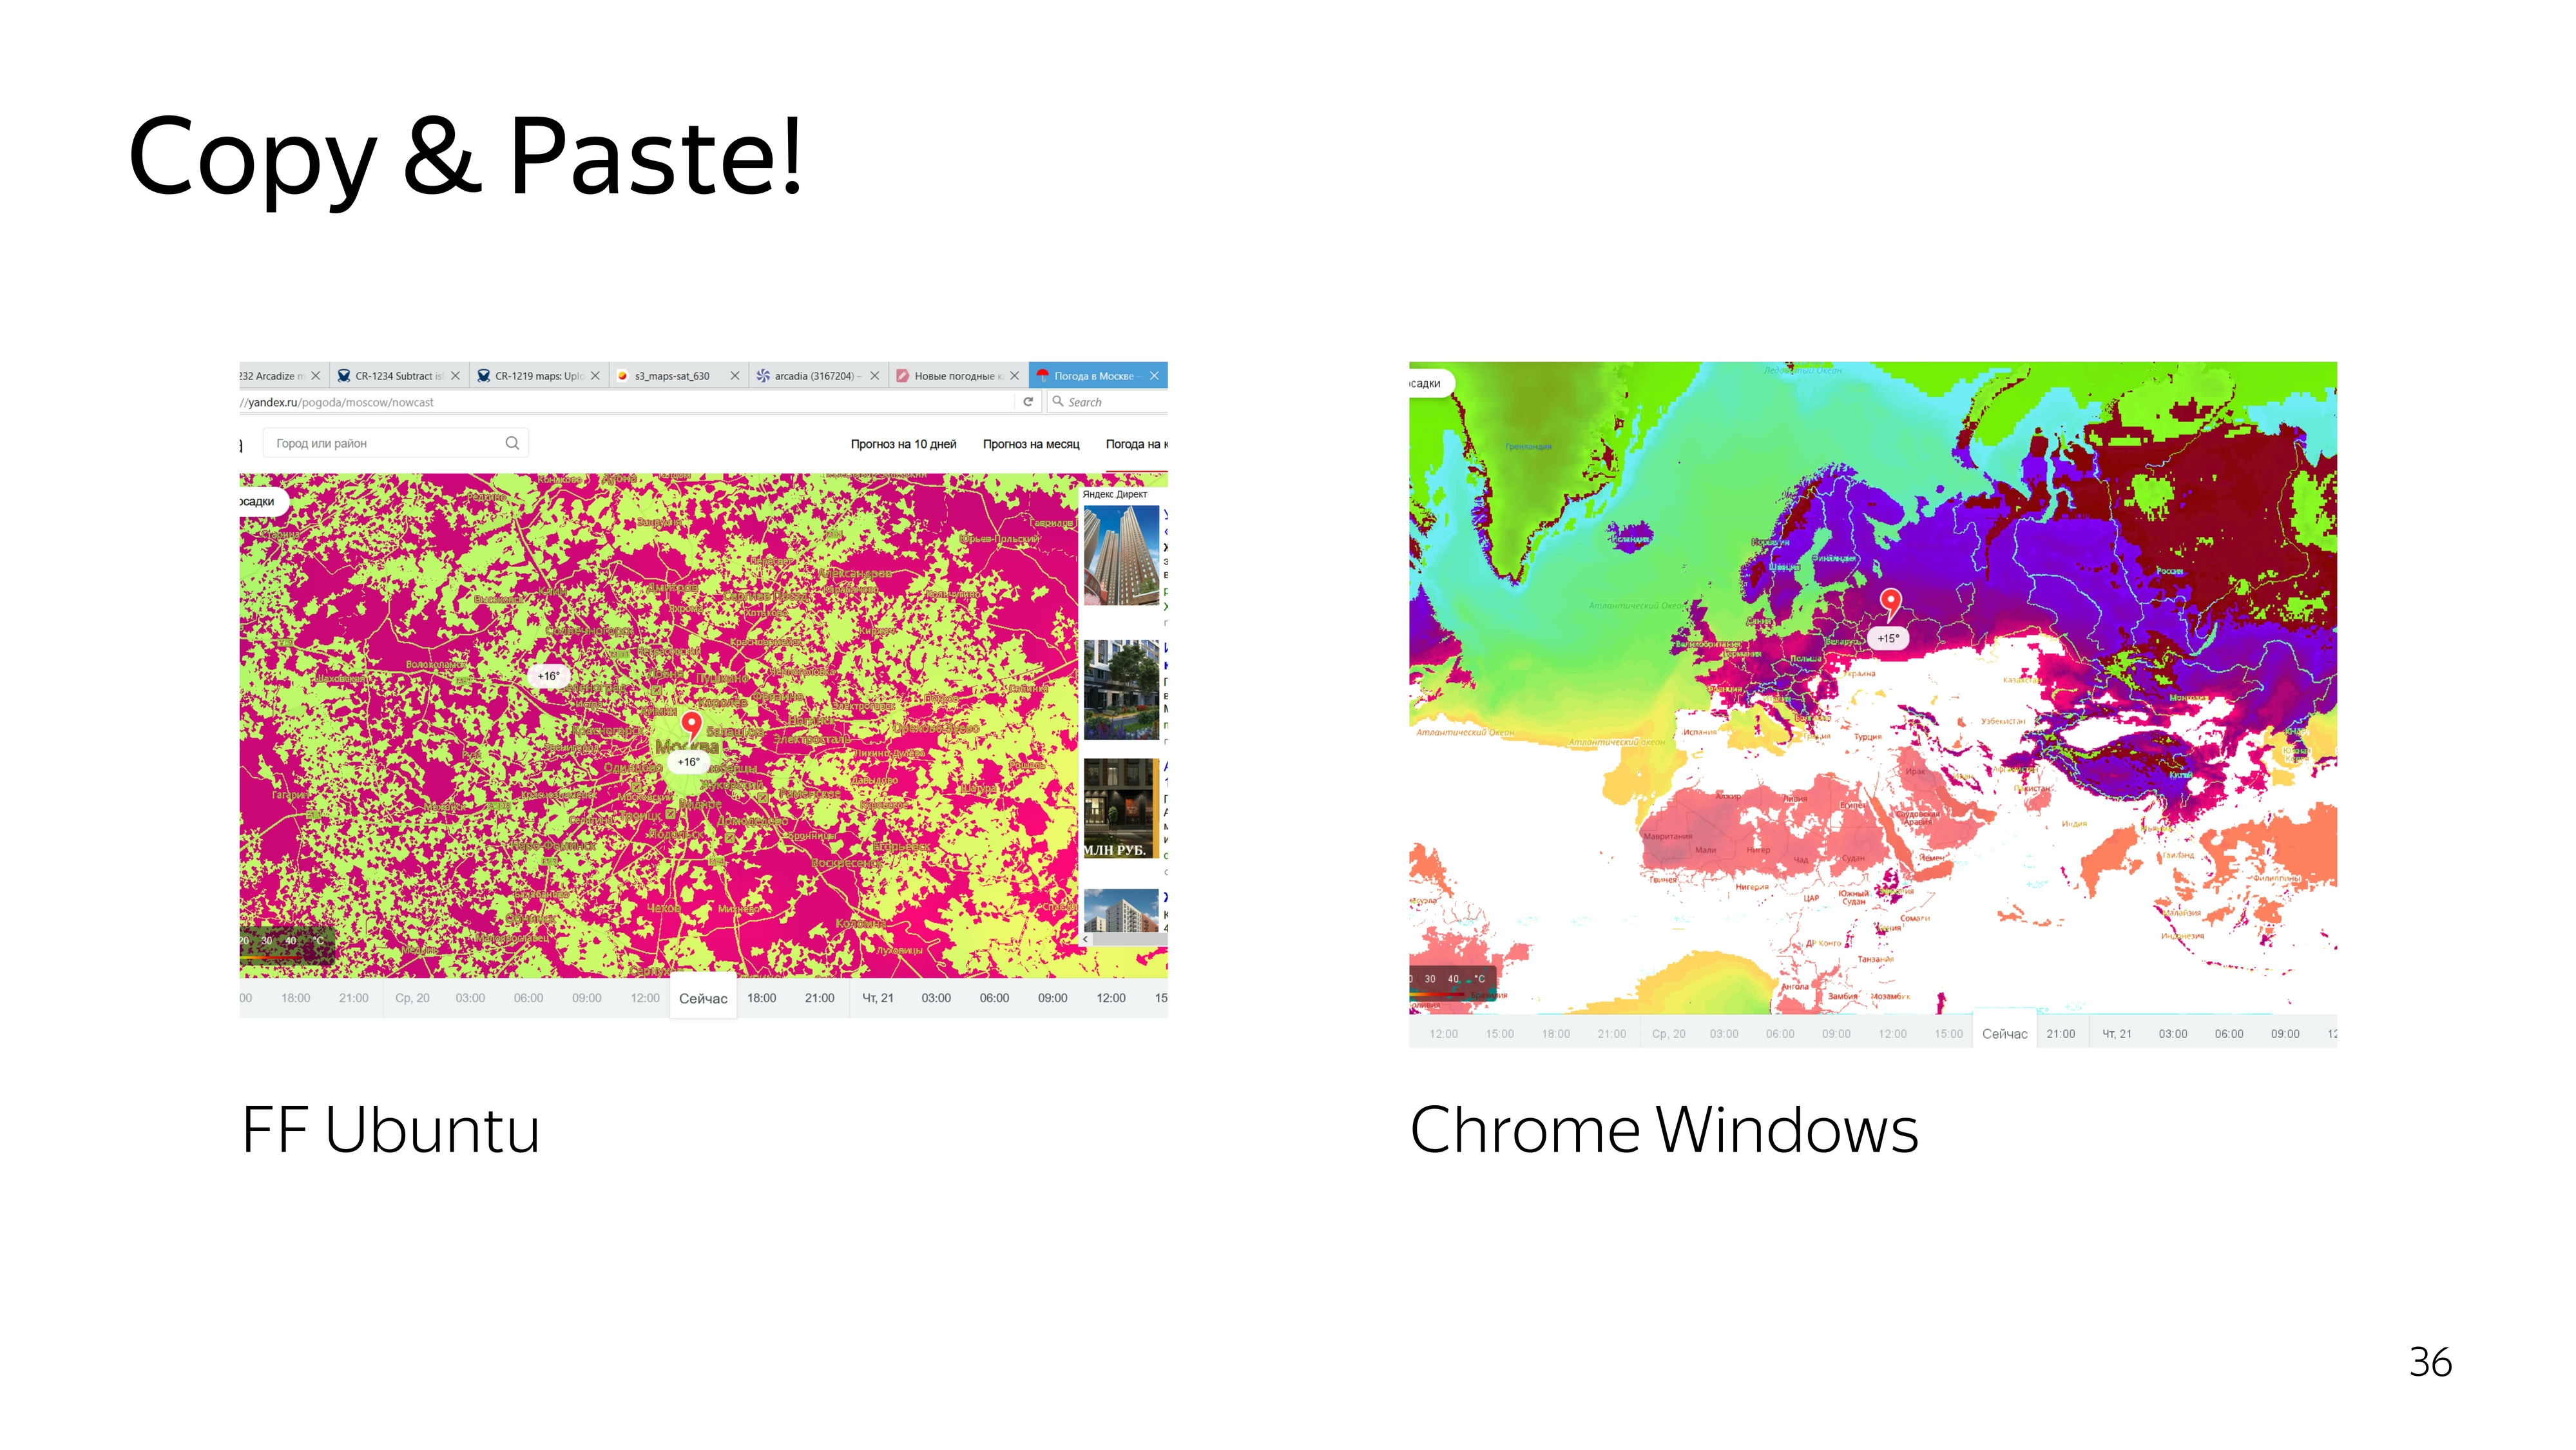
Initially, all developers are probably used to using the browser console to put some break points, console logs and see what is going on inside. WebGL is a black box.
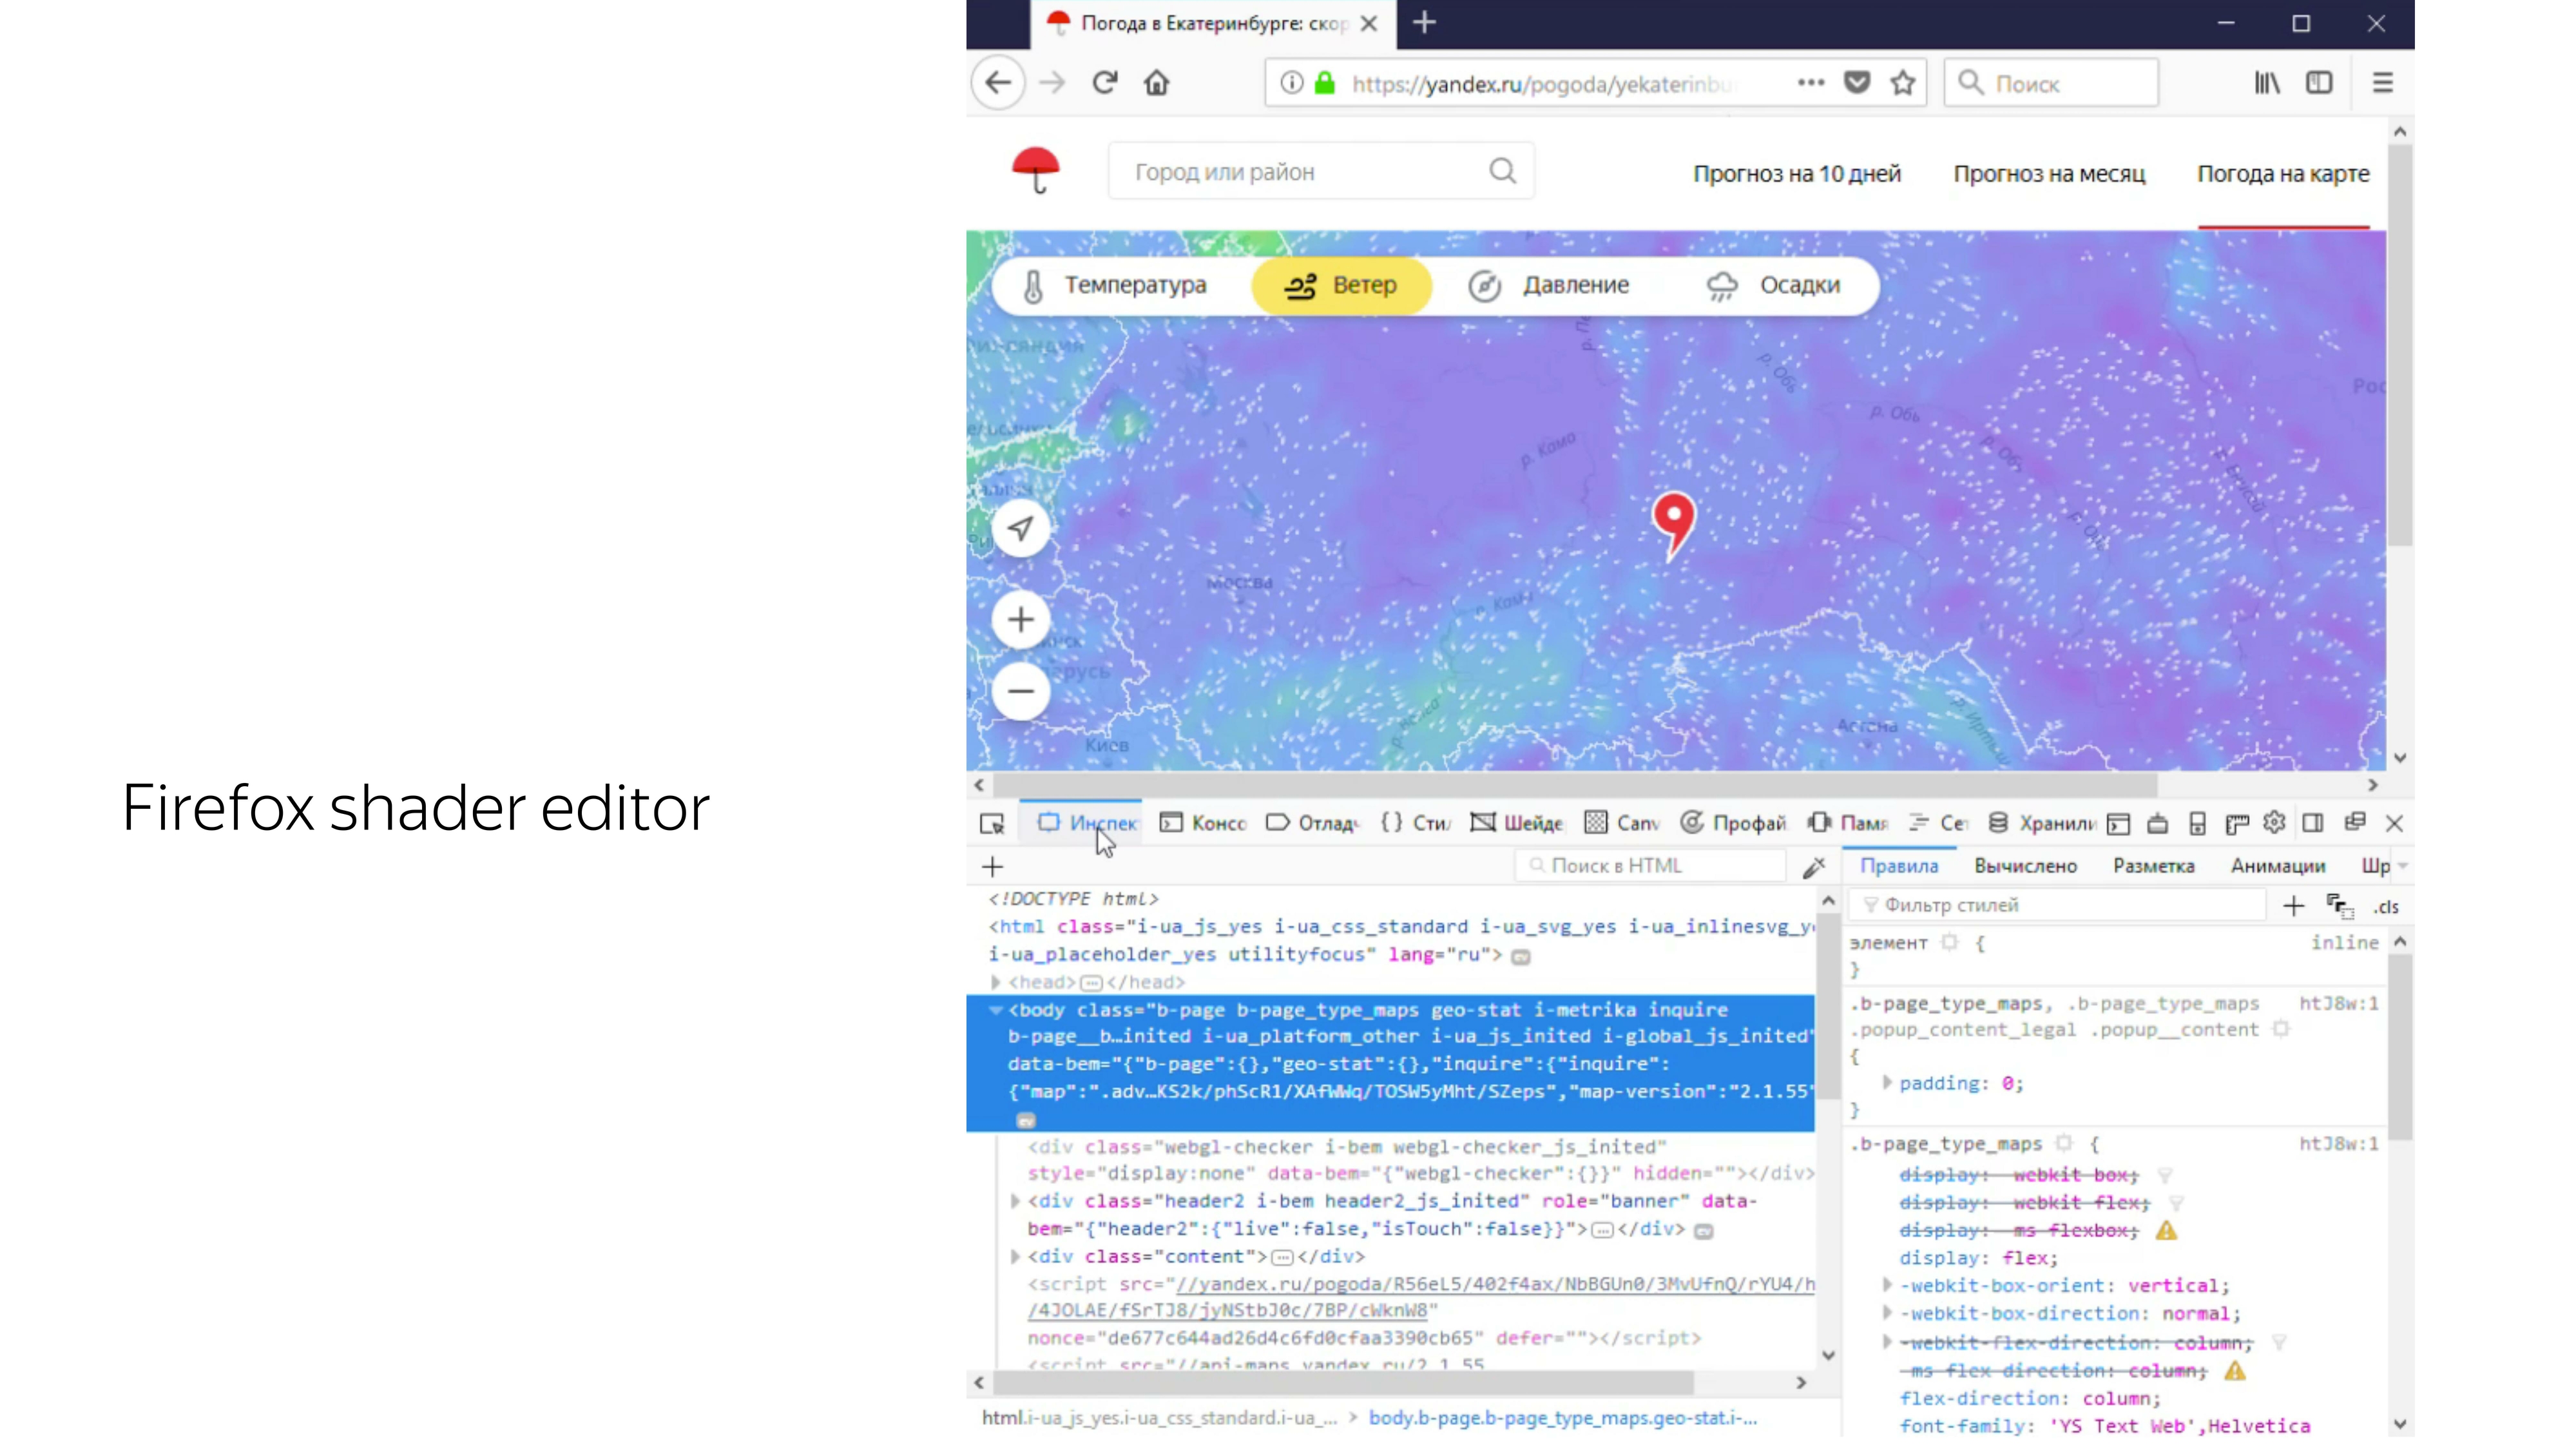
But there are some tools that allow you to work with him. For example, Firefox has a built-in “shaders” tab, where you can find WebGL banners on the fly, extract programs from them, extract shaders from them, and change values on the fly. For example, here on the fly the color of dots from white turns to blue.
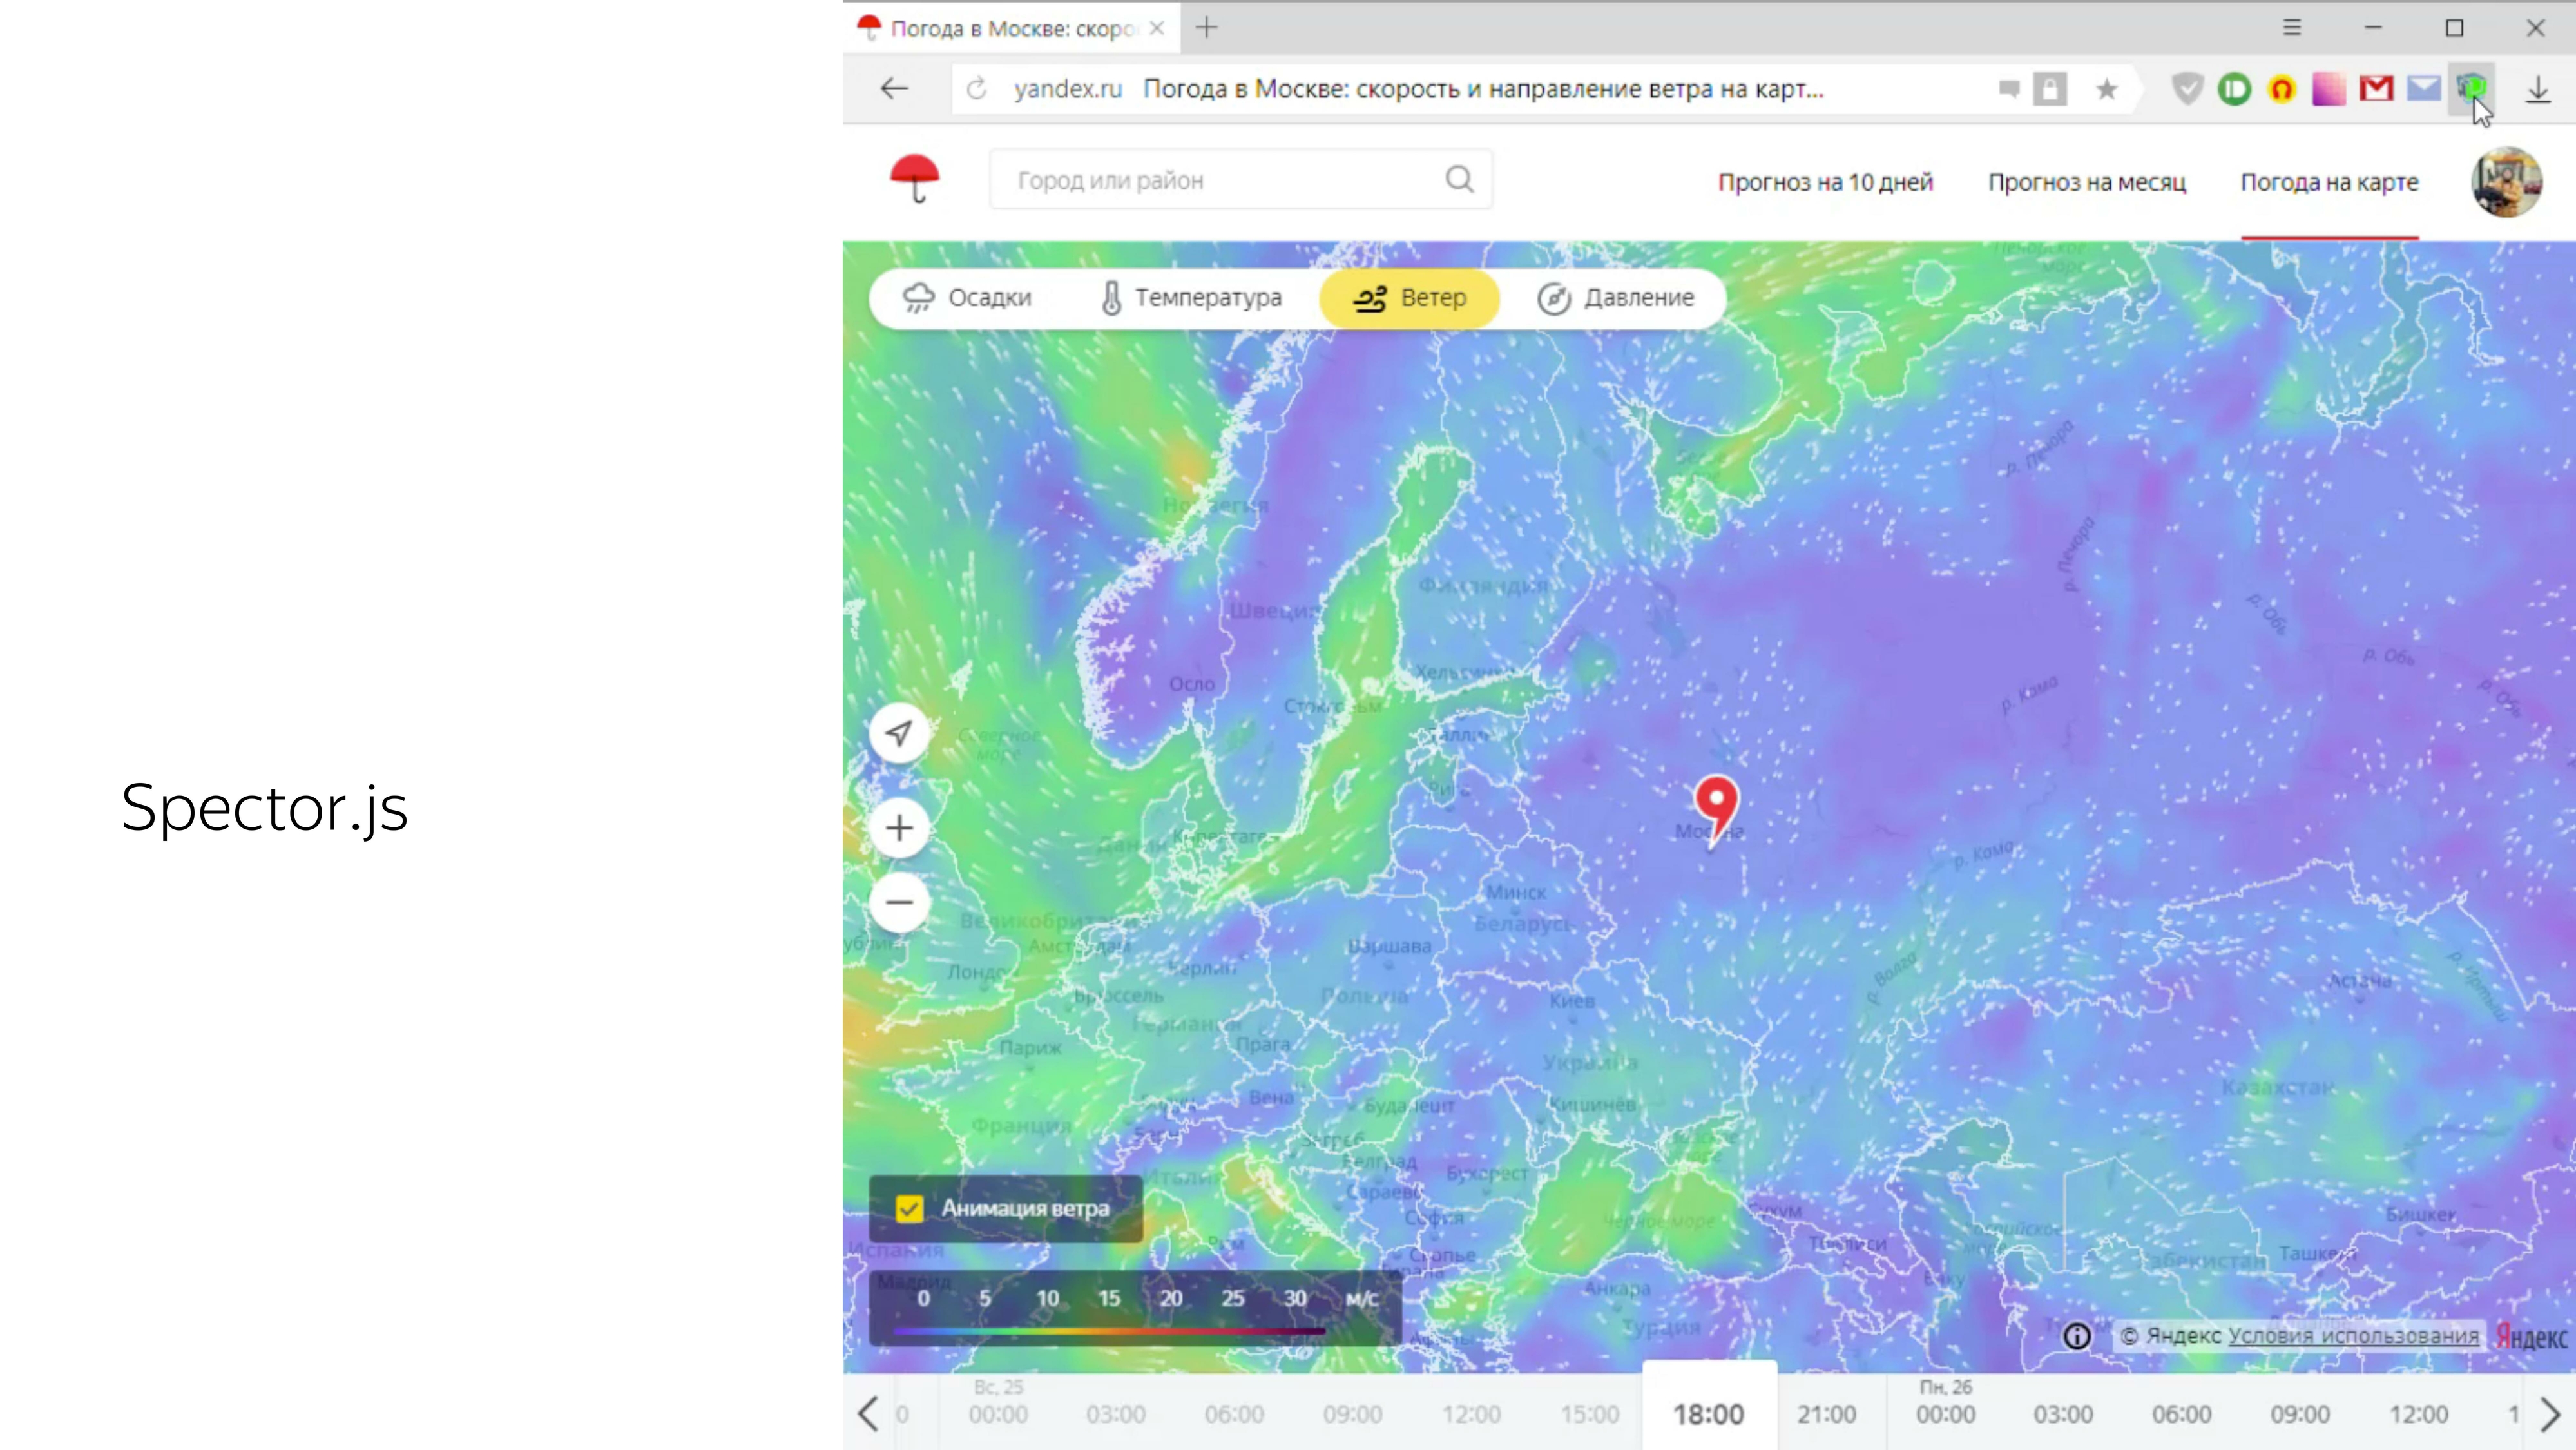
The second tool that makes life a lot easier is the Spector.js browser extension. It also captures the canvas from the WebGL context and allows you to see all the operations performed on this canvas, timings, and passed variables.

Total for the week of work we got a ready-made solution to the wind from scratch . Hopefully, I was able to tell what kind of technology it is, WebGL, what it consists of, and give a real example of its use in sales. That's all.
- I am developing interfaces in the Ekaterinburg office of Yandex. I started in the group Sport. We were developing sports special projects, when there were the World Championships in hockey, football, the Olympics, the Paralympics and other cool events. I also worked on the development of a special search results, which was dedicated to the new Sochi highway.
Link from the slide
In addition, in one and a half helmets, we restarted the service Work on the bugs. And then work began in Weather, where I was engaged in supporting the API functionality, its development, writing the infrastructure around this API, and writing node binding to the trained machine learning formulas.
Then the work began more interesting. He participated in the redesign of our weather services. Desktop, tachi.
After we brought the standard projections in order, we decided to make one that no one has. This forecast was a forecast of the movement of precipitation in the territories.
There are special meteorological radars that detect precipitation within a radius of 2,000 km, they know their density and distance to them.
Using this data and predicting their further movement using machine learning, we madesuch visualization on the map. You can move back and forth.
Link from the slide
We looked at the reviews of people. People liked it. All kinds of memesics began to appear, and there were cool pictures when Moscow was flooded.
Since everyone liked the format, we decided to move on and devote the next forecast to the wind.
Services that show the forecast of the wind, is already there. This is a pair of cool, particularly prominent.
Looking at them, we realized that we wanted to do the same - or, at least, not worse.
Therefore, we decided to visualize particles that smoothly move around the map, depending on the wind speed, and leave some trail behind them so that they can be seen, the wind path can be seen.
Since we already did a great job and made a cool rainfall map using 2D canvas, we decided to do the same with particles.
After consulting with the designer, we realized that we need approximately 6% of the screen to be filled with particles in order to have a cool effect.
To draw such a number of particles with a standard approach, we have a minimum timing of 5 ms.
If we think that we still need to move the particles and impose some kind of beauty like drawing the tail of the particles, we can assume that we will fall out for a minimum timeout of 40 ms to show smooth animation in order to produce at least 25 frames per second.
The problem is that here each particle would be processed sequentially. But what if you process them in parallel?
A visual difference in the work of the central and graphic processor was shown by the “Destroyers of Legends” at one of the conferences. They rolled out a typewriter on which a paintball marker was installed, the task of which was to draw a smiley with one color. In about 10 seconds, he drew such a picture. ( Link to video - ed.)
Then the guys rolled out the canoes, which is a GPU, and a couple of spits drew Mona Lisa. Approximately the speed of computing CPU and GPU is different.
To take advantage of such features in the browser, the technology WebGL was invented.
What it is? With this question I got into the Internet. Having added a couple of words with particle animation and wind, I found a couple of articles.
Links from the slide: first , second
One of them is a demo of Vladimir Agafonkin, an engineer from Mapbox, who made the wind on WebGL and referred to the blog of Chris Wellas who talked about how to move and store the state of particles on the GPU.
We take and copy. We expect this result. Here the particles move smoothly.
We get do not understand what.
We are trying to deal with the code. We improve, again we get an unsatisfactory result. We climb even deeper - we get rain instead of wind.
Okay, we decide to do it yourself.
To work with WebGL, there are frameworks. Almost all of them are aimed at working with 3D-objects. We do not need these 3D features. We only need to draw a particle and move it. Therefore, we decide to do everything by hand.
There are currently two versions of the WebGL technology. The second version, which is cool, has a high modern version of the programming language in which the program runs in the graphics adapter, can perform straightforward computations, and not just rendering. But it has poor compatibility.
Well, we decide to use the old proven WebGL 1, which has good support, except Opera Mini, which nobody needs.
WebGL is a two-piece thing. This is JS, which executes the state of the programs that run on the graphics card. And there are components that run right on the graphics card.
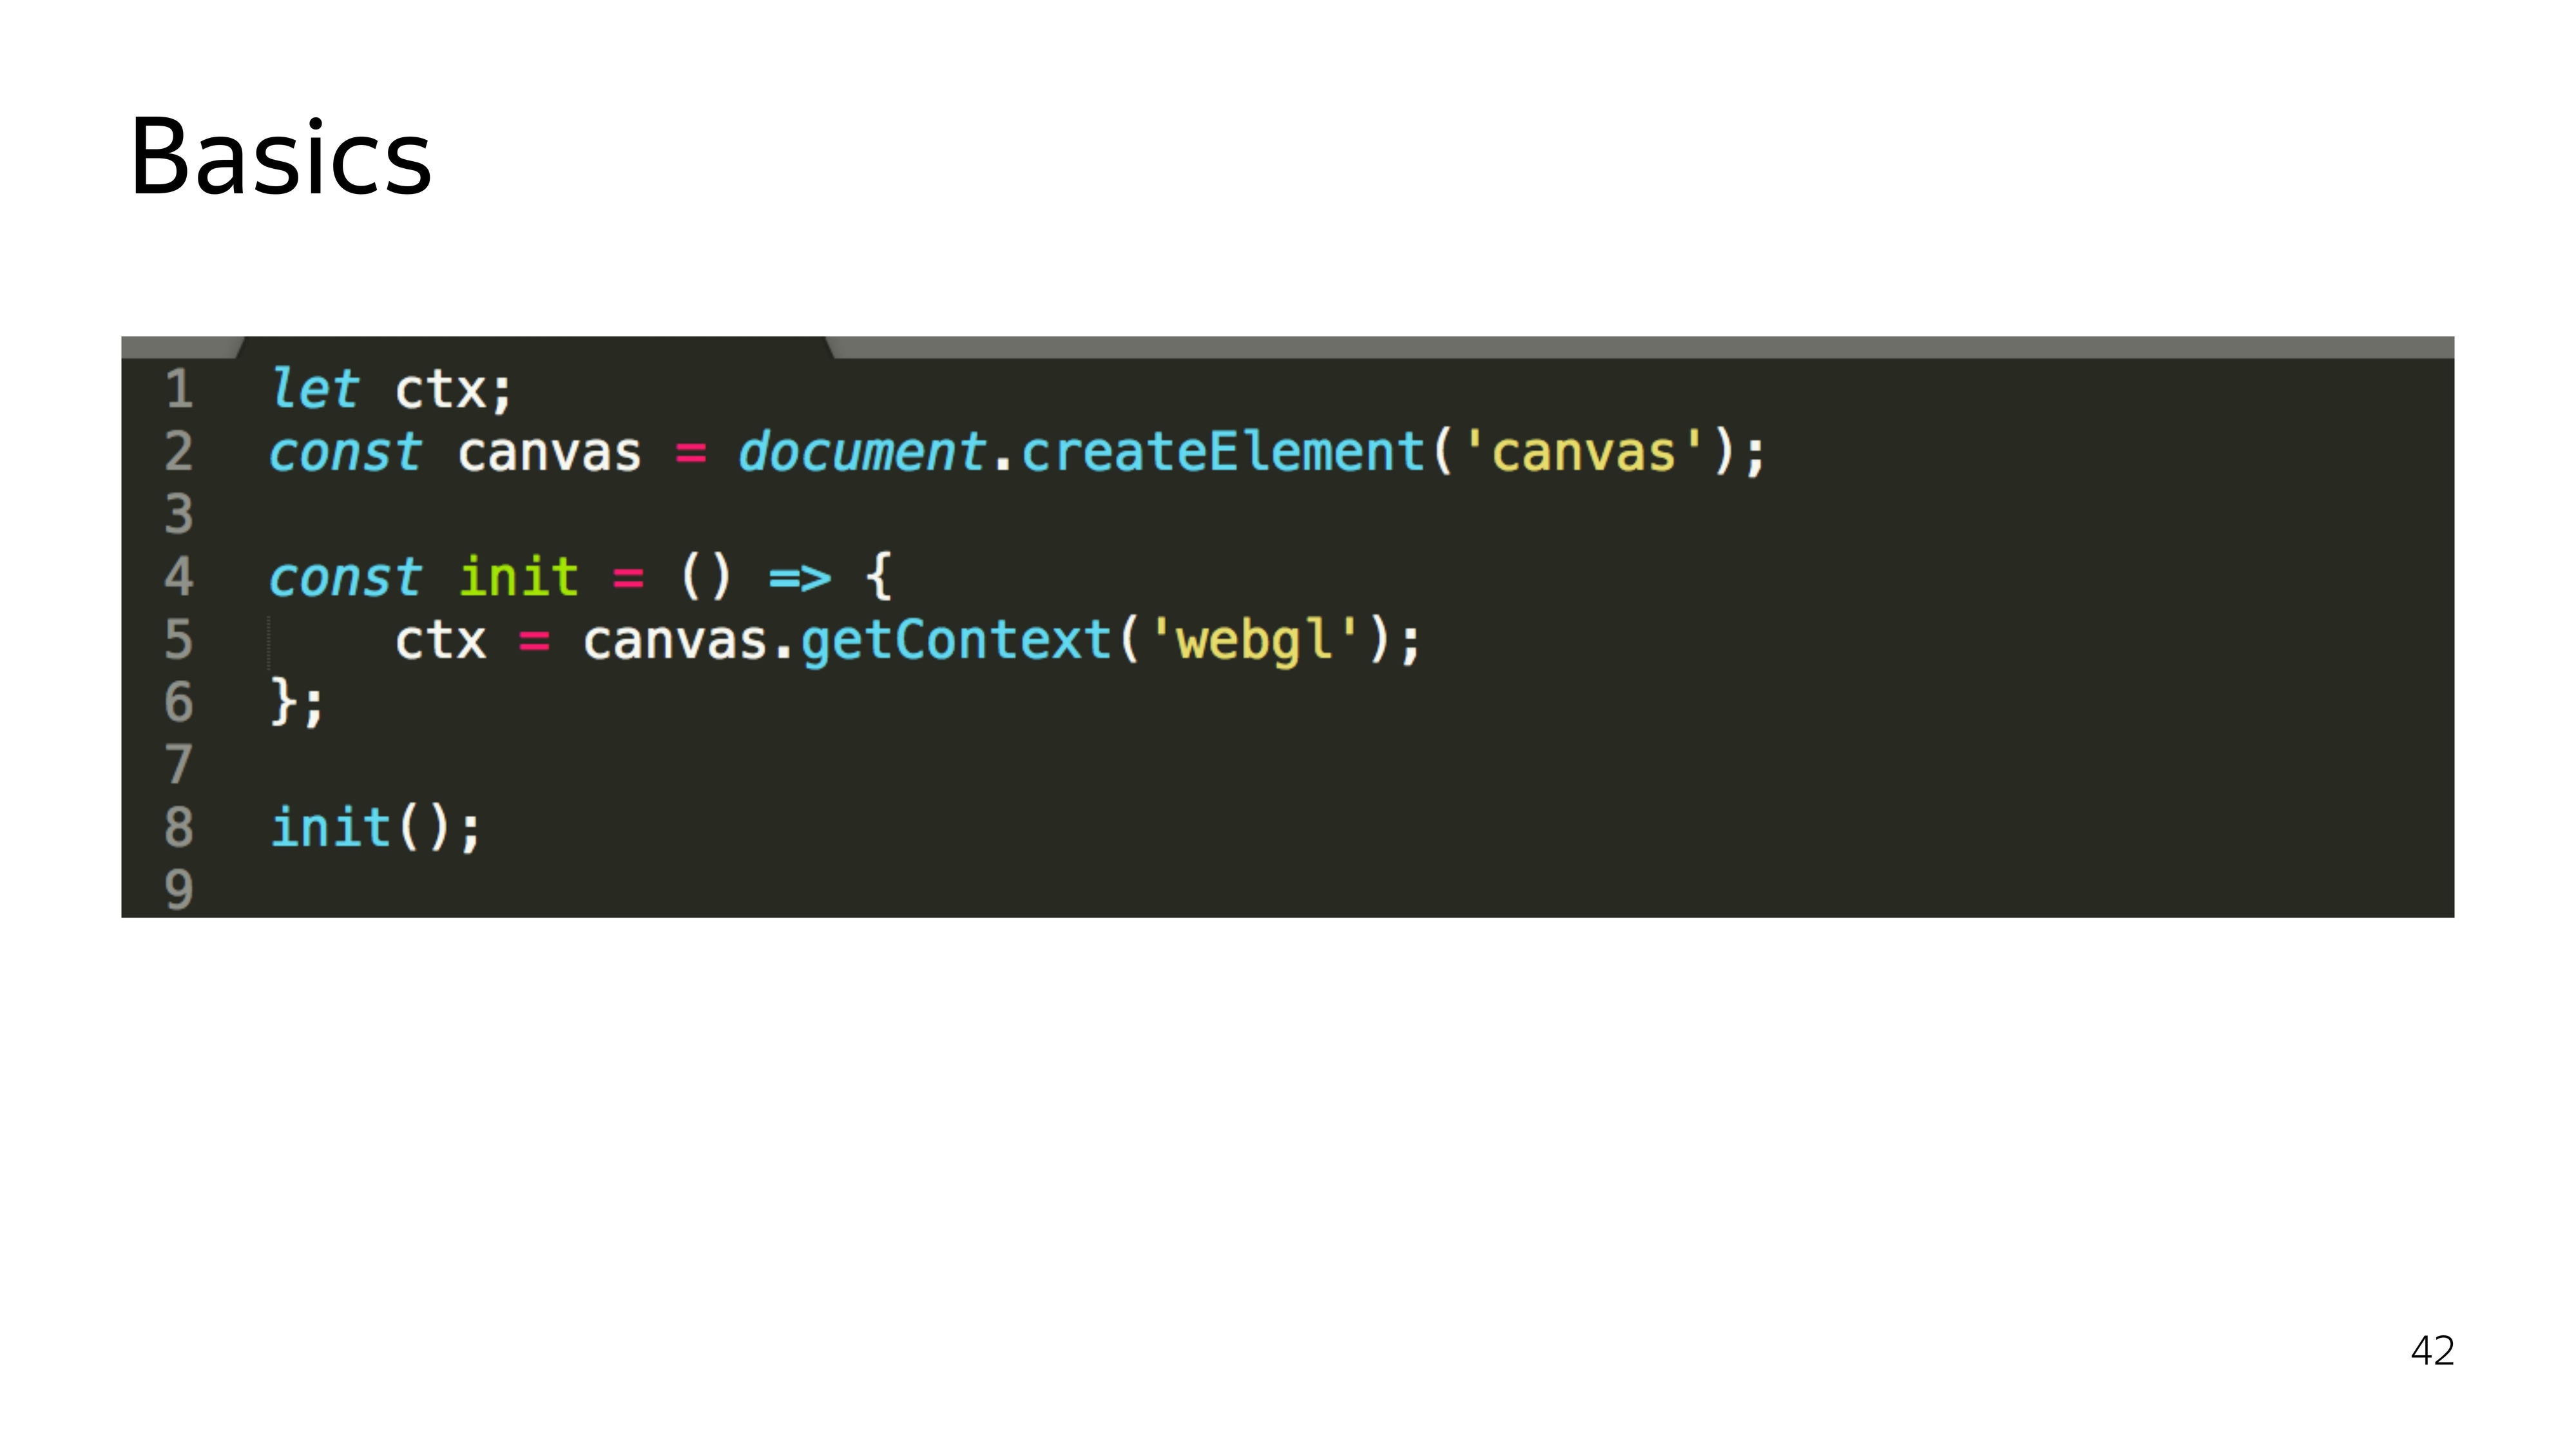
Let's start with JS. WebGL is just the appropriate context for the canvas element. Moreover, upon receiving this context, it is not just a specific object that is allocated, iron resources are allocated. And if we run something beautiful on WebGL in the browser, and then decide to play Quake, then it is quite possible that these resources will be lost, and the context may be lost, and your entire program will break.
Therefore, when working with WebGL, you also need to listen to the loss of context and be able to restore it. Therefore, I stressed that init is.
Then all the work of JS is to assemble programs that run on the GPU, send them a graphic card, set some parameters and say “draw”.
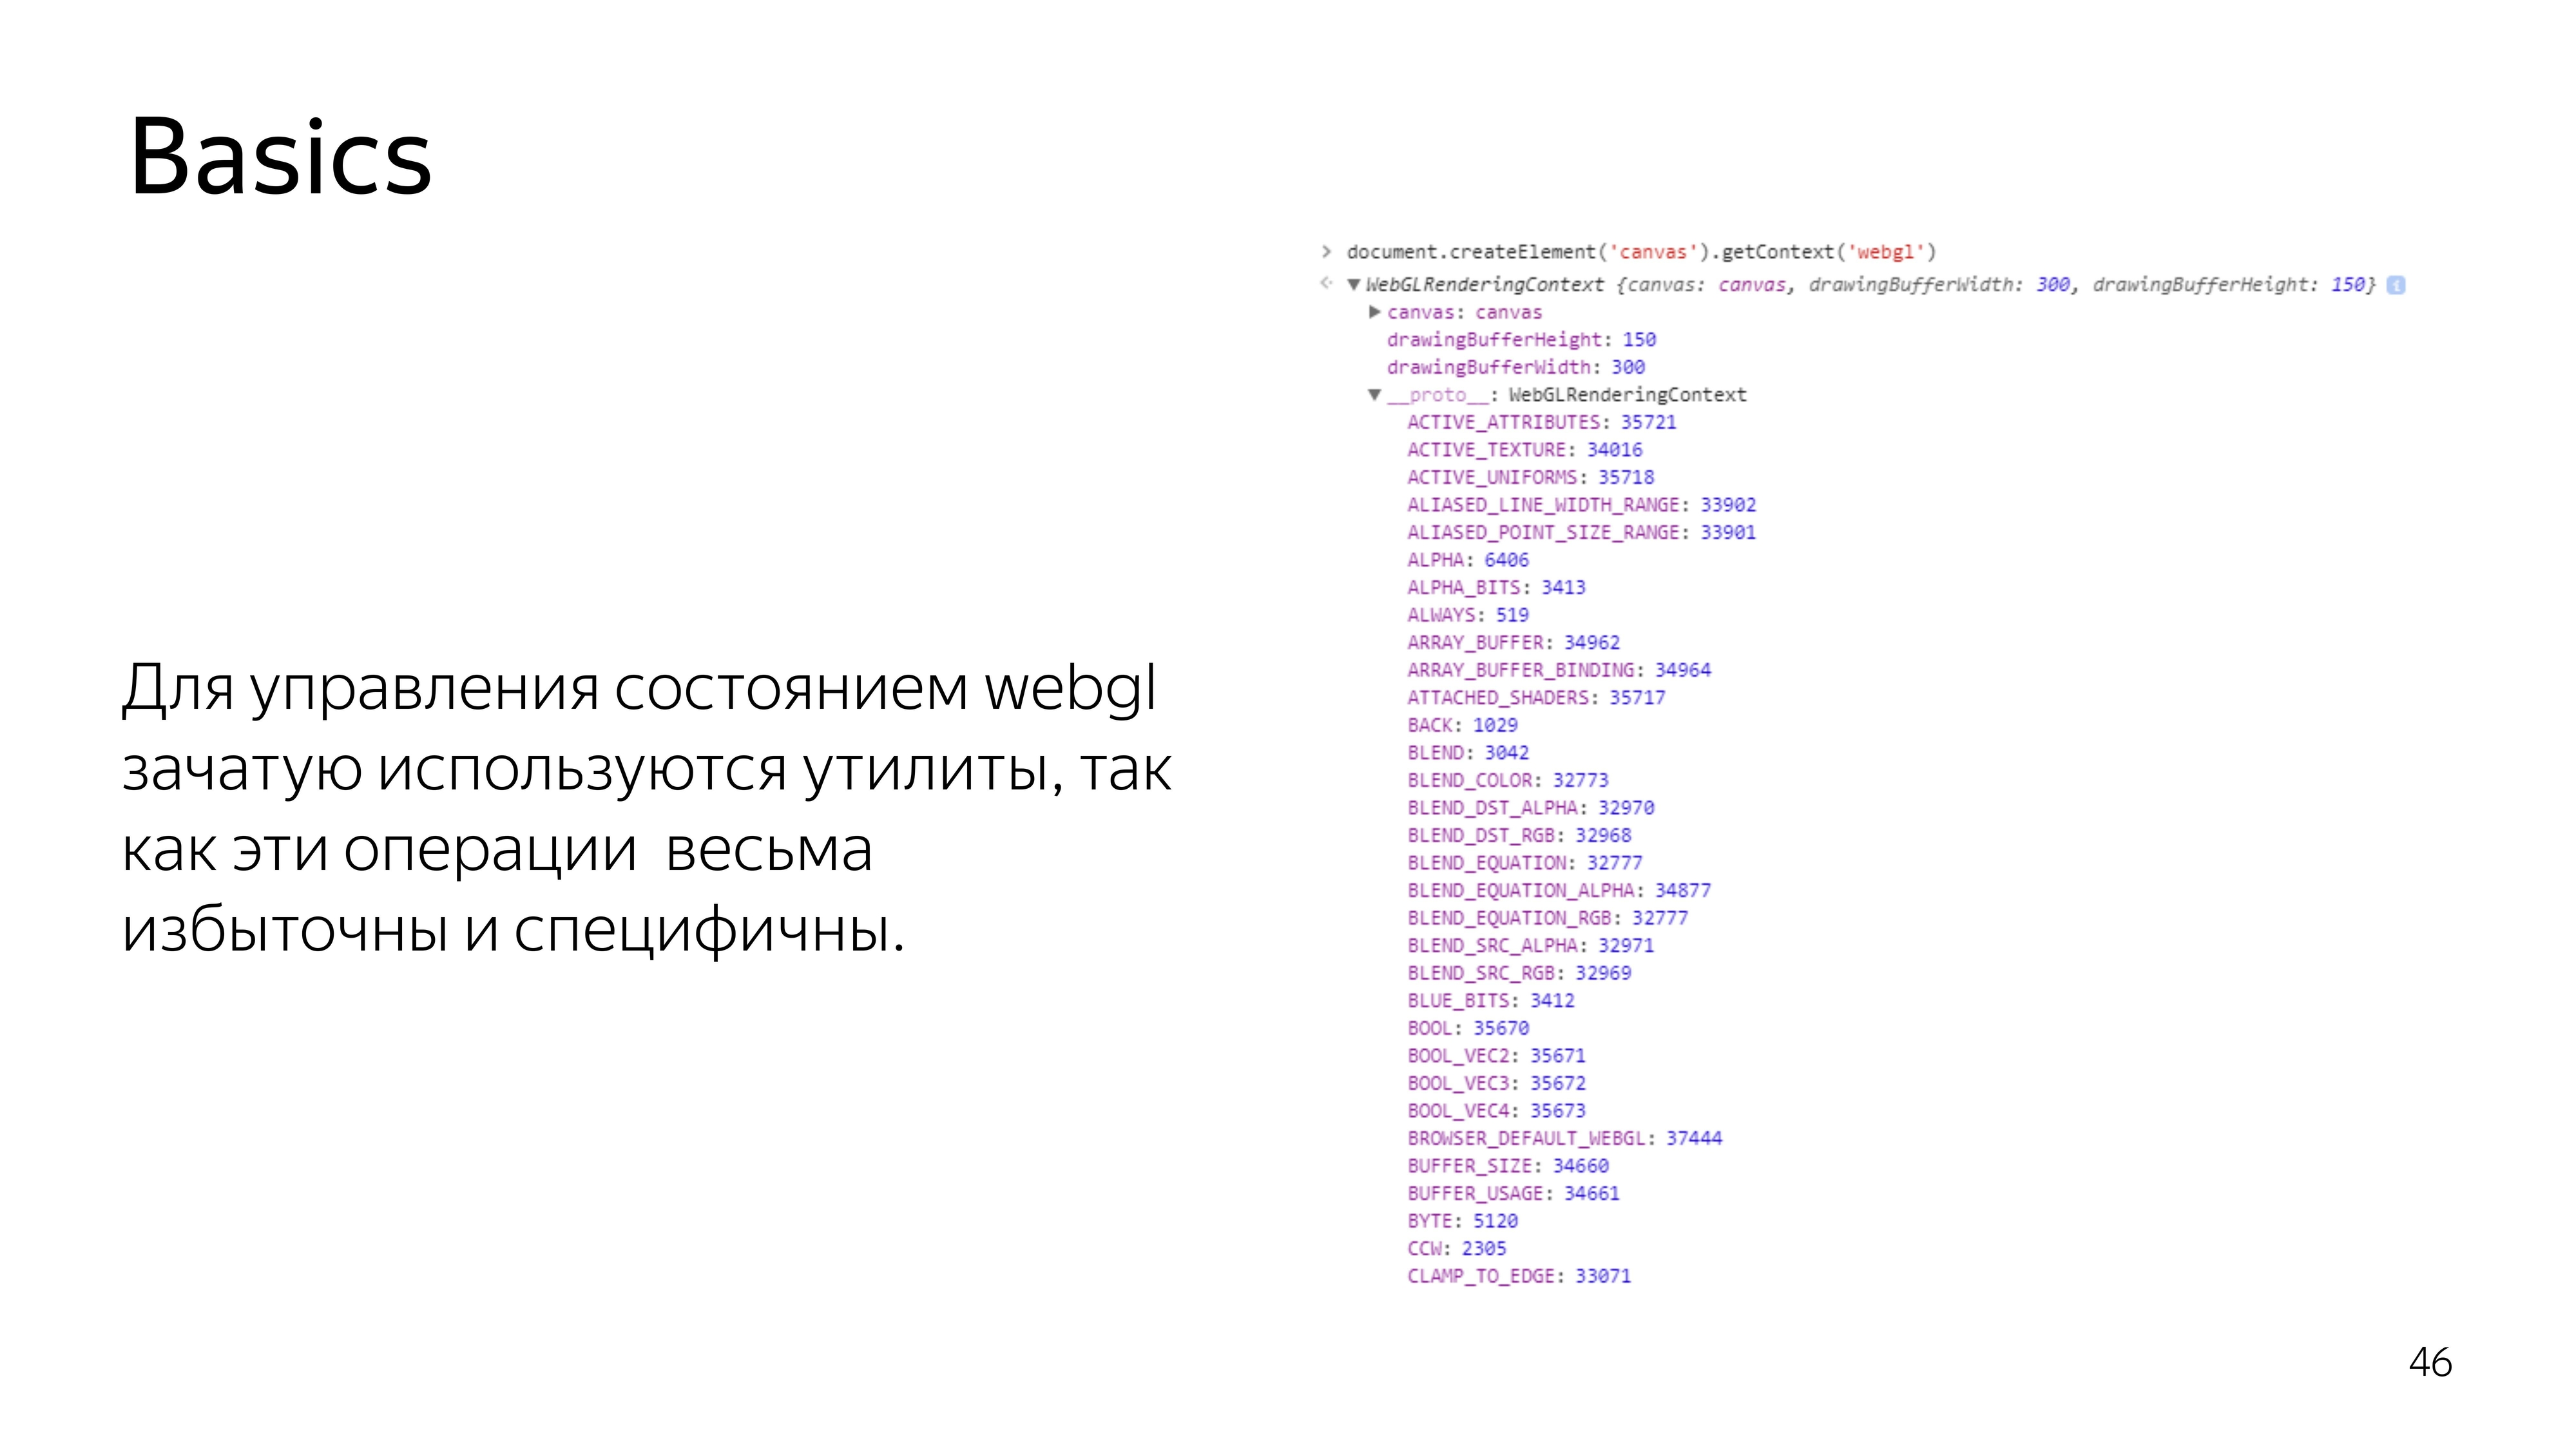
In WebGL, if you look at the context element itself, you see a bunch of constants. These constants mean references to addresses in memory. They are not really constants in the process of the program. Because if the context is lost and restored again, another address pool can be allocated, and these constants will be different for the current context. Therefore, almost all operations in WebGL on the JS side are performed through utilities. Nobody wants to do the routine work of searching for addresses and other garbage.
We proceed to what is performed on the video card itself - a program consisting of two sets of instructions written in C-like language GLSL. These instructions are called the vertex shader and the fragment shader. A program is created from their pair.
What is the difference between these shaders? The vertex shader sets the surface on which something should be drawn. After the primitive is set, which needs to be painted over, a fragment shader is called that falls into this range.
In the code, it looks like this. In the shader there is a section for declaring variables that are set outside, from JS, their type and name are determined. And also the main section, which executes the code needed for this iteration.
The vertex shader is in most cases expected to set the gl_Position variable to some coordinate in four-dimensional space. This is x, y, z and the width of the space, which is not really necessary to know at the moment.
The fragment shader waits for the color of a particular pixel to be set.
In this example, our pixel color is selected from the attached texture.
To transfer it to JS, it is enough to wrap the source code of the shaders in variables.
Further, these variables are converted to shaders. This is a WebGL context, we create shaders from source codes, in parallel we create a program, we tie a pair of shaders on the program. We get a workable program.
Along the way, we check that the shader compilation was successful, that the program was successfully assembled. We say that you need to use this program, because there may be several programs for different drawing values.
We configure it, and we say to draw. It turns out some kind of picture.
Crawled deeper. In the vertex shader, all calculations are performed in a space from -1 to 1, regardless of how large your output point is. For example, the space from -1 to 1 can occupy the entire screen of 1920x1080. To draw a triangle in the center of the screen, you need to draw a surface that covers the coordinate 0, 0. The
fragment shader works in the space from 0 to 1, and the colors here are given by four components: R, G, B, Alpha.
On the example of CSS, you might encounter a similar color record if you use percentages.
To draw something, you need to say what data you need to draw. Specifically for a triangle, we define a typed array of three vertices, each consisting of three components, x, y, and sufficient.
For such a case, the vertex shader looks like getting the current pair of points, coordinates, as well as setting this coordinate on the screen. Here, as it is, without transformations, we put a full stop on the screen.
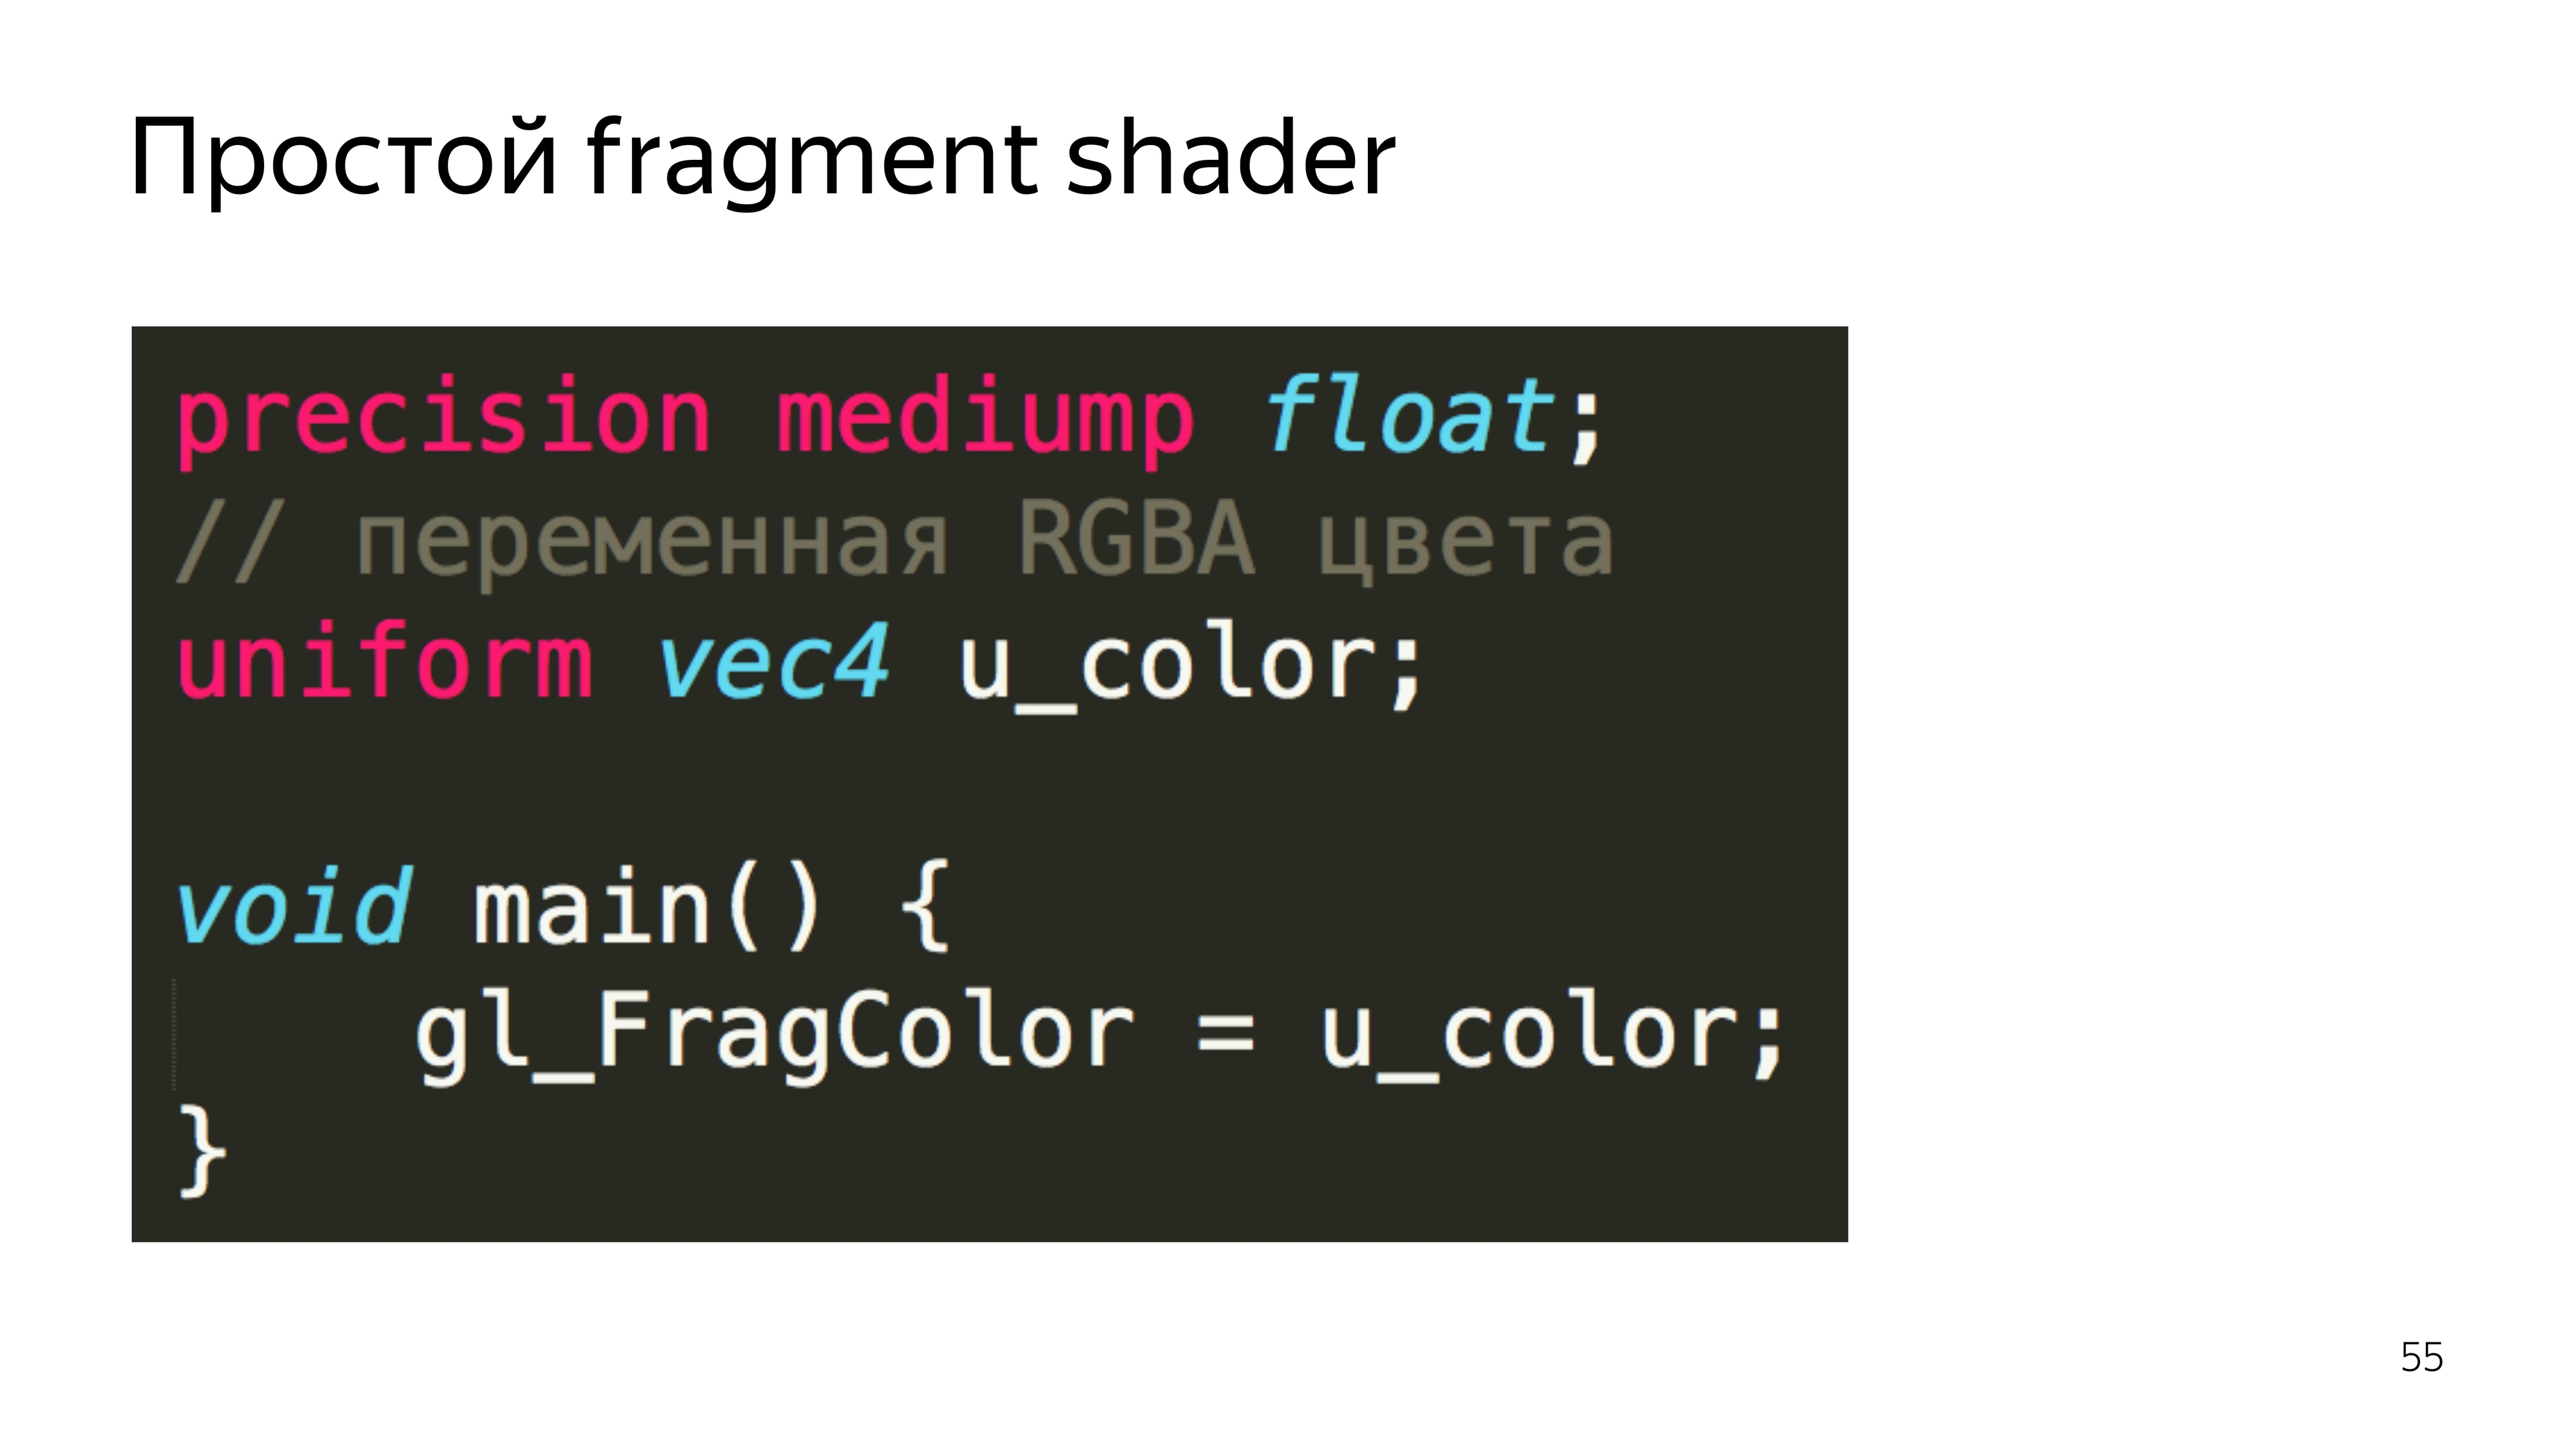
The fragment shader can color out the constants passed from JS, also without additional calculations. Moreover, if some variables in the fragment shader are transmitted from the outside or from the previous shader, then you need to specify the accuracy. In this case, the average accuracy is enough, and almost always it is enough.
Go to JS. We assign the same shaders to variables and declare the function that will create these shaders. That is, a shader is created, the source is poured into it, and then compiled.
Make two shaders, vertex and fragment.
After that, we create a program, upload already compiled shaders. We link the program, because shaders can exchange variables between each other. And at this stage, the correspondence of the types of variables that these shaders exchange is checked.
We say that use this program.
Next we create a list of vertices that we want to visualize. There is an interesting feature in WebGL for some variables. To change a specific data type, you need to set a global context for editing array_buffer, and then upload something to this address. There is no explicit assignment of any data to a variable. Here everything is done through the inclusion of some context.
You must also set the rules for reading from this buffer. It can be seen that we specified an array of six elements, but the program needs to be explained that each vertex consists of two components, the type of which is float, this is done in the last line.
To set the color, the program searches for the address for the variable u_color and sets the value for this variable. We set the color, red 255, 0.8 from green, 0 blue and completely opaque pixel - it turns yellow. And we say to execute this program using triangle primitives, in WebGL you can draw points, lines, triangles, triangles of complex shape, and so on. And make three peaks.
You can also specify that the array, on which we perform the drawing, should be considered from the very beginning.
Link from the slide
If you slightly complicate the example, you can add color dependence on the position of the cursor. At the same time fps rolls over.
To draw particles all over the world, you need to know the wind speed at every point of this world.
To increase and somehow move the map, you need to create containers that correspond to the current position of the map.
To move the particles themselves, you need to come up with a data format that could be updated using a graphics processor. Make drawing and loop drawing itself.
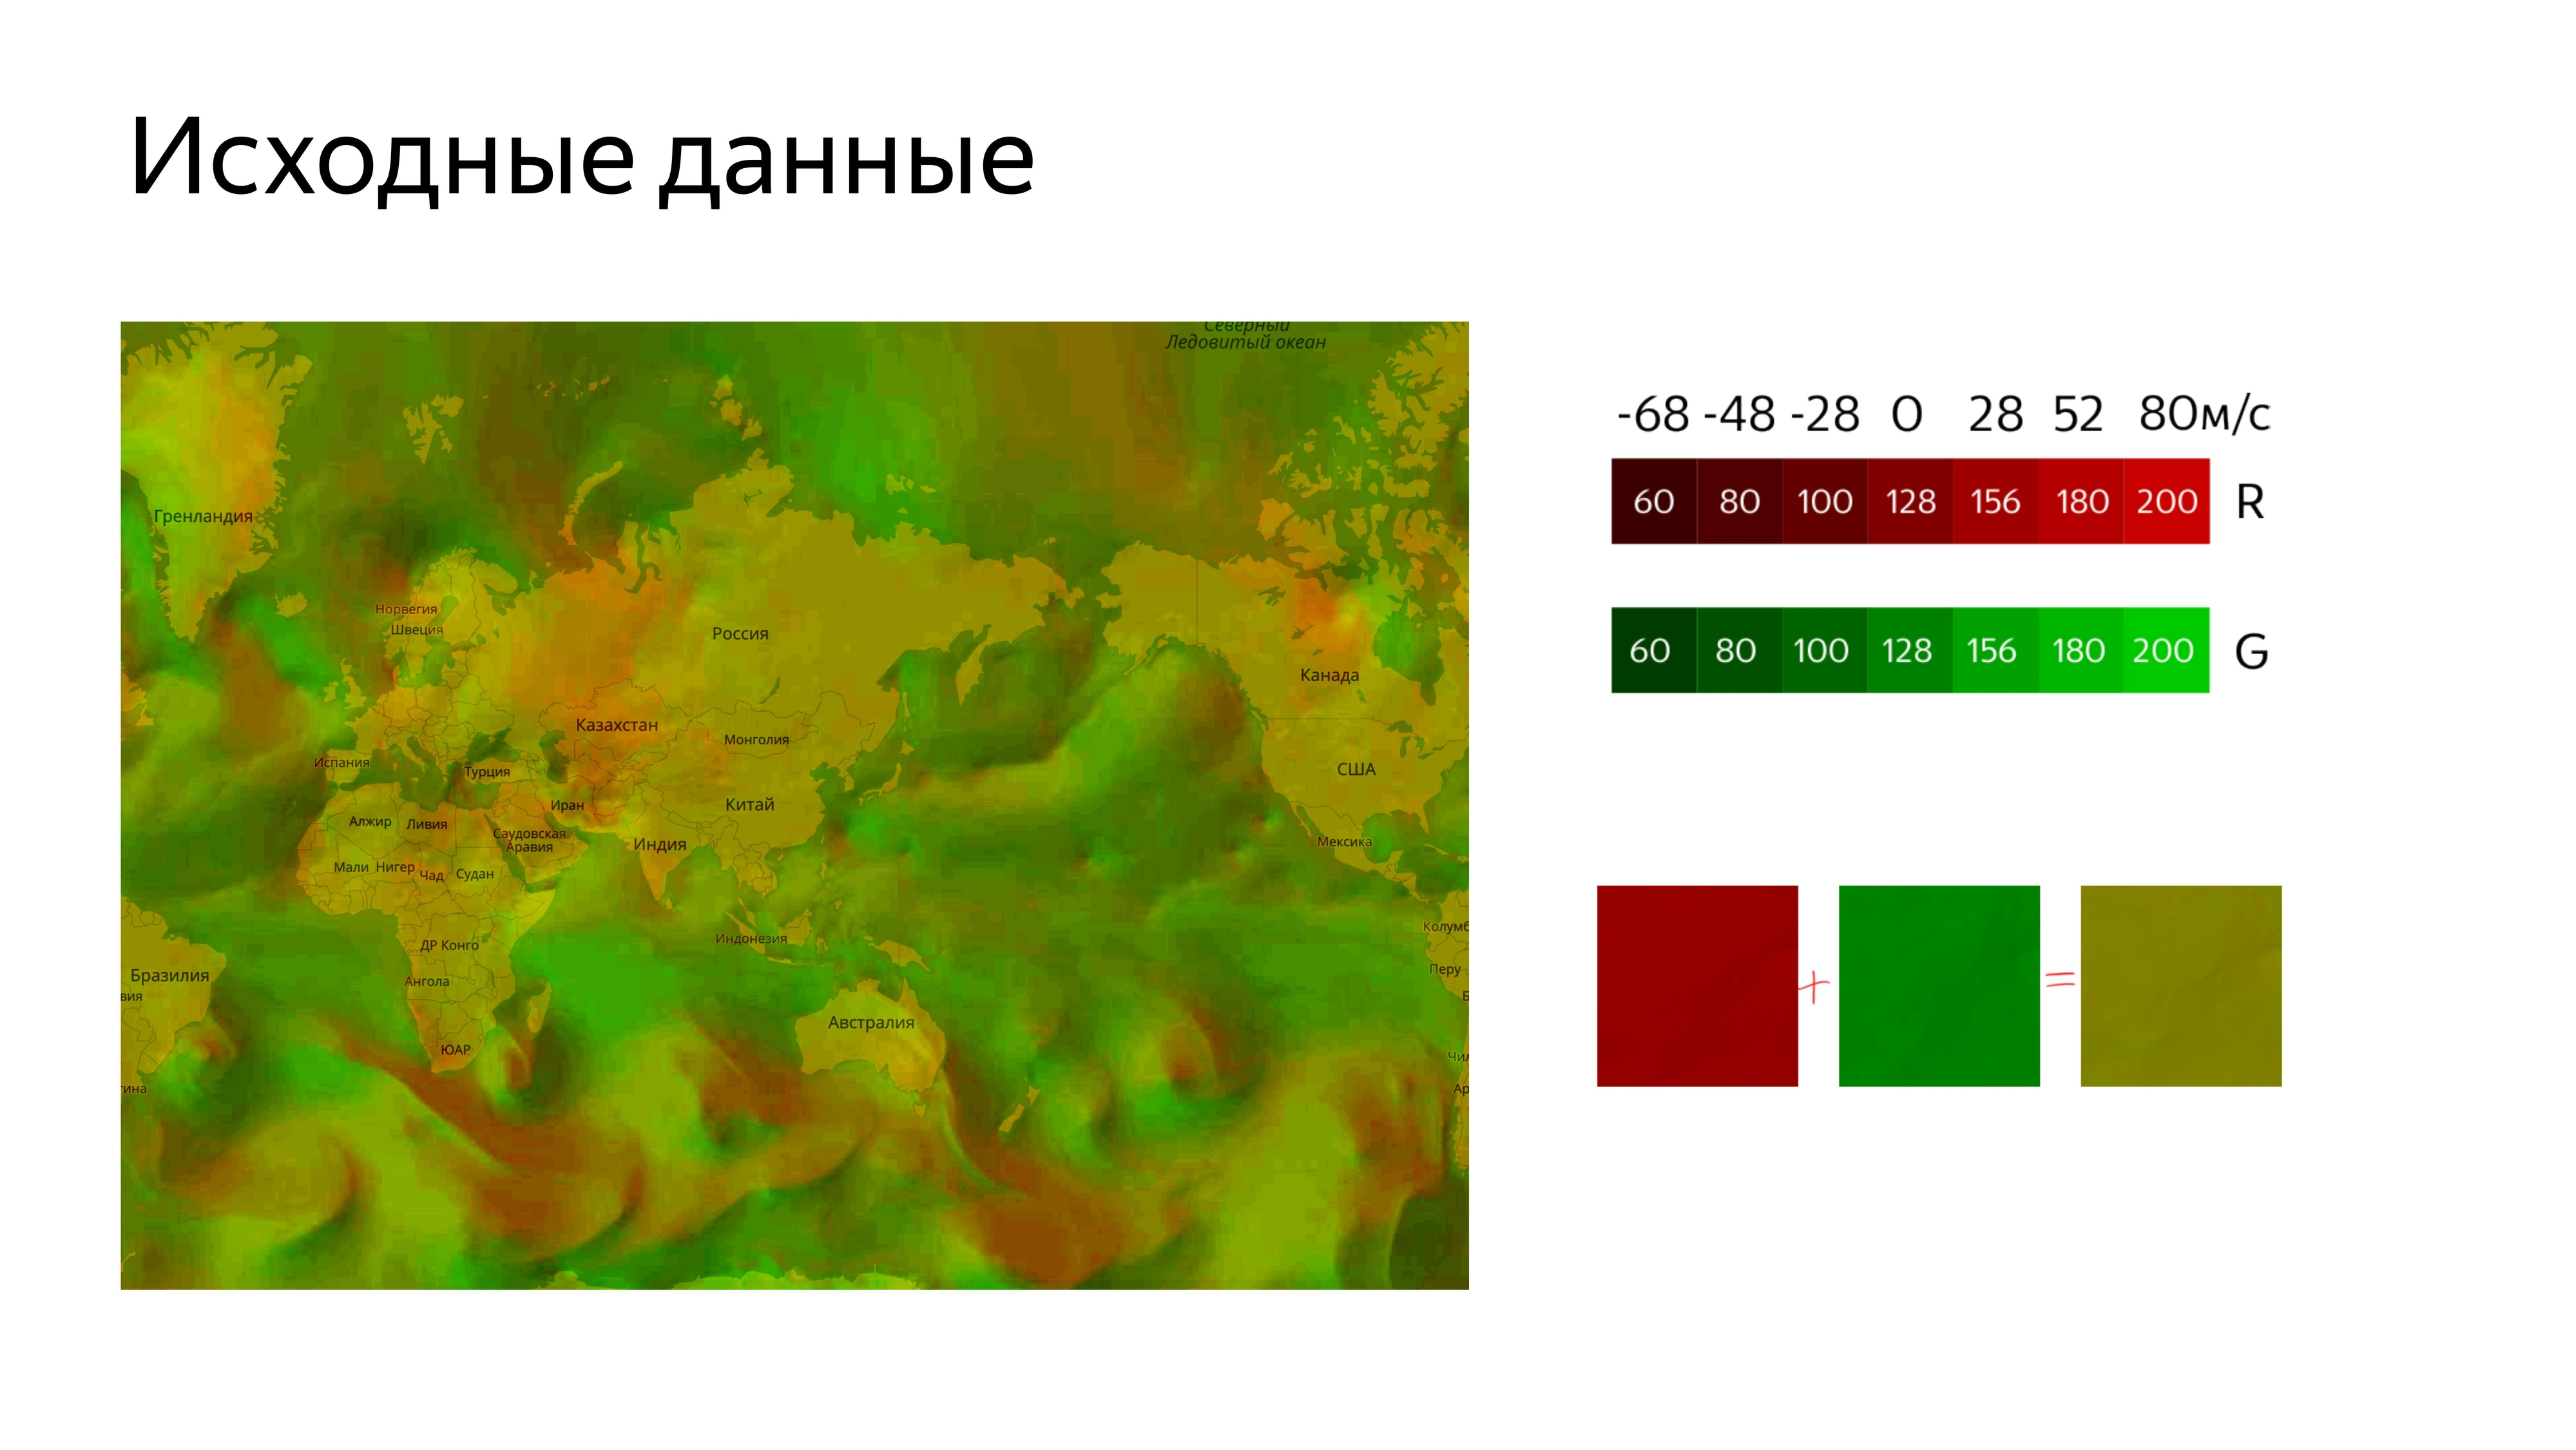
All the data we do through teksturku. We use 22 channels to determine horizontal and vertical speeds, where zero wind speed corresponds to the middle of the color range. This is about 128. Since the speed can be negative and positive, we set the color relative to the middle of the range.
It turns out this picture.
To load it on the map, we need to cut it. To connect the image to the map, we use the standard Yandex.Map Layer tool, in which we determine the address from which to get the cut tiles, and add this layer to the map.
Link from the slide
We get a picture where the unpleasant green color is the coded wind speed.
Next you need to get a place in which we will draw the animation itself, while this place must correspond to the coordinates of the map, its movements and other actions.
By default, we can assume that we would use the Layer, but the card Layer creates a canvas, from which it immediately captures the 2D context, which it turns out to capture. But if we try to take from the canvas, which already has a context of another type, and take the GL context from it, we will end up with null. If you turn to it, the program crashes.
Link from the slide
Therefore, we used Pane, these are containers for layers, and added our canvas there, from which we have already taken the context we need.
In order to somehow place the particles on the screen and be able to move them, the format of the position of the particles in the texture was used.
How it works? It creates a square texture for optimization, and here the size of its side is known.
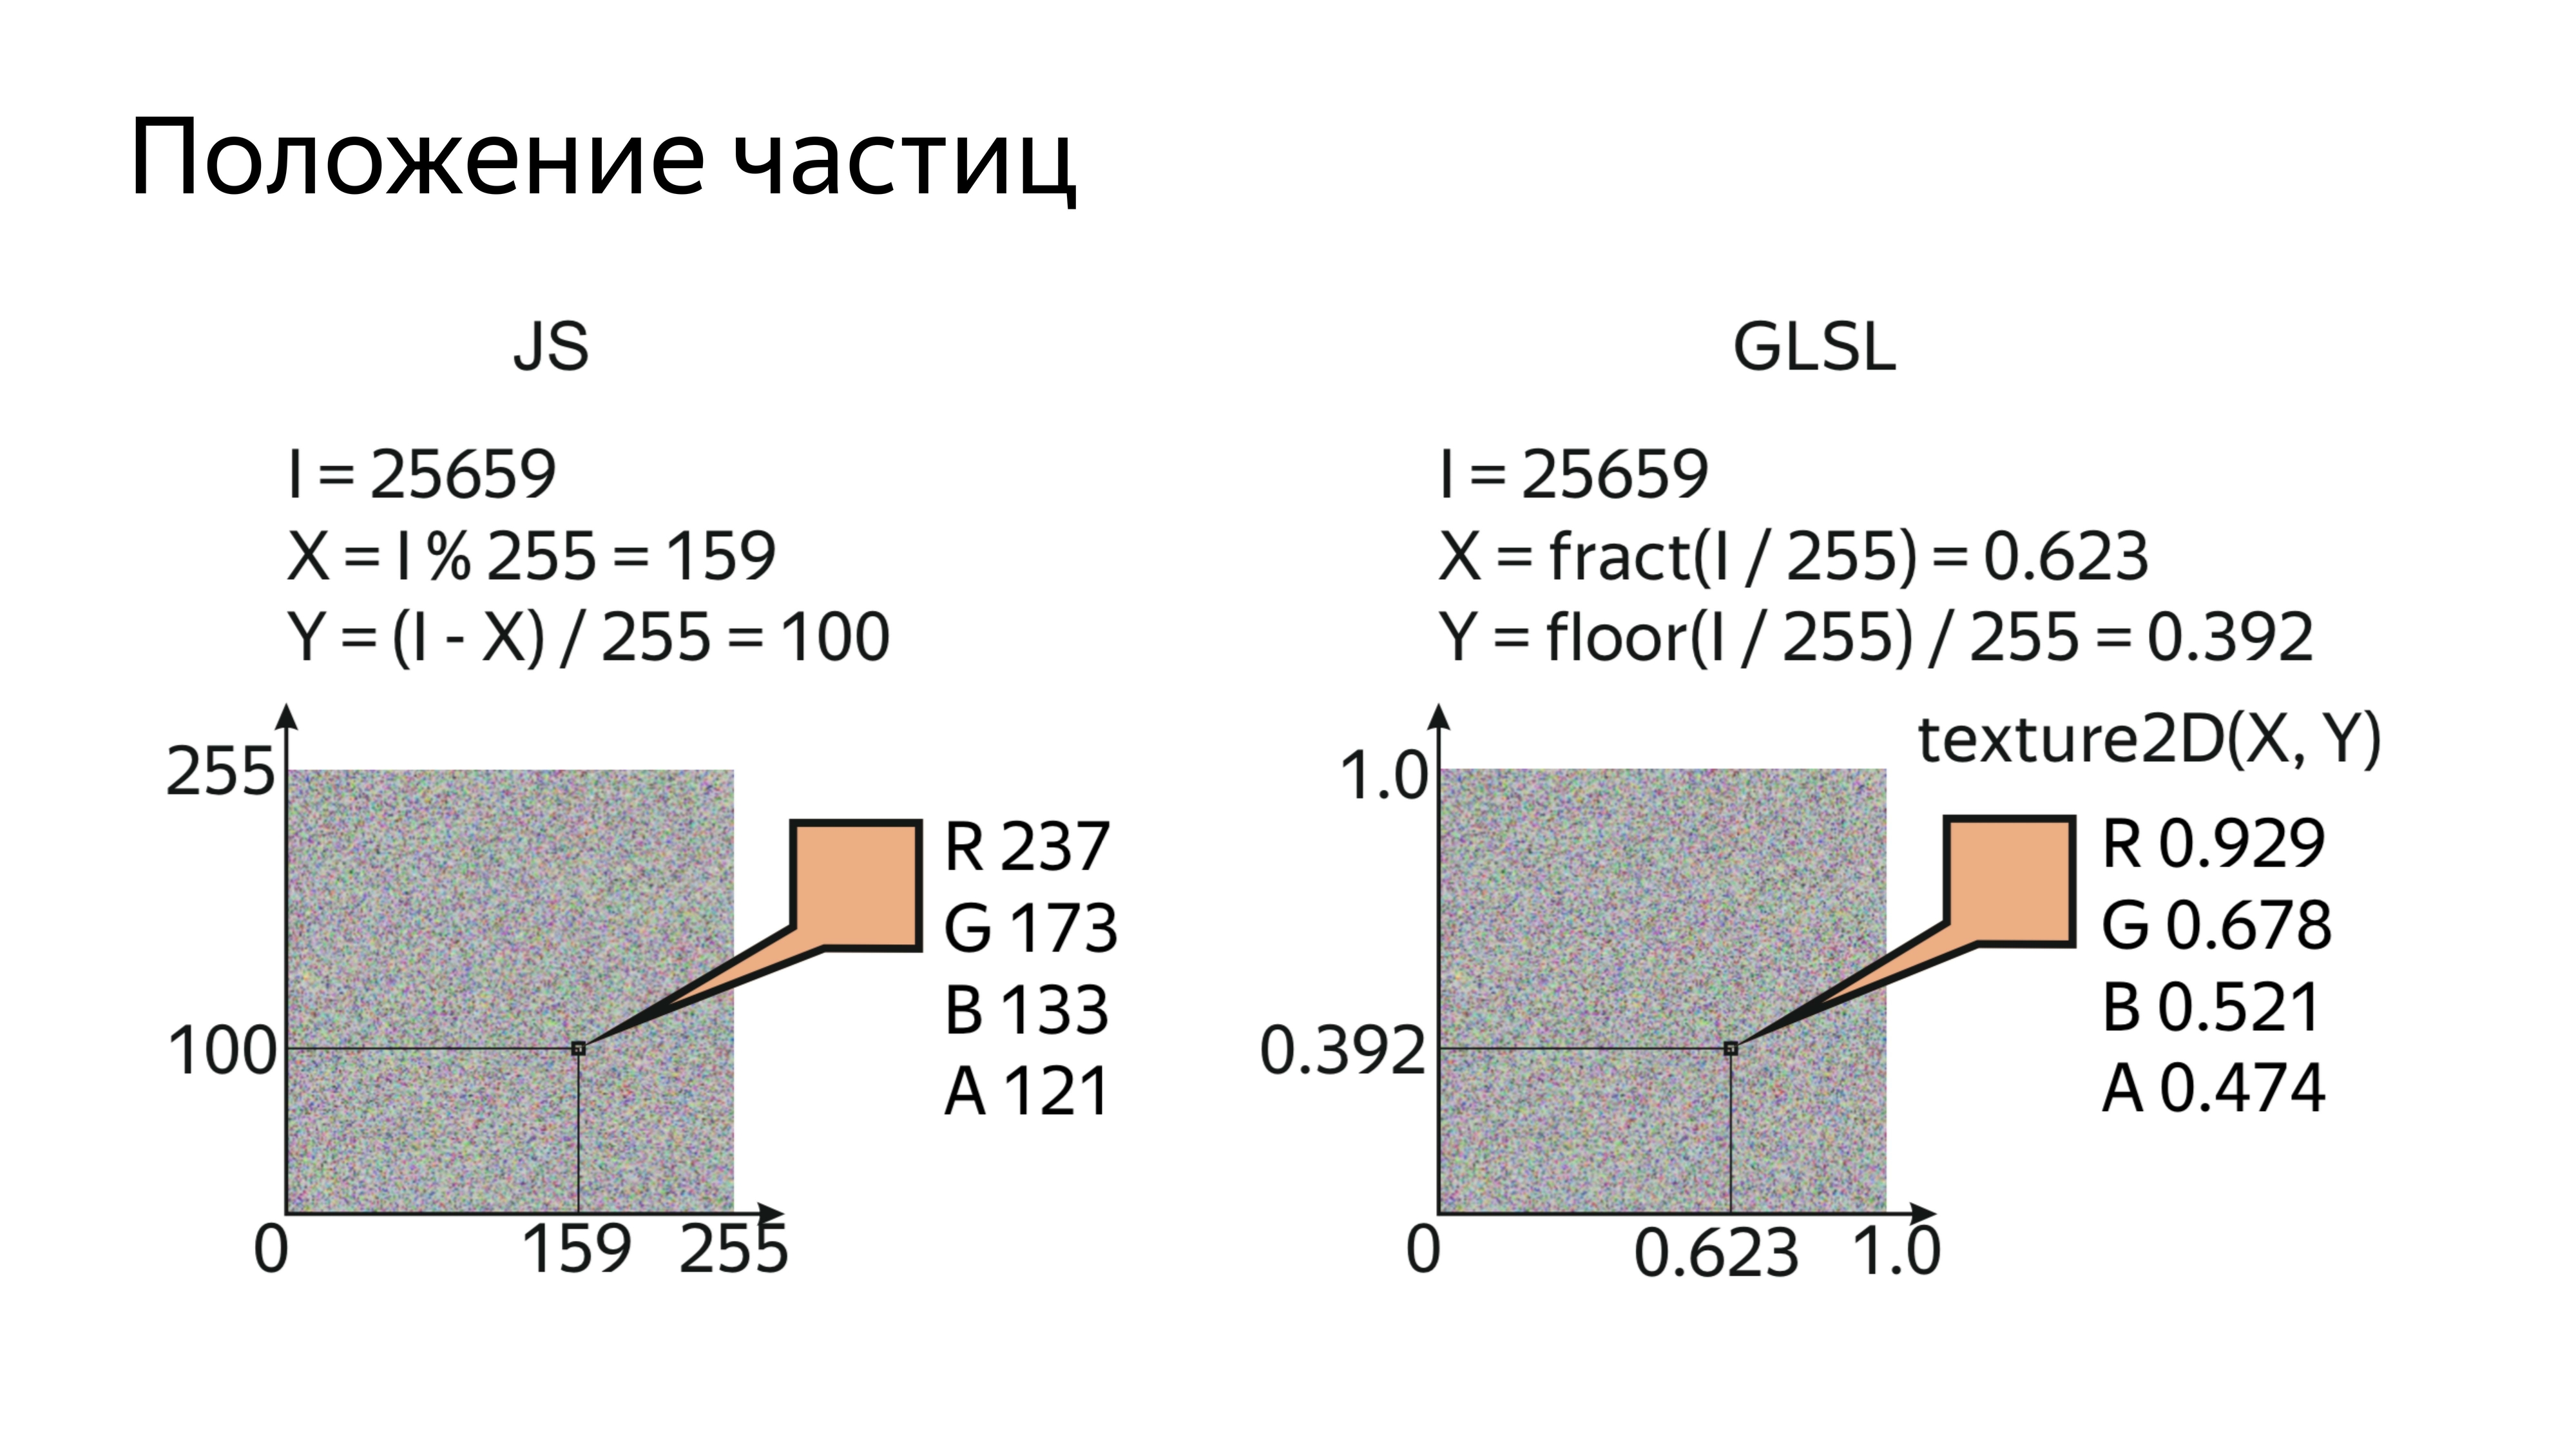
By drawing the particles in order and knowing the sequence number of the particles and the size of the texture in which they are stored, you can calculate the specific pixel in which the position is encoded on the real screen.
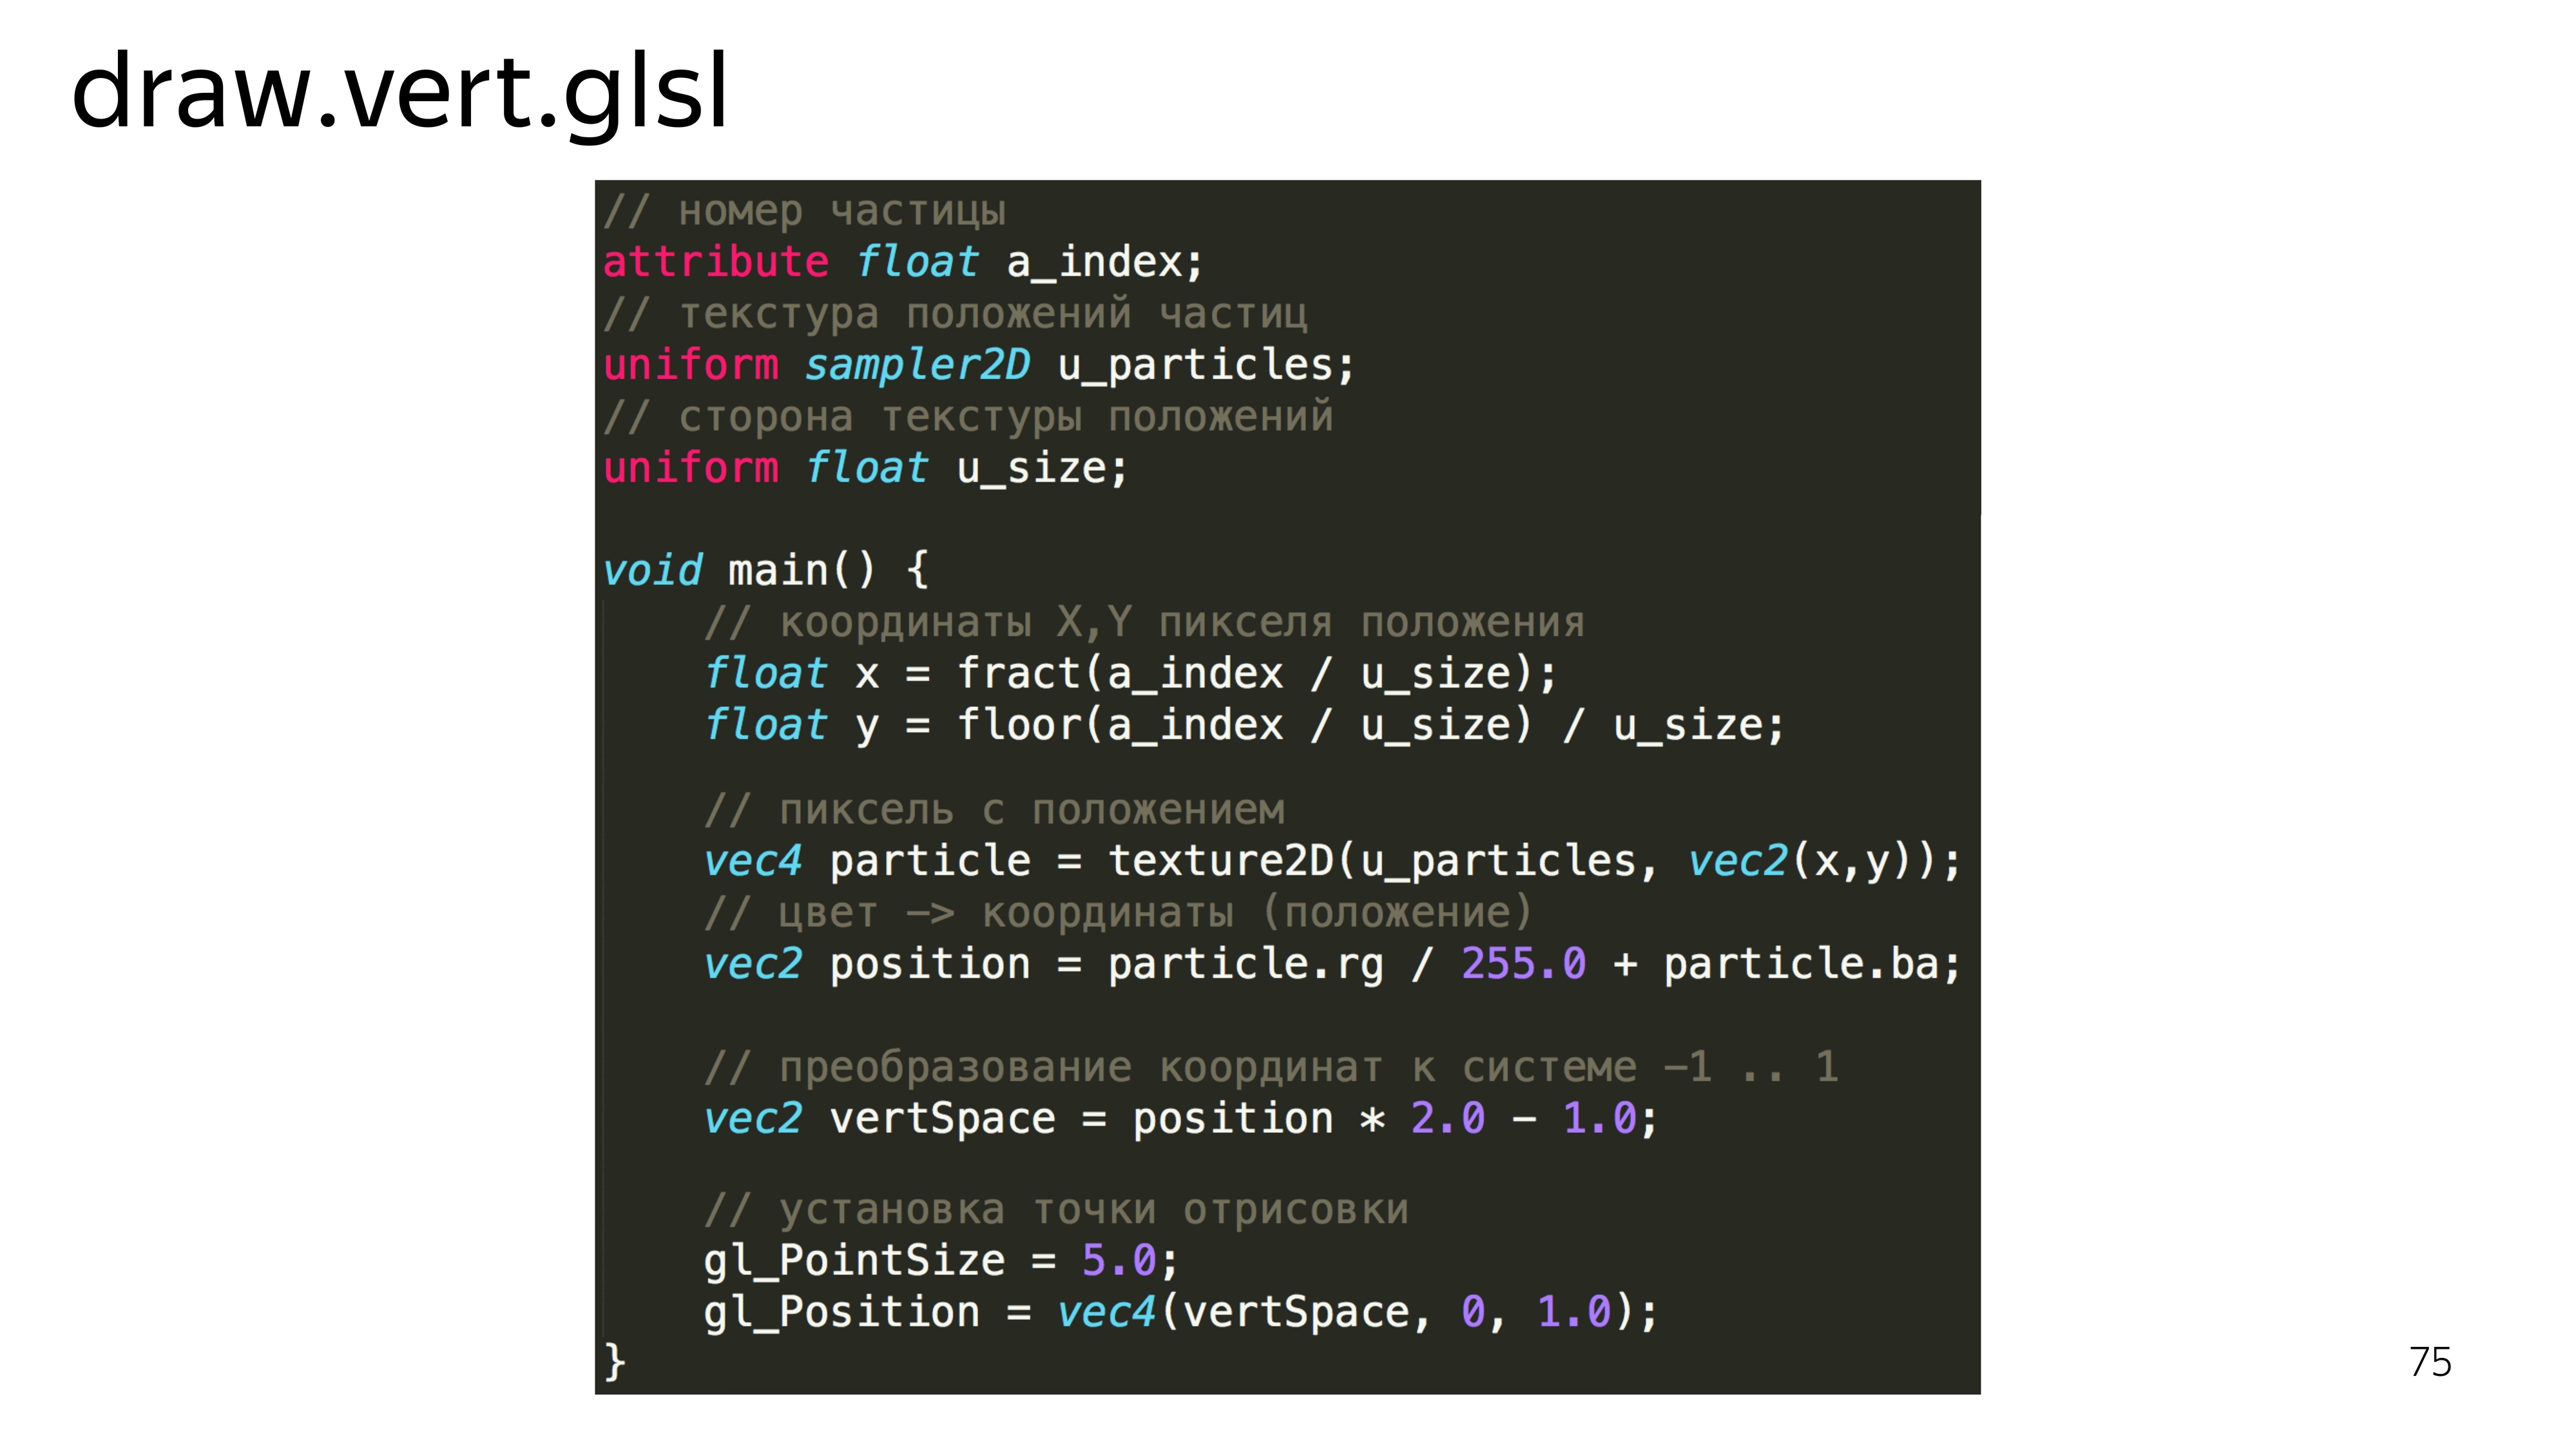
In the shader itself, it looks like reading a rendered index, a texture with the current position of the particles and the size of the side. Next, we determine the x, y coordinates for this particle, read this value, and decode it. What is this magic: rg / 255 + ba?
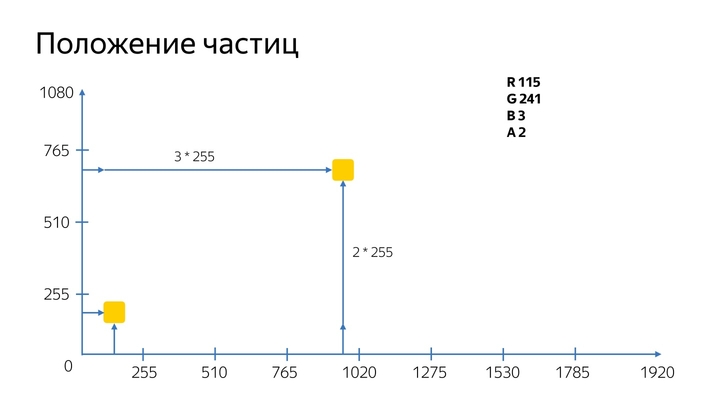
For the position of the particles we use 20 double channels. The color channel has a value from 0 to 255, and for a 1080 screen for some we cannot put particles at any position on the screen, because we can put a maximum of a particle at 255 pixels. Therefore, in one channel we store the knowledge of how many times a particle has passed 255 pixels, and in the second channel we store the exact value of how much it has passed after.
Next, the vertex shader must convert these values to its work space, that is, from -1 to 1, and set this point on the display.
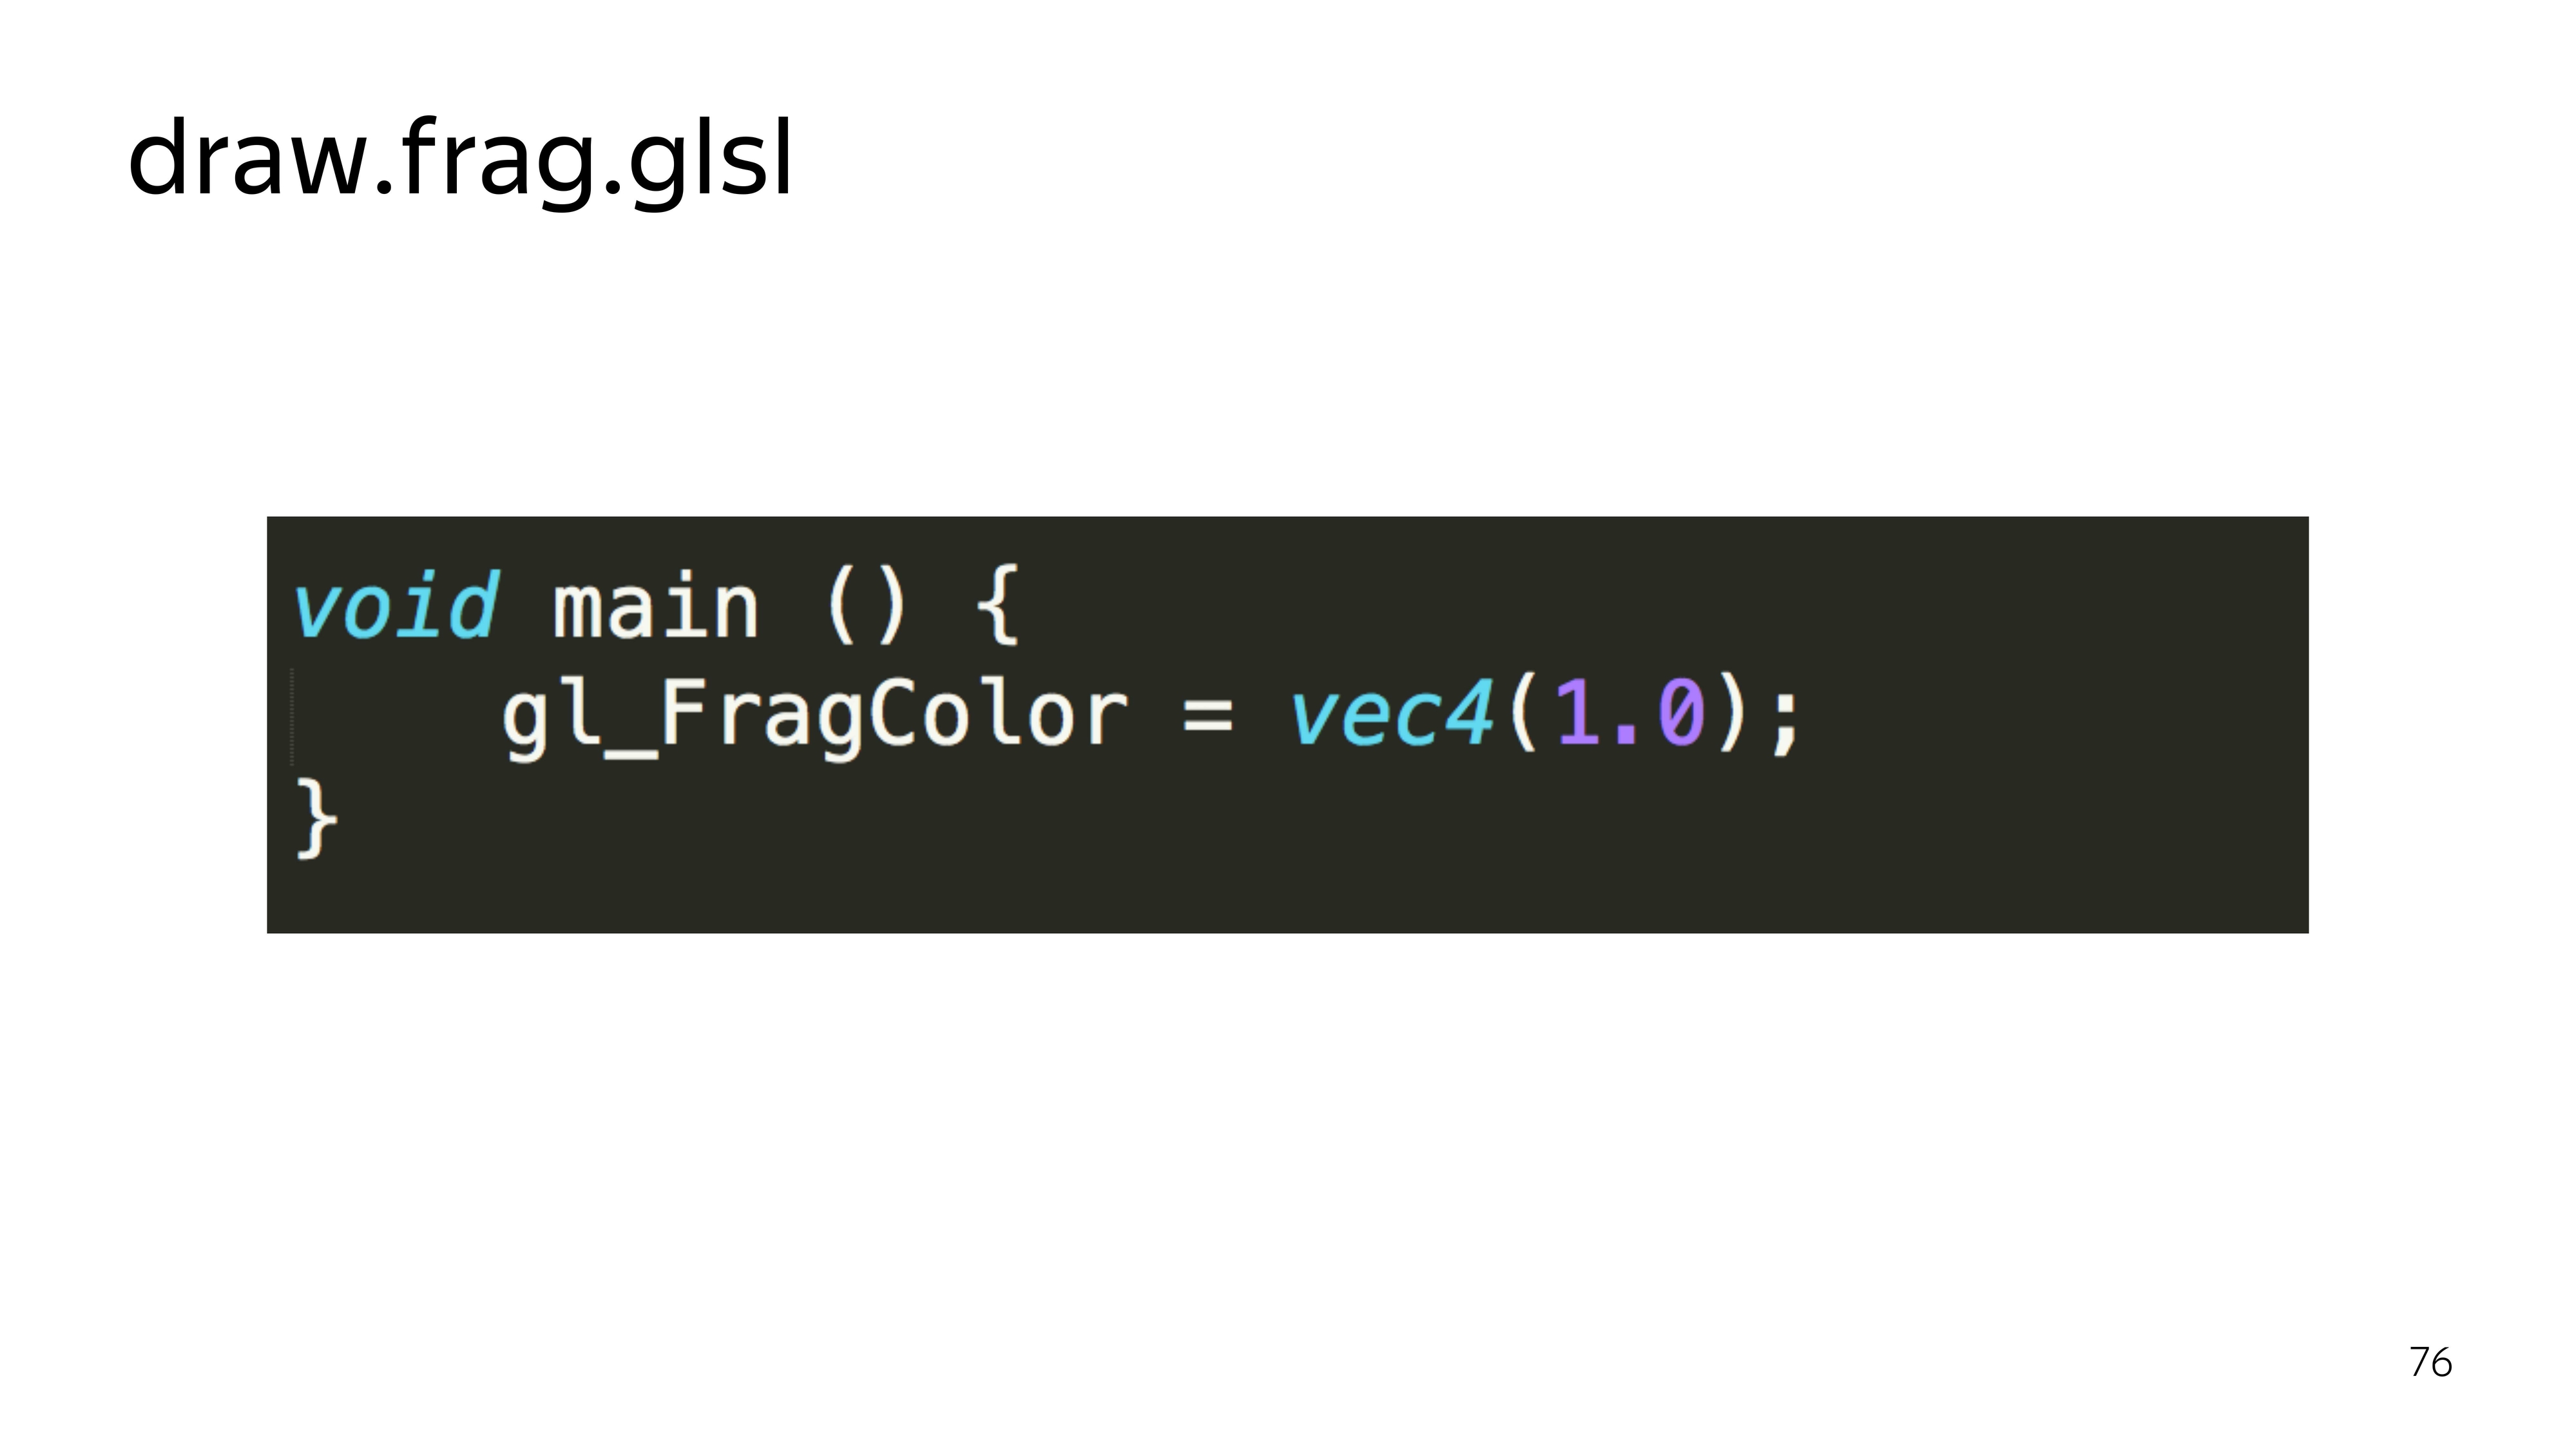
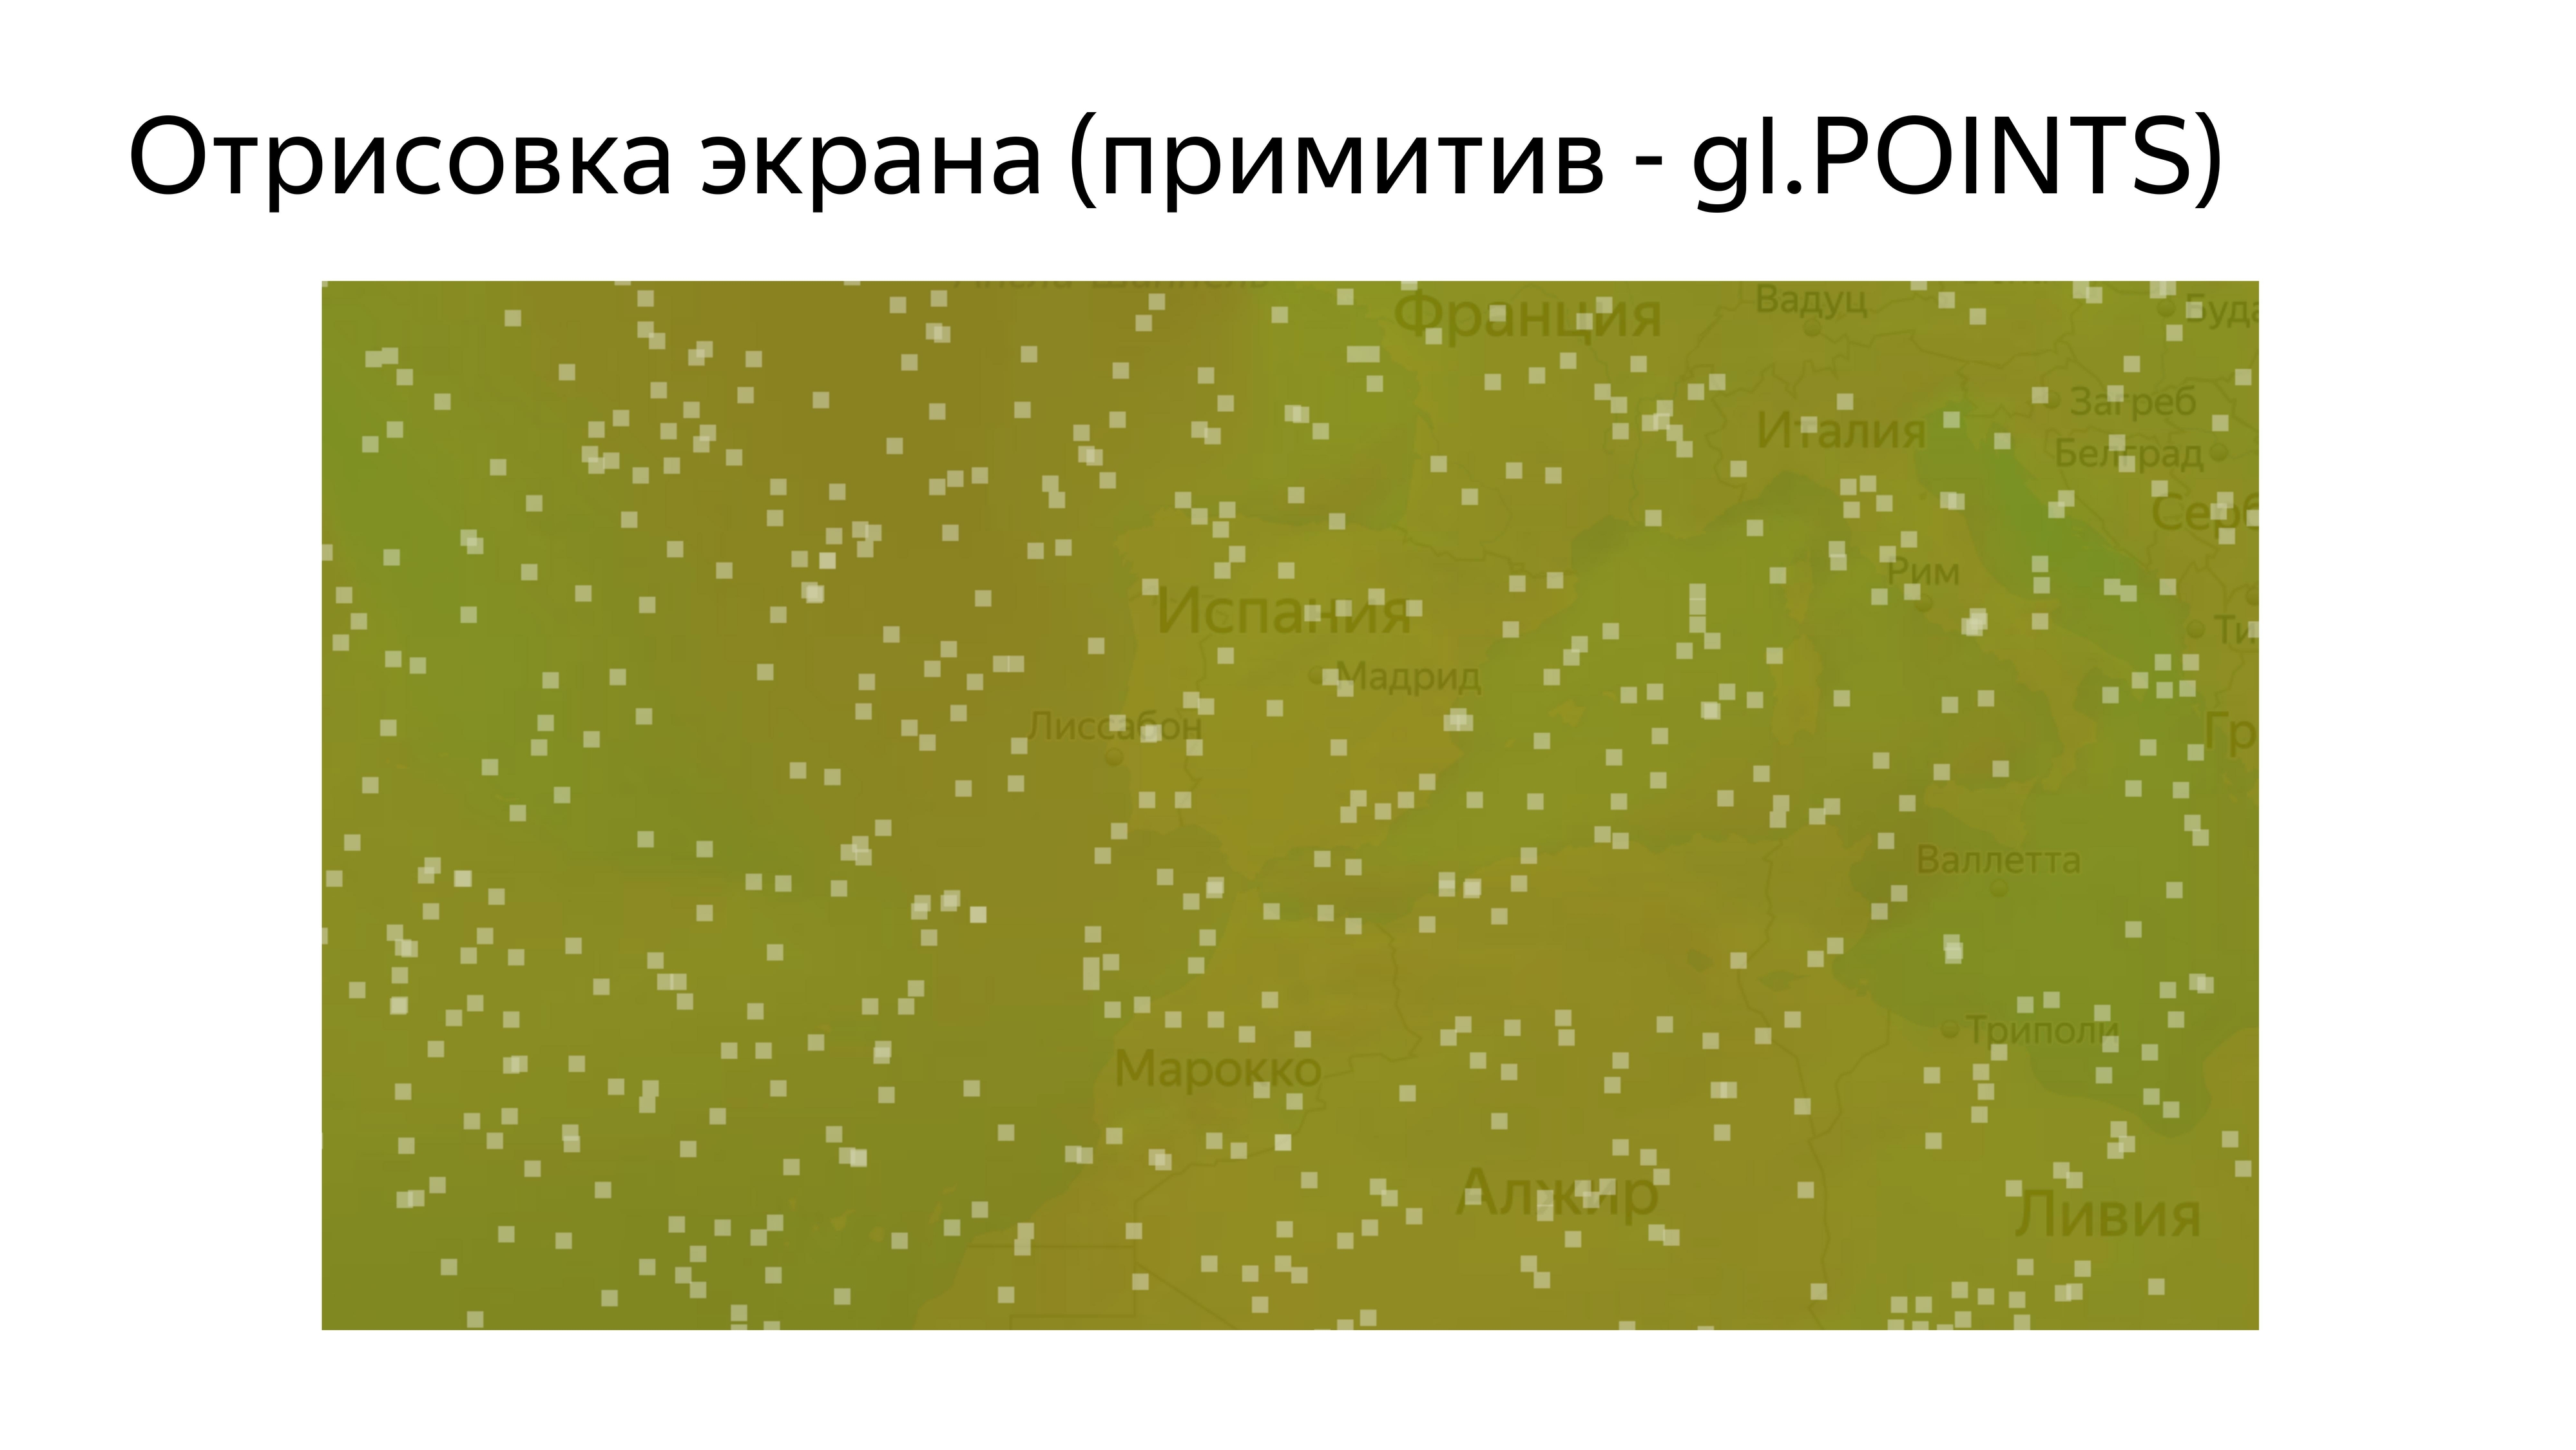
To just look at our particles, it is enough to paint them in white. There is such a sugar in GLSL that if we define the type of a variable and pass it into a constant, then this constant will be distributed over all four components, for example.
Having drawn such a program, we see a set of identical squares. Let's try to add them beauty.
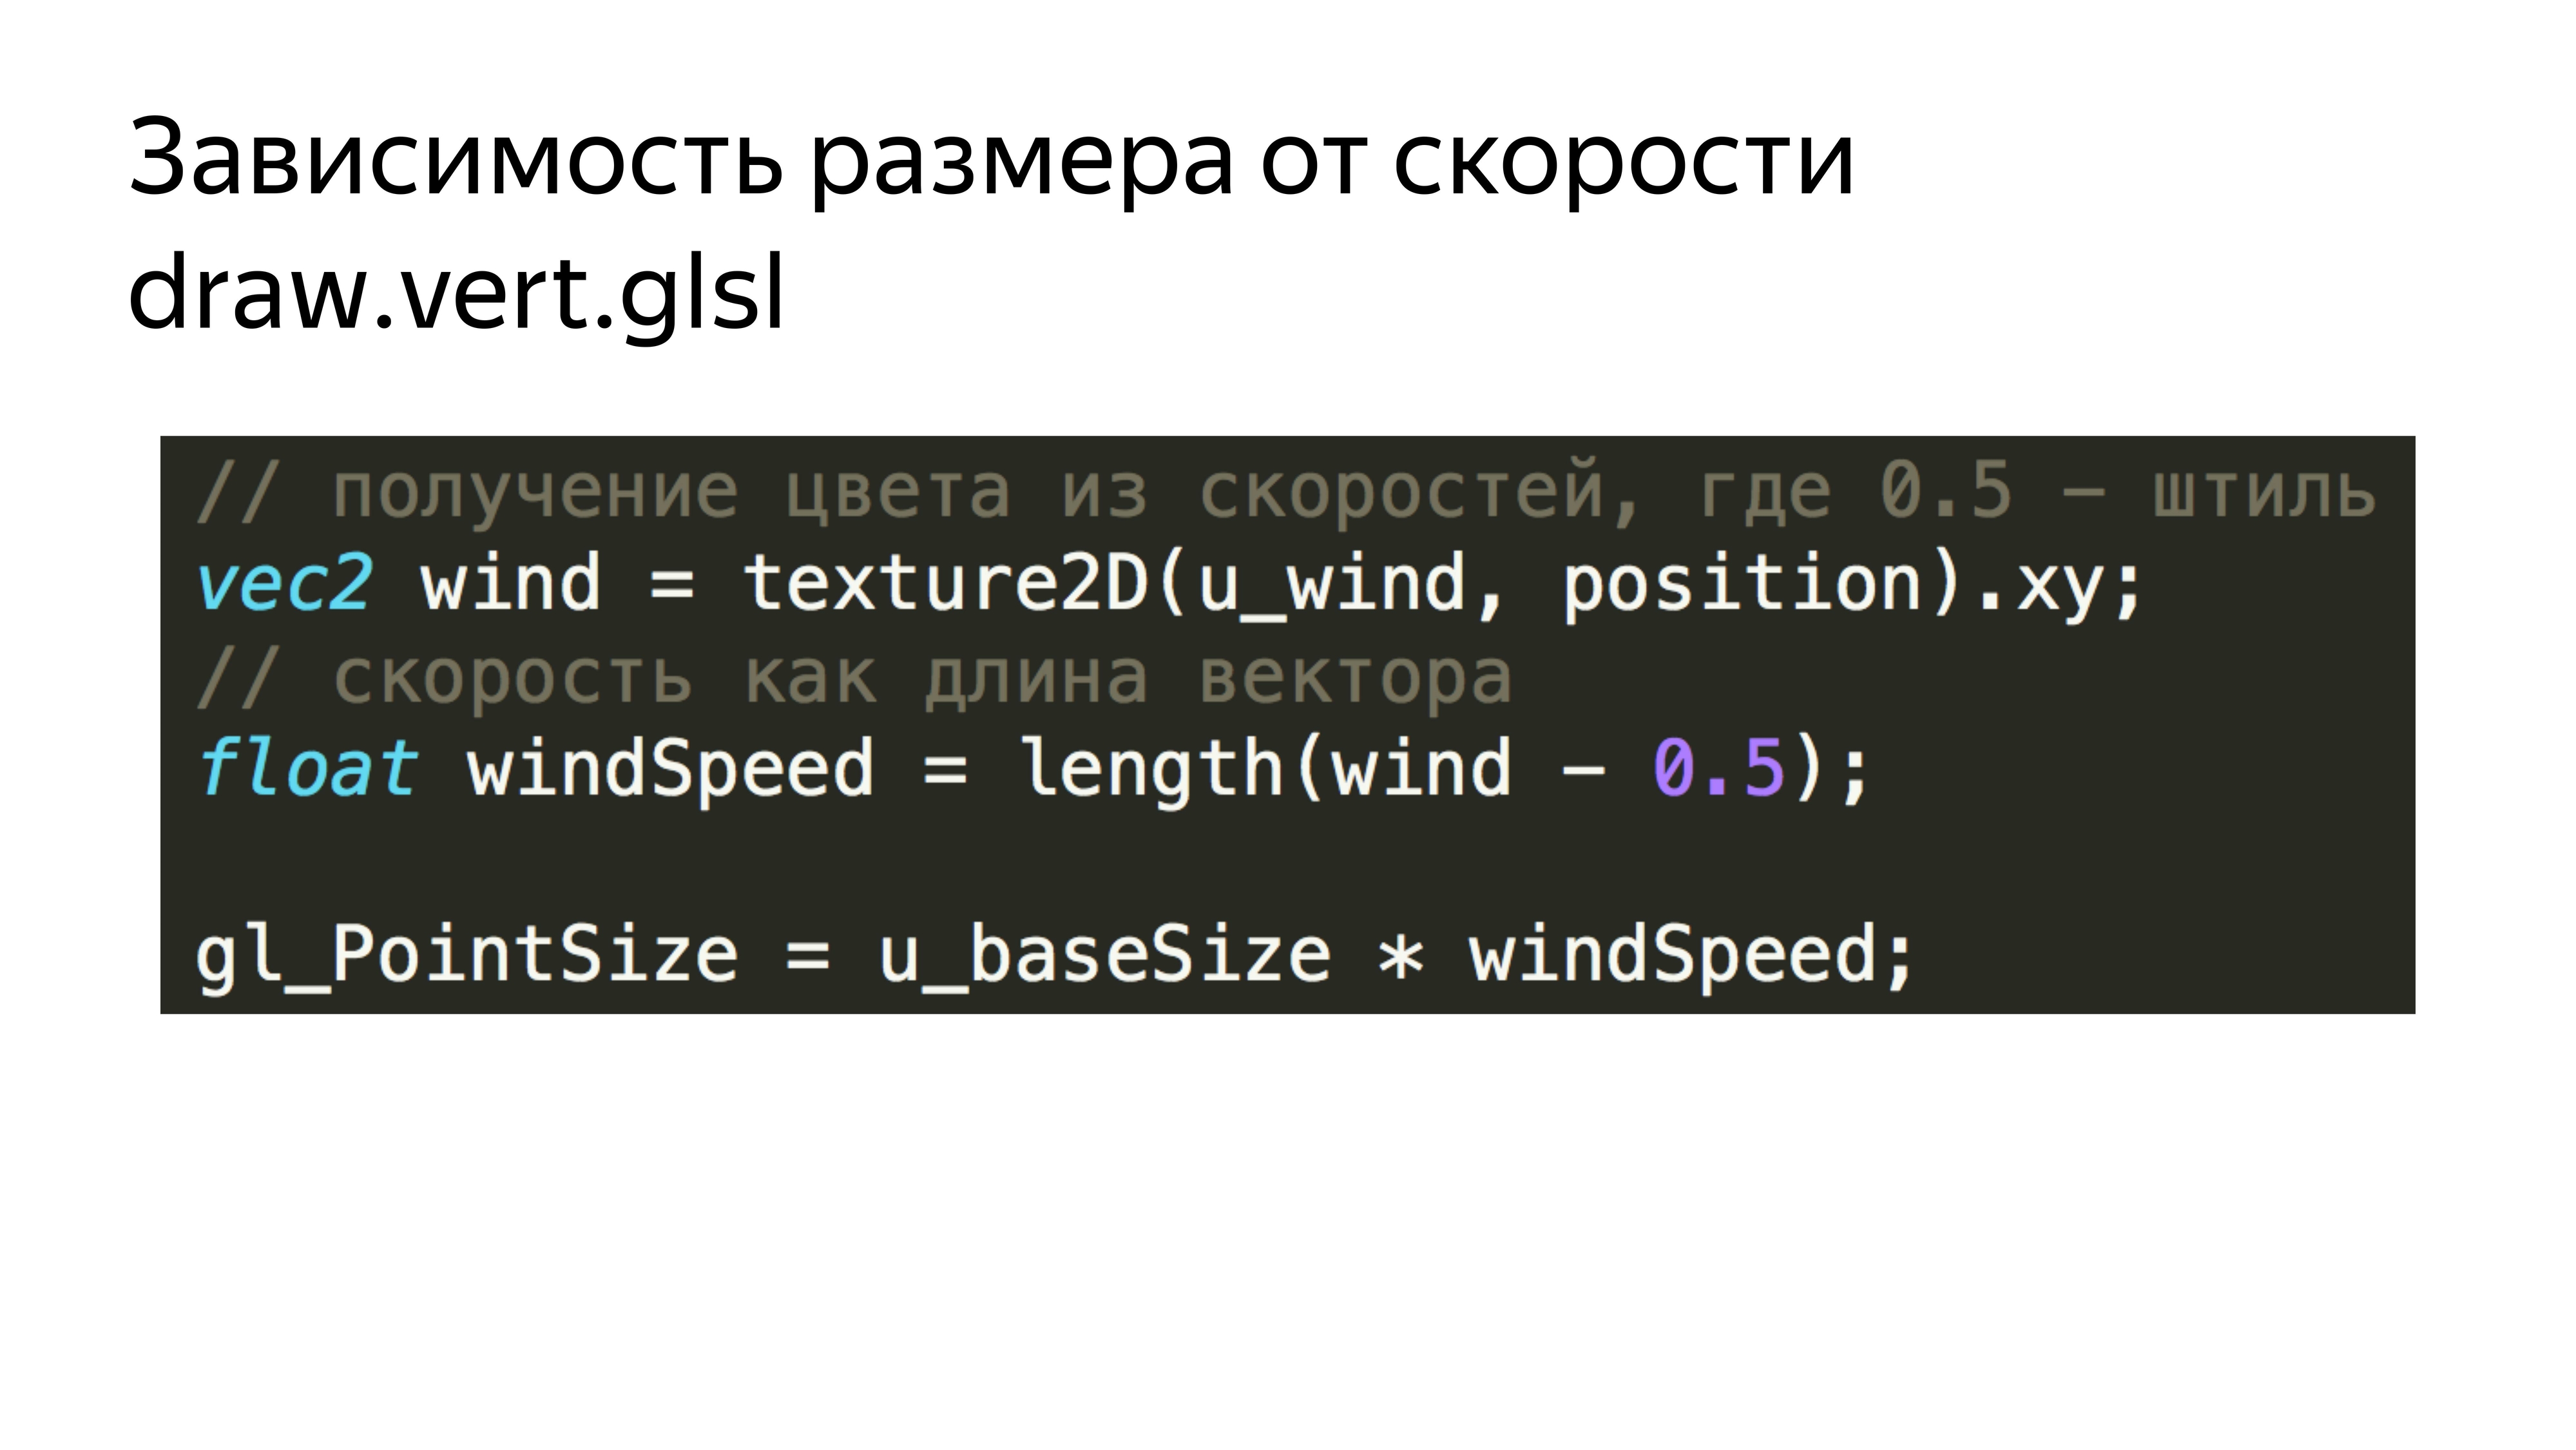
First, add the dependence of these squares on the current wind speed. We simply read the current speed and the corresponding textures for each particle. We obtain the length of the vector, which corresponds to the absolute velocity at a point, and add this velocity to the particle size.
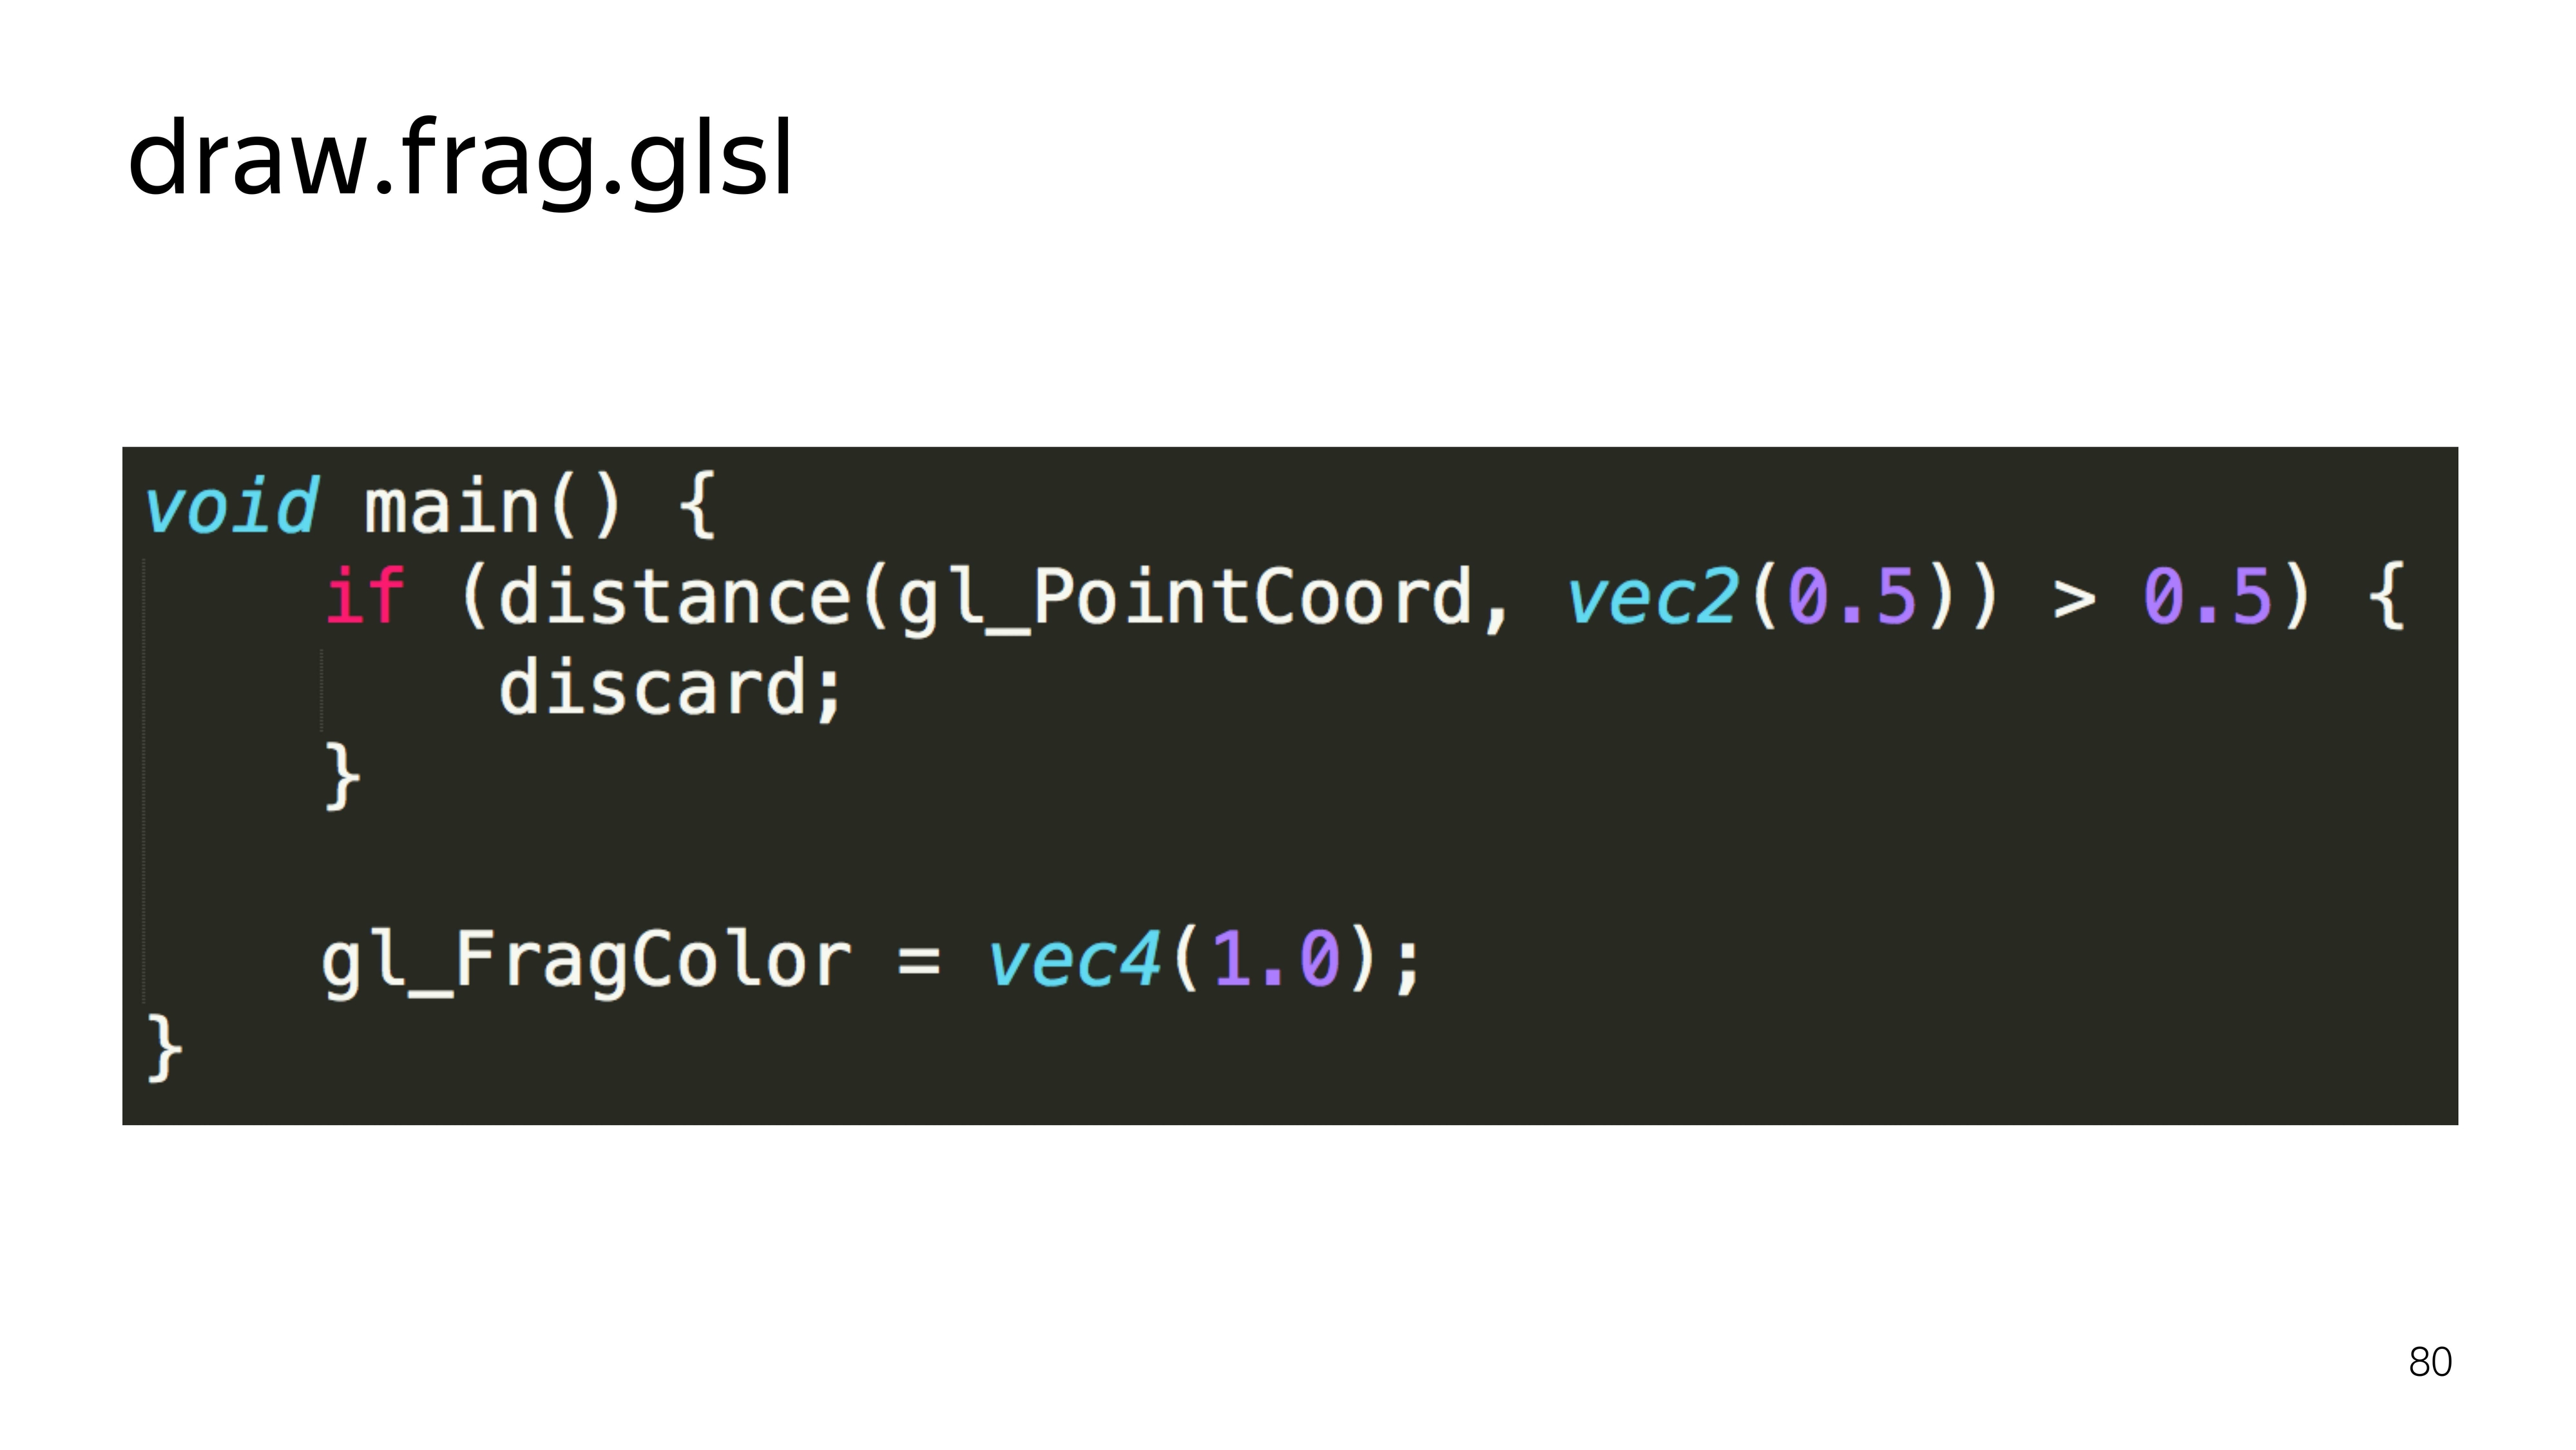
Further, in order not to draw the squares, in the fragment shader, we cut off all the pixels that fall outside the radius, which are not included in the radius of the inscribed circle. That is, our shader turns into such a thing.
Calculate the distance to draw the pixel from the center. If it exceeds half the space, then we do not show it.
We get a more diverse picture.
Next you need to somehow move these things. Since WebGL 1 does not know how to calculate something, work directly with data, we will use the possibilities of drawing programs into special components, frame buffers.
Frame buffers can bind, for example, textures that can be updated. If the frame buffer is not declared, then the default drawing is performed on the screen.
By switching the output from one position texture to another, we can update them one by one and then use them for drawing.
The very procedure of updating the position looks like this: read the current position, add up with the current velocity vector and fold, encode in a new color.
In the code, it looks like reading the current position, decoding, reading the current speed, bringing the speed to a normal form, folding the two components, encoding in color.
It turns out this picture. We are constantly changing the state of the particles, and there is some kind of animation.
If such an animation is run for 5–10 minutes, it will be seen that all particles will arrive at their final destination. They all slide into the funnel. It turns out this picture.
To avoid this, we introduce the particle permutation factor in a random place.
It depends on the current wind speed, on the current position of the particle and the random number that we transmit from JS - because in the first version of WebGL there is no randomization function built in and some noise-functions.
In this example, we calculate the predicted position of the particle, the random position, and choose either one or the other, depending on the reset factor.
Links from the slide: first , second , third , fourth
To understand what was on the last slide, you can read these articles. The first provides a huge boost in understanding what WebGL gives, what it consists of and how not to err in it. At Khronos, this is a group that develops a standard; there is a description of all functions.
The last point of our task is to draw a trace from the particles. To do this, we will record the current position on the screen in two textures, and display the current position on the screen, slightly increasing its transparency, overlay the new position of the particles, then increase the transparency of this image and more impose a new position on top.
We get this animation plume.
If you compare the full cycle of drawing WebGL with the output of some points on the screen using 2D canvas, you can see a big gap in speed. To draw 64 thousand points on 2D canvas, it takes an average of 25 ms, while WebGL blocks the main stream for 0.3 ms. This is a difference of a hundred times.
Thus, the use of WebGL allows you to less block the flow of the foundation, and this is especially important when working with the card when high responsiveness of the card itself is important.
Initially, all developers are probably used to using the browser console to put some break points, console logs and see what is going on inside. WebGL is a black box.
But there are some tools that allow you to work with him. For example, Firefox has a built-in “shaders” tab, where you can find WebGL banners on the fly, extract programs from them, extract shaders from them, and change values on the fly. For example, here on the fly the color of dots from white turns to blue.
The second tool that makes life a lot easier is the Spector.js browser extension. It also captures the canvas from the WebGL context and allows you to see all the operations performed on this canvas, timings, and passed variables.
Total for the week of work we got a ready-made solution to the wind from scratch . Hopefully, I was able to tell what kind of technology it is, WebGL, what it consists of, and give a real example of its use in sales. That's all.