Systems Management Analysis

Managing something or someone, as a rule, we do not affect the managed system constantly and in general. Only from time to time we try to adjust it so that the desired goal is achieved. If you quickly determine the moment and place where efforts should be made, the system will slightly move away from the planned vector of development and at minimum cost will return to the path to the goal we need.
How to quickly find those elements of the system that need to be corrected? We will try to answer this question today. We will not seek a solution in the field of complex algorithms, which are often difficult to understand and apply. We will talk about simple things that, about 70 years ago, were the reason for overcoming the crisis for the whole country.

The measurement and analysis of mass phenomena will be discussed. Only such phenomena will be statistically controlled. Why can people consider statistics to be evil? Sometimes this is due to the fact that someone with intent or stupidity incorrectly draws conclusions based on it. Three examples that many face in everyday life.
The average value is just the tip of the iceberg
We consider the average values of two samples with a volume of 50 from two different populations. By coincidence, they coincided. And it well describes what the average shows us, which is very often used to briefly describe systems. Instead of listing the income of all employees or citizens of the state, they are talking about the average value. And as we understood, the average value may be the same for different populations. It can also be the same for the same system at different points in time. For example, in the example of citizens' incomes in the state, an increase in the size of the middle class could occur, and an increase in the wealth of the rich and a larger decrease in the income of the poor could occur. Thus, in order to understand the system well, we need to know the law of distribution of quantities in this system.
Need more observations
Secondly, the basis of a statistical study is a lot of data on the measurement of one or more features. A real observable collection of objects, statistically represented by a series of observations of a random value, is a sample. Hypothetically existing (conceived) - by the general population. If the sample size is large enough (n → ∞), the sample is considered large, otherwise it is called a limited-size sample. So, a sample is considered small if, when measuring a one-dimensional random variable, the sample size does not exceed 30 (n <= 30), and when measuring several (k) features simultaneously in multidimensional space, the ratio of n to k does not exceed 10 (n / k <10 ) When analyzing statistics on small samples, it is necessary to understand that statistical calculations will have big errors.
"Can not be!"
Thirdly, statistics do not say anything about one specific case. Suppose you decide to play the Martingale systemtossing a coin. You know that the probability of an eagle or tails falling is 1/2. You have 15,000 rubles and you decide to bet 1,000 rubles each. You bet 1000 rubles always on the loss of the "eagle". In case of a win, you start again with a bet of 1000 rubles, and in case of a loss, double the bet each time until you win. It may seem that after some time you will become a millionaire. But playing by this system, the player does not receive advantages, he just redistributes his winnings: the player rarely loses, but a lot, and often wins a little. You were unlucky and the tails fell four times in a row. The probability of such an outcome is 0.5 * 0.5 * 0.5 * 0.5 = 0.0625
This is more than 6 times in 100 experiments on 4 coin flips, why couldn’t your case be one of 6? The statistics do not say that 0.0625 is not enough and you should be lucky, it speaks of an infinitely large series of experiments on 4 coin tosses. The law of large numbers in probability theoryargues that the empirical average (arithmetic mean) of a sufficiently large finite sample from a fixed distribution is close to the theoretical average (mathematical expectation) of this distribution. That is, the larger the series of experiments, the closer the results of these experiments are to the calculated probability (in our case, 0.0625). But if there is a finite and small number of experiments, then the result can be any. In other words, immediately trying to play again at 15,000 according to the same scheme, the next loss will still fit into the possible distribution of the results of the coin toss. It is worth noting that the combination of two losses as a result of two series of 4 toss is much less. 0.0625 * 0.0625 = 0.00390625 or about 4 per 1000 experiments (from two series of 4 tosses).
Let's move on to practice
All these examples are given not only in defense of statistics, but also with the aim of helping to make the correct analysis of the indicators of a statistically controlled system. An example of a managed system in our case would be a technical support department with 20 specialists. For ease of understanding, we assume that they are fully loaded and solve any types of problems that arise with different clients. Approximately an equal amount of time is spent on solving different types of problems. At the end of the month, the following results were obtained. They are sorted in ascending or descending form and will be the basis for the conclusions of many managers.
| A place | Specialist | Total hits, pcs | Average time per ticket, min |
| 1 | Ivanov | 246 | 39 |
| 2 | Petrov | 240 | 40 |
| 3 | Chkalov | 234 | 41 |
| 4 | Fedotov | 228 | 42 |
| 5 | Maximov | 222 | 43 |
| 6 | Korolev | 222 | 43 |
| 7 | Frolov | 222 | 43 |
| 8 | Chernov | 216 | 44 |
| 9 | Belov | 216 | 44 |
| 10 | Antonov | 216 | 44 |
| eleven | Grigoryev | 216 | 44 |
| 12 | Tkachenko | 210 | 46 |
| thirteen | Kuznetsov | 204 | 47 |
| 14 | Romanov | 204 | 47 |
| fifteen | Smirnov | 204 | 47 |
| 16 | Vasiliev | 204 | 47 |
| 17 | Novikov | 198 | 48 |
| 18 | Yakovlev | 192 | fifty |
| 19 | Popov | 190 | 51 |
| 20 | Fedorov | 142 | 69 |
Suppose the head of a department decides to give out a bonus to managers in the TOP-3 at a rate of 20% of the salary and fines three specialists with the worst results for 20%. Is it right to solve the question of motivation? The head of the department explains his decision with a desire to provide an incentive for employees to strive for better results and not be among the worst. Why were three specialists selected from the end of the list? Perhaps because this is the favorite number of the department head.
What happens if you use the statistics?
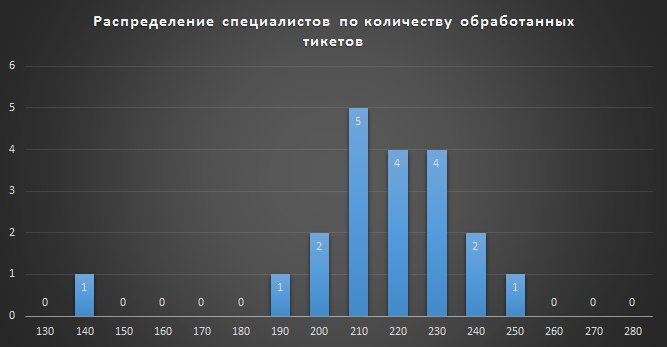
This is how the density of distribution of specialists by the number of processed calls looks like. It is clearly seen that 19 specialists form a sample, the indicators of which will be well described by the normal distribution.
If the result of observation is the sum of many random weakly interdependent quantities, each of which makes a small contribution with respect to the total, then with an increase in the number of terms the distribution of the centered and normalized result tends to normal. This law of probability theory has the consequence of widespread normal distribution, which has become one of the reasons for its name.
What does this mean in terms of statistics and probability theory? 19 specialists worked fine. There were many phenomena (noise, room temperature, mood, and more), each of which influenced specialists to varying degrees, which led to the actual distribution of the results. Is it possible to say that the first on the list worked better than the nineteenth, which they want to fine? Statistics in this case say that the difference in the results of their work can be caused by random reasons, the combined effect of which some call luck. Should luck or failure cause a change in employee income? In my opinion, no. As a result, the employee will not feel the connection between the efforts expended and the result obtained. This will not allow creating additional incentives to increase work efficiency.
What about the twentieth employee (Fedorov)? If we accept the hypothesis that the results of employees in our system are distributed normally, the probability of obtaining any result in such a system will be known to us. Fedorov processed 140 tickets. The probability of such an event under normal distribution, that is, under the combined influence of many of the same random factors, is 1 in 10,000 experiments. We have two options left: either Fedorov was terribly unlucky, or there were some special reasons (including a reluctance to work) that influenced his results.
How sensitive are the deviations to the framework within which the results of employees will fit, everyone can choose for himself, following certain rules. By the principle of the Shekhart-Deming control cardscontrol boundaries - a corridor within which values lie at a stable (normal) state of the process.
The purpose of constructing a Shekhart control card is to identify points of the process’s exit from a stable state for the subsequent establishment of the causes of the deviation that has appeared and their elimination. Popular, thanks in large part to Deming, is the 6 sigma method.
The method name is based on the statistical concept of standard deviation, denoted by the Greek letter σ. The maturity of the process in this concept is described as the percentage of system elements whose output indicators fit into 99.99966% of the density of the normal distribution. For control purposes in this method, it is important for us to understand what control boundaries we take. With what probability are we going to consider abnormal or, in terms of control charts, “outliers” of processes? Common standard practice is three standard deviations from the arithmetic mean. Why 6 sigma and not 8 or 4? It is possible to multiply by three it is convenient and pleasant, but the main thing is that a really small part of the distribution remains beyond the ± 3 sigma limits, the outlier to which is worth attention. It’s clear that the deviation from the average can be added as soon as we get the upper control boundary,
We will create a control card for the fictitious results of the technical support department.
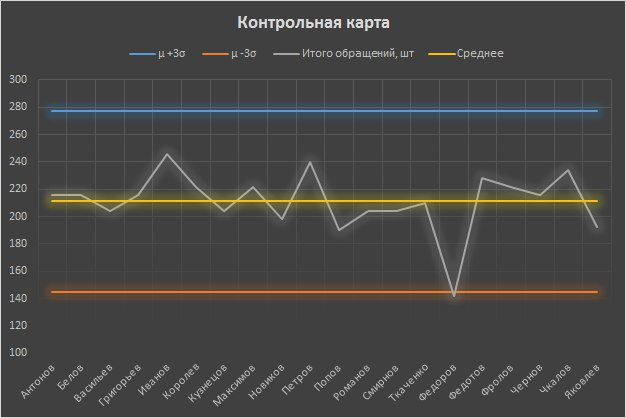
Indeed, Fedorov showed an abnormal result that did not fall within the control boundaries. After interviewing him, the boss should find out about the reasons for such a result and decide on the motivation of the employee, depending on the validity of these reasons. The results of the remaining employees were normally distributed, which means that from the point of view of statistics, they were influenced by many random factors. If any of the employees would show an outstanding result outside the upper control boundary, this phenomenon would also require study on the possibility of implementation on a larger scale.
However, deciding on employee motivation at the end of the month is not the best decision. In the past, nothing will be impossible to change, and poor results of individual employees may affect the results of the work of the entire department. In order to respond and adjust the system development vector in time, we need more control charts. Imagine that we have them for each employee and we record observations on a daily basis.
Let's look at Fedorov’s control card, but first, let’s say a little about the signs of a particular process variability, signaling a violation of the stability (controllability) of the process and the emergence of a special reason for this variability:
- exit points beyond the upper or lower borders of the control card
- 7 or more points in a row lie on one side of the midline
- more than 6 points monotonically increase or decrease
There are other signs. There is no established generally accepted set of additional rules for reading control charts, therefore it is recommended to use the Shuhart rule (exit of points beyond the borders) first of all, and introduce all the others as experience is gained, if necessary.
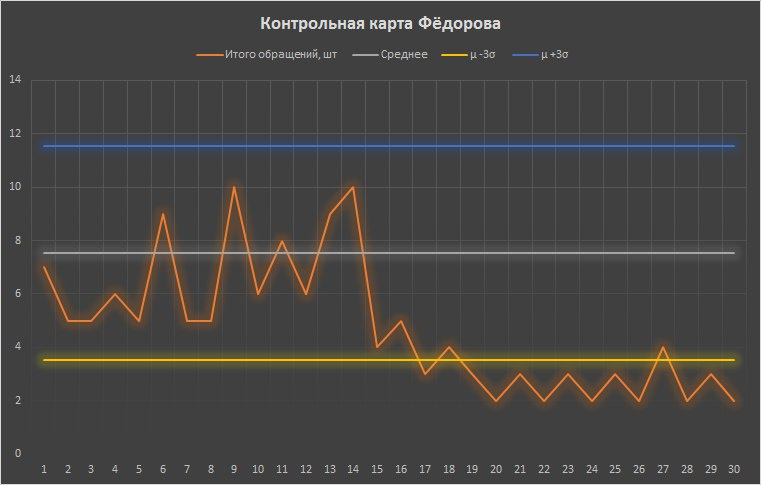
To note that Fedorov’s work has changed, it was possible not only at the end of the month. Already on the 17th there was a release of the indicator beyond the control borders. It was at this moment that the head of the department was to notice the signal and find out the causes of this anomaly.
In general, this is a topic of quality management. Its purpose is to ensure the stability (controllability) of any processes: the sales process, personnel management, the provision of services or production. We give an example with real numbers. As a cloud provider, we must ensure the availability of our SLA services is not lower than 99.95% . That is, a certain infrastructure (for example, a virtual machine with certain characteristics) or a service (for example, a virtual desktop) can benot available for the client no more than 22 minutes for the whole month. To ensure such reliability and stability of exits from the process of providing services by a cloud provider, a stable system is being built that is monitored at a much greater frequency than in the example earlier. At the heart of such a system is enterprise-class equipment located in several Tier III data centers connected by a high-availability optical ring with duplicated channels, and, of course, 24x7 technical support. The business of a cloud provider is one of the prime examples when the quality of services depends on the quality of the computer systems and the personnel of the organization.
If you liked the topic of statistical process control, we highly recommend reading Edwards Deming’s book, Overcoming the Crisis: A New Paradigm of Managing People, Systems, and Processes. Deming first visited war-torn and backward Japan in 1946. His lectures on statistical quality control methods were received by senior managers of Japanese companies. The need to study and implement statistical control methods was recognized, and a process of mass training of managers was organized in Japan. Further development of these methods led to the creation of the Toyota Tao system and Kaizen philosophy. Many people consider these methods to be the cause of the "Japanese economic miracle", which led the country to economic leaders. Here are a couple of quotes from the book “Overcoming the Crisis” that prompted us to write this article.
"The ranking of people who belong to the system (from prominent to worst) contradicts scientific logic and is destructive as politics."
“The manager should be able to use the calculations, if there is relevant data, or based on judgment, when there is no such data, to distinguish those employees who are outside the system for both the worse and the better, and thus require either special assistance or should be highlighted and encouraged in one form or another. "