About analytics and silver bullets or “What does the Rambler / top-100 have to do with it?”
Hello! I am the team leader of the Rambler / Top 100 project. This is a longrid about how we designed the architecture of the updated web analytics service, what difficulties we encountered along the way and how we fought them. If you are interested in such puzzles as Clickhouse , Aerospike , Spark , welcome to cat.
Last year, Rambler and the Top 100 turned 20 years old - a fairly long period for which the service had several major updates and the last of them happened a long time ago. The previous version of the Rambler / top-100 is obsolete in terms of interfaces, code and architecture. When planning a restart, we were aware that redecoration was indispensable - we had to build a new service from scratch.
Search for a solution
Let us return briefly to the past, at the beginning of 2016, when the composition of the Rambler / top-100 restart was determined and the release date was set. For the restart, we had to repeat the functionality of the previous version of the Top-100, as well as supplement the service with several new reports on the behavior of visitors needed to solve the analytical tasks of Rambler & Co services.
At that time, we had an understanding of how to build architecture with batch calculations once a day. The architecture was as simple as three kopecks: at night, a set of Hive scripts is launched, reads raw logs, generates a predefined set of aggregates for the previous day from them, and pours it all into HBase.
Understanding that the statistics on the morning of the next day, it is literally yesterday, we searched and explored various options for systems that will ensure data availability for analytics with a small interval (5-10 minutes or less). To achieve this, it was necessary to solve a number of problems:
- calculation of constantly updated data in close to real time;
- bonding target events with pageviews and sessions;
- request processing with arbitrary data segmentation;
- All of the above should be done quickly and keep a lot of simultaneous requests.
Let's take a closer look at each problem.
Data from users comes constantly, and they should be available as quickly as possible. This means that the database engine should quickly insert data, and they should be immediately available for queries. There is a need to consider user sessions that go far beyond the time frame of one micro-batch . That is, we need a mechanism for storing sessions, and the data itself should be poured into the database not at the end of the user session, but as events arrive. At the same time, the database should be able to group these data into sessions and page views. It is also important that the database engine provides the possibility of gluing and changing entities after recording (for example, during a session, a target event occurred, the user clicked on some block).
There are situations in which it is necessary to quickly make aggregate queries with user-defined segmentation. For example, an analytics user wants to find out how many people are logging in with IE6 from Udmurtia, we need to calculate and show this. This means that the base should allow the storage of sufficiently weakly aggregated or not at all aggregated entities, and reports on them should be built on the fly. Given the total amount of data, a sampling mechanism is needed (constructing a sample and calculating data from this sample instead of calculating the entire population).
At the same time, one should not forget about the growth of data volume in the future: the architecture should keep our load at the start and scale horizontally. The load at the time of architectural design is 1.5-2TB of raw logs and 700 million - 1 billion events per day. Additionally, it is very important that the database compresses the data well.
After reviewing a bunch of articles, documentation, talking with wise salespeople and reviewing a couple of dozen reports from various BigData conferences, we came to a not too happy conclusion. At that time, there were three systems that met our requirements on the market: Druid, HP Vertica, and Kudu + Impala.
Druid was opensource'ny and according to reviews rather smart, but very crude. Vertica was suitable in all respects and was much cooler than a druid in terms of functionality, but the cost of the database on our data volumes was unbearable. We found very little information about Kudu + Impala, it’s scary to use a project with such a lot of documentation in production.
Another limiting factor is time. We could not afford to develop a new system for several years: existing Top-100 users would not have waited for us. It was necessary to act quickly.
Having taken into account all the introductory ones, we decided to restart the service in two stages. First, we implement the functionality of the old reports on the batch architecture, try to avoid the degradation of the functionality to the maximum, and add some new features critical for internal customers. At the same time, we are actively looking for solutions that will allow us to calculate data and display them in the interface in close to real time.
New architecture or “this is a turn!”
Time passed, the date of the restart was drawing near, Druid and Kudu slowly acquired documentation, Vertica was not going to get cheaper. We almost decided to make a monster out of a combination of Druid and a batch calculation, when SUDDENLY Yandex posted in opensource Сlickhouse.
Naturally, we drew attention to a new opportunity - at first glance it ideally solved our problem. After carefully studying the documentation, talking with acquaintances from Yandex and conducting stress tests, we came to the conclusion that we will consider Clickhouse as the main option for the second stage of the Top 100 update.
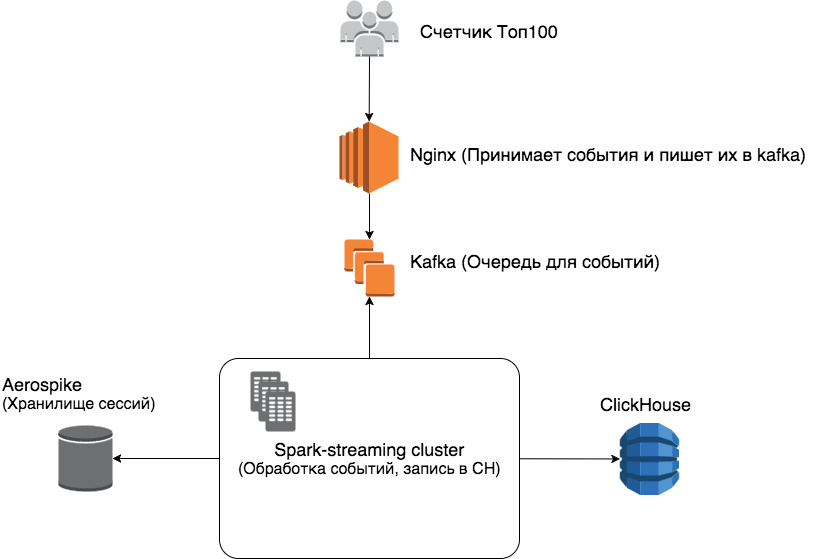
As a result, we have the following architecture:
In order.
Nginx - receives events from visitors to web pages transmitted by the counter, writes them to the event queue.
Kafka - A very fast queue of events, with replication, able to work with several clients at once.
Spark-streaming - performs streaming data processing, python implementation.
Aerospike - it is Aerospike that was chosen as the session repository because it has a lot of data (on average, the mark is kept at 250-300GB of stored sessions), and Aerospike has a fairly good ratio of the cost of iron to the amount of stored data.
Why Aerospike, because Spark has a checkpoint (built-in option for storing object states)? The fact is that the documentation on checkpoints in Spark is quite crude and uninformative. For example, it’s not completely clear how to monitor the expiration of sessions, as well as the amount of memory and disk used to store checkpoints. Aerospike can automatically delete expired sessions from the box; it is relatively easy to monitor and scale.
ClickHouse is a column database and reporting engine in one bottle.
A little more details about the Spark + Aerospike + Clickhouse combination, so that it doesn’t work, as in the old picture.

Events from visitors are read by Spark from Kafka, the micro-batch includes 5 minutes of data. Data is grouped by project and unique visitors (cookies) within the projects. For each visitor, it is checked whether there is an active session in the framework of this project and, if so, data is taken from this session for gluing with new data. Sessions and session data are stored at Aerospike for some time. After gluing sessions, we need to save them in Clickhouse. In this, the CollapsingMergeTree engine is ideally suited for us: when new data comes to us, we make two records in Clickhouse - the old one, if any, with a (-) sign and the new one with a (+) sign.
We sorted out the visitors, now more about the sessions. For the first event encountered from the visitor, we generate session_id, save this id and the time of the last event in Aerospike. All further events within this session are assigned this id. If the time interval between the last session event from Aerospike and the new event is more than 30 minutes, we consider this event to be the beginning of a new session, and everything starts anew.
Such an architecture solves all the problems described at the beginning of the article, it scales quite easily and is tested.
To verify that this architecture will work in reality, to hold our expected load and respond quickly enough, we conducted three tests:
- Clickhouse stress testing with data sample and proposed table layout;
- Kafka-Aerospike-ClickHouse ligament stress testing;
- tested a working prototype of the bundle under production load.
All tests ended successfully, we were delighted and started implementation.
Overcoming difficulties
In the course of implementing the invented scheme, we naturally met a number of rakes.
Spark
Sometimes not very informative logs, you have to dig into the source and trackback Spark on Scala. There is no recovery from the offs in Kafka out of the box, I had to write my bike. In addition, we did not find the normal graceful shutdown mechanism for real-time calculation, we also had to write our bike (some information about this problem).
Aerospike
So far there have been no problems, except for the test namespace you need a separate partition on your hard drive.
Clickhouse
There is almost no DDL automation for the cluster (for example, to make an alter table on a distributed table, you need to go to all the nodes and make an alter table on each node). There are many undocumented functions - you need to go into the code and understand or ask directly from the CH developers. Work with replicas and shards is weakly automated, partitioning only by months.
It's alive, ALIVE!
What happened as a result. Base scheme.
CREATETABLEIFNOTEXISTS page_views_shard(
    project_id Uint32,
    page_view_id String,
    session_id String,
    user_id String,
    ts_start Float64,
    ts_end Float64,
    ua String,
    page_url String,
    referer String,
    first_page_url String,
    first_page_referrer String,
    referer String,
    dt Date,
    signInt8
) ENGINE=CollapsingMergeTree(
    dt,
    sipHash64(user_id),
    (project_id, dt, sipHash64(user_id), sipHash64(session_id), page_view_id),
    8192,
    sign
);
A line in the database schema is a page view with all the parameters associated with it. (The scheme is intentionally simplified, there are not a large number of additional parameters).
Let's analyze in order:
• dt - date, a mandatory requirement for MergeTree tables;
• sipHash64 (user_id) - to support sampling;
• (project_id, dt, sipHash64 (user_id), sipHash64 (session_id), page_view_id) - the primary key by which data is sorted and by which values with a different sign are collapsed;
• 8192 - index granularity;
• sign - described above.
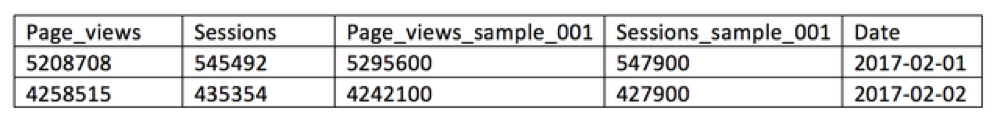
Examples of requests for one of the projects: The
number of page views and sessions per month, grouped by date.
SELECTSUM(sign) as page_views, uniqCombined(session_id) as sessions, dt
FROM page_views
WHERE project_id = 1GROUPBY dt
ORDERBY dt
WHERE dt >= '2017-02-01'AND dt <= '2017-02-28'FORMATJSON;
2-5 seconds for complete data (127cc lines)
0.5 seconds for sample 0.1
0.1 seconds for sample 0.01
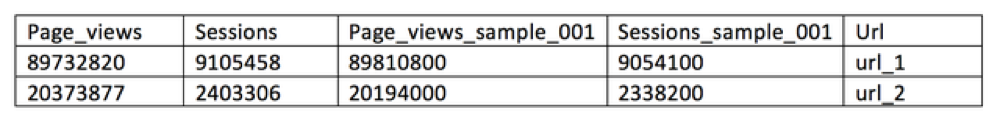
Count all page_views, visits with grouping by part of url.
SELECTSUM(sign) as page_views, uniqCombined(session_id) as sessions, URLHierarchy(page)[1]
FROM page_views
GROUPBY URLHierarchy(page)[1]
ORDERBY page_views DESCWHERE dt >= '2017-02-01'AND dt <= '2017-02-28'and project_id = 1LIMIT50FORMATJSON;
10 seconds on complete data
3-5 seconds on a sample 0.1
1.5 seconds on a sample 0.01
Kafka
Doesn't even bother.
Spark
Works fast enough, lags at peak loads, then gradually catches up with the queue.
ClickHouse, Data Compression
1.5-2TB of data is compressed to 110-150 GB.
ClickHouse, Load per record
1-4 RPS with batches of 10,000 entries.
ClickHouse, the load on reading
Currently, it depends heavily on the requested projects and the type of report, from 5 to 30 RPS.
Sampling should solve this problem depending on the size of the project and the quota.
Results and Impressions
Mmm-magic. We rolled out in production the first report working with ClickHouse - "Today in detail . " Wishes and constructive criticism are welcome.
To be continued. I would be glad if you write in the comments about what it would be interesting to read in the future: the intricacies of operation, benchmarks, typical problems and ways to solve them, your option.