Implementing Lean Tools on the Service Desk Team
Background
 Any service for end users should be flexible, reflecting their current needs. Business is developing, the quality of service should also grow. If this does not happen, sooner or later the level of services specified at the start of the project will cease to suit consumers. Therefore, I want to share with you my experience in introducing new methods of work in our Service Desk (SD) team.
 At the end of 2012, we launched the SD service for one of our customers 24/7/365. Prior to this, the customer did not have a full SD service, all support was provided by internal departments. A new team consisting of 7 employees, including me, was selected and trained for this project. The service started actively - knowledge transfer, familiarity with the specifics of work. The team had a lot of ideas and enthusiasm. Service earned like a clock.
Why is it difficult to provide good service without a change in work?
The composition of the team has not changed much for 3 years. Those who are familiar with the work of SD can imagine how much this is. Over time, enthusiasm began to fade, routine tasks engulfed the team, and involvement in the project decreased.
The last straw was the feedback officially received from the client about the low quality of our service. According to its results, it became apparent that the employees were not fully immersed in the project and did not use their experience to improve support processes, and these qualities are vital for competitively capable technical support.
It is time to change the team’s approaches to the service provided. In this vein, Lean tools came to us, which have proven themselves in our company for several years.
What is Lean?
Lean manufacturing (from the English lean production, lean manufacturing - “lean manufacturing”) is the concept of managing a manufacturing enterprise based on a constant desire to eliminate all types of losses. Lean manufacturing involves involving each employee in the business optimization process and maximizing customer focus.
The Lean approach in our company is a combination of tools and principles that help to form and maintain a culture of continuous improvement.
The principles of the Lean approach are as follows:
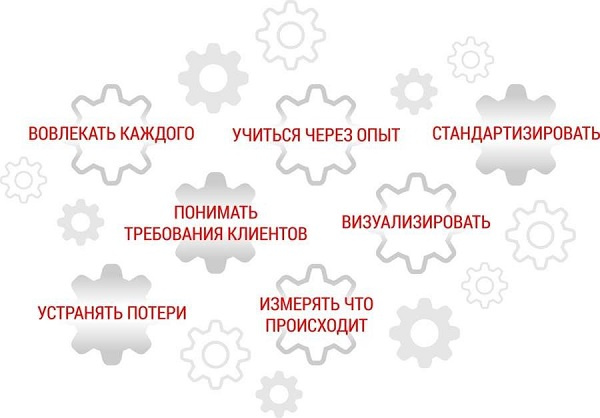
Tools and techniques that we already use at the company level:
- Communication Cell, or “quality circles”, is a team meeting with a clear program, an effective format for internal communication.
- Demand analysis - a way to search for trends in incoming calls (for example, incidents) to reduce their number.
- Problem solving session - identification of the root causes of incidents and team development of measures to eliminate them.
- Workplace organization - optimization of physical and virtual workspace.
- Value stream mapping is a workflow optimization tool based on their detailed analysis.
To quickly correct the situation on the project, we selected the following tools:
- “Mugs of quality” - to engage the entire team in the process of improving the service, visualizing the current performance indicators of the service, collecting feedback.
- Demand analysis - an assessment of current trends in the service, the reasons for calls, the definition of areas of increased labor costs on the part of SD and the client.
- Problem solving session - to develop actions to achieve new service targets, reduce labor costs, increase work efficiency.
- Workplace organization - for the reorganization of the knowledge base and file storage, which will lead to a reduction in the time spent on finding information necessary to solve calls.
Implementation of tools on the project was divided into three stages:
- The launch of "quality circles".
- Practical use of tools for identifying, solving problems.
- Organization of a virtual workplace
The launch of "quality circles"
“Mugs of quality” is a platform for effective communication. This is a structured format for team interaction to discuss all relevant issues, difficulties encountered in work, and risks. Information for discussion is visualized and placed, as a rule, on marker boards.
For geographically distributed teams, you can use the electronic version. We began to hold meetings weekly in an open format.
Despite the need for these changes, the first thing we encountered was resistance from the team. The employees did not want to participate in the meetings, because they did not see the point in them. Therefore, our goal was through the "quality circles" to show the team how it works, where it is moving and what you need to pay attention to. Talk about the benefits that may be, for example, reducing the cost of processing calls, automating routine tasks, optimizing internal processes.
The principle of involving everyone implies the participation of all employees in the proactive work of the team. This is achieved, inter alia, through the distribution of tasks in preparation for meetings. Each employee is assigned a certain activity. At the first stages, the task of preparing and conducting “quality circles” was carried out only by the coordinator, and the gradual involvement of each team member in it was the right decision.
Gradually, interest in meetings grew.
Each employee got the opportunity to openly discuss his ideas and suggestions with the team. If they required time for elaboration, then they were recorded in a special section, the terms of consideration were set. Further, following the results of the general discussion, they hired or transmitted information to the client for internal analysis.
One of the tasks of the “quality circles” is to maintain the team’s focus on predefined performance indicators. Correctly chosen indicators help to concentrate on what is important for the client. Each indicator has a target value for achievement, agreed with the client. Indicators can be both internal, aimed at improving work within the team, and external, aimed at improving the quality of the service provided.
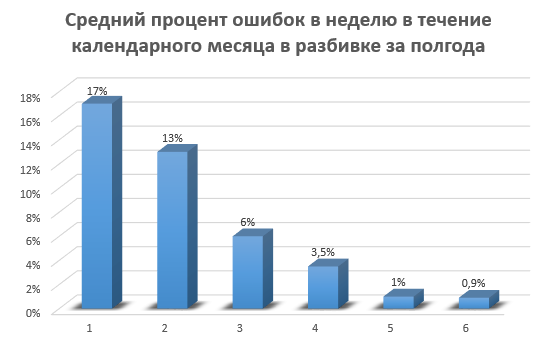
The first task of the team was to focus on the number of errors that occur when filling out an application card in the ITSM system. To determine the root causes, we used a teamwork tool - a problem solving session.
Conduct a problem-solving session
When solving team problems, all employees should be involved in the search for a solution, since the final decisions made without the participation of the whole team, with a high degree of probability, may not be taken seriously.
The tool is quite simple and consists of six stages:
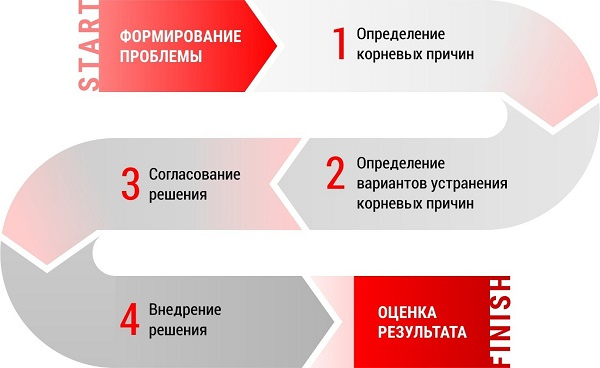
I will tell you a little about each stage:
- In our case, the problem was one of the performance indicators that went beyond the boundary values.
- To determine the root causes, we conducted a “silent” brain storm. Each employee recorded in his opinion all the factors affecting the appearance of errors in the work.
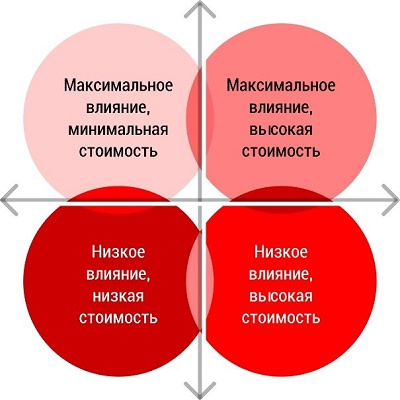
- Next, we distributed all the options in 4 zones and chose those options, the implementation of which will give us the maximum effect at the lowest cost.
- Together with the team leader, we formed an implementation plan that was evaluated weekly at the "quality circles". The term for achieving the goal can be either a month or a year. Depends on the complexity of the indicator, factors affecting its formation. For example, team competencies in a particular field, technical knowledge, etc. We chose six months.
- We identified the steps in accordance with which they began to systematically move towards achieving the goal.
- At intermediate stages, the trend was evaluated, and if necessary, corrective procedures were performed.
For six months, the percentage of errors in filling out an appeal card was reduced from 17% to a stable level of 0.8-1% with respect to the total number of closed appeals.
We visualized the achieved values:
Having gained positive experience with an emphasis in working on a specific indicator, we went further.
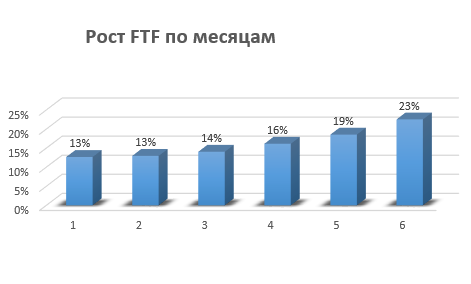
The next goal was to increase the percentage of calls resolved on the first line without transferring them to subsequent ones (First time fix, FTF). To analyze incoming calls and identify potential ones that might be closed on our line, we used a demand analysis tool.
Trend Detection Launch
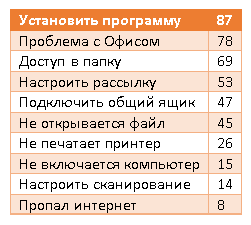
It is necessary to pay attention that one of the key success factors in the analysis is the correct classification. We did the uploading of user requests to Service Desk, which were transferred to the solution on the second support line (the data below were selected as an example, the original punctuation was saved). For a more thorough analysis, you can separate all requests for service requests and incidents.
Sorted them by quantity:
Next, we built a Pareto diagram.
Pareto diagram is a tool that allows you to distribute efforts to resolve problems and identify the main reasons for starting to act.
The Pareto principle (20/80 principle) means that 20% of the effort gives 80% of the result, and the remaining 80% of the effort is only 20% of the result.
The Pareto principle (20/80 principle) means that 20% of the effort gives 80% of the result, and the remaining 80% of the effort is only 20% of the result.
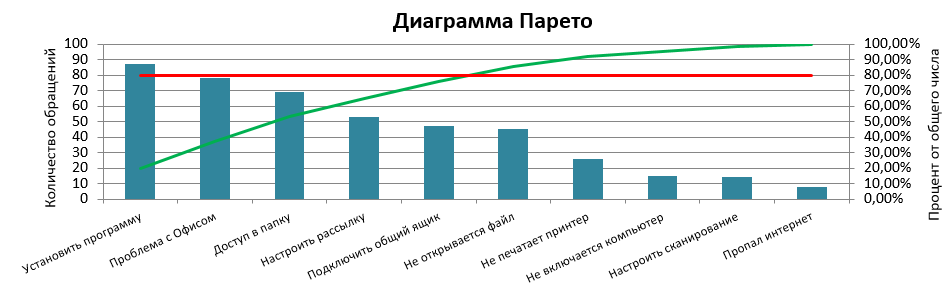
Focus on our 20%.
Select the treatment, which are located on the left to the intersection of the green line with the red one. In this case, we see that the bulk of the calls are related to installing software, problems with the Office, access to network resources, connecting a shared box, adding to the distribution group. This is clearly worth paying attention to and analyzing in more detail.
Having obtained these results, we conducted another brainstorming session with the team as a result of which we determined what we lack to solve such calls on the first line.
At the start of the calculation, the percentage of applications closed on the first line was 13%. Six months later, we got the result already 23%. Almost every 5 access was closed on the SD side .
For the client, this translates into reduced labor costs for the second line of support.
Organization of virtual space (Workplace organization)
For productive and high-quality work on appeals, you need not only a conveniently organized physical workplace, but also a virtual one. During the work of the project, a lot of tools were tried to store information, starting from a txt file, excel, local file resources and ending with sharepoint.
What an organized virtual workplace has become for us: all project information is distributed so that any old or new employee spends no more than a minute searching for the necessary data.
What are the benefits of this change:
- less time to search for information, therefore, reducing the processing time of the appeal;
- information is standardized and visually easily distinguishable;
- the incoming data stream is easily controllable.
To restore order in the information space, we used the 5S approach, which consists of five stages:
- Sift (screening);
- Sort (sorting);
- Shine (highlighting);
- Standardise:
- Sustain (maintenance).
Sift, Sort, Shine are for change, and Standardise and Sustain are for maintaining and verifying compliance, respectively.
 “Sift”: we conducted an analysis of all our locations for storing project information for obsolete or unused data. All unnecessary information was moved to the corresponding Archive folder on each resource. All instructions, documentation stored on local computers, were placed in the general access of the team and also analyzed. This allowed us to estimate the total amount of accumulated knowledge on the project. Information requiring clarification was flagged and gradually clarified. The project uses 7 different resources containing multifaceted information.
 Sort has launched a process of redistributing all relevant information in accordance with its type. Duplicate files have been deleted.
  “Shine”: together with the team, they identified a new file structure for storages, as well as those responsible for entering and changing information.
  “Standardize”: created an internal standard for the storage and distribution of incoming information. Names of files and folders, categories of information, periods of mandatory data updating.
  “Sustain”: the application of the developed standards and approaches in the course of providing the service. Verification of compliance of new standards with work operations. This allowed us to formulate a new approach to the storage, distribution, updating of information.
In conclusion, I want to say that thanks to these simple tools, the team managed to regain customer confidence and significantly improve the quality of the service provided without increasing labor costs.
For the client, the changes became noticeable in the spot correction of problem areas, reducing the number of incidents, reducing the time for resolving calls, received recommendations for optimizing internal IT processes.
Material on the topic .