Flume - manage data streams. Part 3
Hello, Habr! After a long pause, we finally return to parsing Apache Flume . In previous articles, we met with Flume ( Part 1 ) and figured out how to configure its main components ( Part 2 ). In this final part of the cycle, we will consider the following issues:
So, we configured and launched all the nodes, checked their operability - the data is successfully delivered to the destination. But some time passes, we look at the result of the work of our transport network (for example, a folder with files into which data is packed) and we understand that a problem has arisen - starting at some point, new files do not appear in our folder. The next step seems obvious - open the logs, look for the reason. The only trouble is that there can be many nodes in our transport network, which means that you need to manually view the logs of all nodes, which, to put it mildly, is not very convenient. When such problems arise, I would like to respond to them as quickly as possible, and even better - to avoid such critical situations at all.
Flume components in the process of writing metrics that allow you to evaluate the state of the node. From the values of these metrics, it is quite easy to determine that everything is not okay with the node.
To store counters and other attributes of its components, Flume uses java.lang.management.ManagementFactory , registering its own bean classes for maintaining metrics. All these classes are inherited from MonitoredCounterGroup (for the curious, a link to the source code ).
If you do not plan to develop your own Flume components, then digging into the metrics management mechanism is completely optional, just figure out how to get them. This can be done quite simply using the utility class JMXPollUtil :
As a result, you will get metrics grouped by the components of the node that look something like this:
Metrics received, now you need to send them somewhere. Here you can go in two ways.
Flume provides an API that allows you to specify a monitoring method - this uses the MonitorService interface implementations . In order to enable monitoring, you must specify the class that implements
The class
A request to the server looks like this:
If this method of monitoring metrics is not enough, then you have to go the second way and write your own implementation
As a result, we get a neat Graphite branch with all node metrics.

Below are descriptions of the graphs and metrics that we use for one of our services.
Despite the fact that the set of standard Flume components is quite extensive, quite often there are situations that cannot be resolved with these standard components. In this case, you can write your own Flume component and use it in nodes. You can write your own implementation for any of the Flume components - sink, source, channel, interceptor, etc.
The first thing that caught my eye when studying Flume drains was the lack of a flexible drain for the file system. Yes, there is a File-Roll Sink , the capabilities of which were described in the 2nd part of the cycle . But this stock is completely deprived of the ability to somehow influence the file name, which is not very convenient.
We decided to develop our own stock, which allows us to create files in the local file system. The development was guided by the following considerations.
Based on these theses, we came to the conclusion that it is better to leave the task of generating the file name to the client (that is, the services generating the data), otherwise the runoff configuration will be too cumbersome, and for each new “client” you will have to add a separate runoff with individual settings .
Note . A comparison with the HDFS drain, which we talked about in a previous article, is appropriate here. This stock allows for very fine-tuning of rotation and file naming. But this configuration flexibility has a downside - for example, for files rotating once every 15 and once every 30 minutes, you have to make different drains, even if the parameters are identical in everything else.
Total, the decision on the functionality of the file drain was made as follows:
Schematically, the data processing process by this sink looks like this:

What did this result in:
The source code of the file drain and an example of its configuration are uploaded to GitHub . I’ll make no detailed analysis of the development process of this stock, I think it makes no sense, I will limit myself to a few points:
We examined the general data management techniques in the previous parts of the cycle - events can be divided between nodes, duplicated, selected “direction of movement” using headers, etc. Let us now try to use all these techniques in order to build a reliable transport network. Suppose the task is as follows.
On condition 3 I will dwell in more detail. Suppose that the task is to count the unique users of the site in the last hour. In this case, we cannot afford to parallelize the data stream from the machines or calculate this value separately on each web service - it is necessary to count unique users by their cookies on a single data stream from all machines. Otherwise, each instance will have its own set of unique users that cannot be "taken and folded" to obtain the final result.
Note . Of course, the example is a little far-fetched - this problem can be solved in other, more effective ways. The essence of the example comes down to the situation when you need to pass a certain data stream centrally through one processor and it is impossible to share the load due to the nature of the task.
So, for starters, prepare the client and end nodes:

For each of the web services we put our own, individual node - on the same machine as the web service. This is done for the following reasons:
The question remains - how to deliver data so that nothing is lost if something breaks? We have already taken a number of measures - data for HDFS and for FS are written on several machines. At the same time, the data is not duplicated, but divided. Thus, if one of the final machines fails, the entire load will go to the survivor. The result of such a breakdown will be an imbalance in the recorded data volume on various machines, but you can live with it.
To provide greater stability, add a few intermediate nodes Flume, which will deal directly with the distribution of data:
The result was a rather creepy web. What's going on here:
If everything is relatively simple with client nodes - they simply share events between Splitters, then the structure of an individual Splitter should be considered in more detail.

Here you can see that the endpoint for the data is defined using the dist header . At the same time, the events by which unique users are considered do not depend on the dist header - they focus on the uniq header . This means that some events can be duplicated in several channels, for example HDFS and UNQ.
Earlier, I did not specifically indicate the direction from Splitters to UNQ nodes. The fact is that these nodes do not accept distributed data, like HDFS or FS. Given the specifics of the task of counting unique users, the entire data stream must go through only onea car. The logical question is - why do we need 2 nodes for counting unique users? The answer is because if one node breaks, there will be no one to replace it. What can we do here - we cannot divide events between nodes, leaving one alone is also impossible?
Here, another Flume tool can help us, allowing us to work the drains in the group according to the principle “If runoff 1 is broken, use runoff 2”. This component is called the Failover Sink Processor . Its configuration is as follows:
The above setting of the group of flows allows you to use only one drain, but at the same time have a "backup" in case of an accident. Those. as long as the high priority runoff works properly, the low priority runoff will be idle.
Thus, the task has been completed - the data is distributed between HDFS and FS, the counters of unique users work correctly. In this case, the failure of any machine will not lead to data loss:
For such a scheme, scaling tasks come down to a simple change in the configuration of Flume nodes for the corresponding node level (Client, Splitter, or Final):
This concludes our series of articles about Apache Flume. We covered all its most popular components, figured out how to control the flow of data, and examined an example of a full-fledged transport network. Nevertheless, the possibilities of Flume are not limited to all of this - in the standard package there are still quite a few components that we have not considered, which can greatly facilitate life in solving certain problems. We hope that this series of articles has helped you get acquainted with Flume and get a fairly complete picture of it.
Thanks for attention!
- How to configure monitoring of node components.
- How to write your own implementation of the Flume component.
- Designing a complete transport network.
Monitoring component state
So, we configured and launched all the nodes, checked their operability - the data is successfully delivered to the destination. But some time passes, we look at the result of the work of our transport network (for example, a folder with files into which data is packed) and we understand that a problem has arisen - starting at some point, new files do not appear in our folder. The next step seems obvious - open the logs, look for the reason. The only trouble is that there can be many nodes in our transport network, which means that you need to manually view the logs of all nodes, which, to put it mildly, is not very convenient. When such problems arise, I would like to respond to them as quickly as possible, and even better - to avoid such critical situations at all.
Flume components in the process of writing metrics that allow you to evaluate the state of the node. From the values of these metrics, it is quite easy to determine that everything is not okay with the node.
To store counters and other attributes of its components, Flume uses java.lang.management.ManagementFactory , registering its own bean classes for maintaining metrics. All these classes are inherited from MonitoredCounterGroup (for the curious, a link to the source code ).
If you do not plan to develop your own Flume components, then digging into the metrics management mechanism is completely optional, just figure out how to get them. This can be done quite simply using the utility class JMXPollUtil :
package ru.test.flume.monitoring;
import java.util.Map;
import org.apache.flume.instrumentation.util.JMXPollUtil;
public class FlumeMetrics {
    public static Map> getMetrics() {
        Map> metricsMap = JMXPollUtil.getAllMBeans();
        return metricsMap;
    }
}
As a result, you will get metrics grouped by the components of the node that look something like this:
Flume Component Metrics (JSON)
{
  "SOURCE.my-source": {
    "EventReceivedCount": "567393607",
    "AppendBatchAcceptedCount": "5689696",
    "Type": "SOURCE",
    "EventAcceptedCount": "567393607",
    "AppendReceivedCount": "0",
    "StartTime": "1467797931288",
    "AppendAcceptedCount": "0",
    "OpenConnectionCount": "1",
    "AppendBatchReceivedCount": "5689696",
    "StopTime": "0"
  },
  "CHANNEL.my-channel": {
    "ChannelCapacity": "100000000",
    "ChannelFillPercentage": "5.0E-4",
    "Type": "CHANNEL",
    "ChannelSize": "500",
    "EventTakeSuccessCount": "567393374",
    "StartTime": "1467797930967",
    "EventTakeAttemptCount": "569291443",
    "EventPutSuccessCount": "567393607",
    "EventPutAttemptCount": "567393607",
    "StopTime": "0"
  },
  "SINK.my-sink": {
    "ConnectionCreatedCount": "1",
    "ConnectionClosedCount": "0",
    "Type": "SINK",
    "BatchCompleteCount": "2",
    "EventDrainAttemptCount": "567393374",
    "BatchEmptyCount": "959650",
    "StartTime": "1467797930968",
    "EventDrainSuccessCount": "567393374",
    "BatchUnderflowCount": "938419",
    "StopTime": "0",
    "ConnectionFailedCount": "0"
  }
}
Metrics received, now you need to send them somewhere. Here you can go in two ways.
- Use Flume features to provide metrics.
- Write your own metrics processing implementation.
Flume provides an API that allows you to specify a monitoring method - this uses the MonitorService interface implementations . In order to enable monitoring, you must specify the class that implements
MonitorServiceas a system property when the node starts (or in the code).java -Dflume.monitoring.type=org.apache.flume.instrumentation.http.HTTPMetricsServer ...System.setProperty("flume.monitoring.type", "org.apache.flume.instrumentation.http.HTTPMetricsServer");The class
HTTPMetricsServeroffers a standard way to monitor the state of a node. It is a small web server that, upon request, returns a complete list of node metrics in the form of JSON (as in the example above). To specify the port on which this server will listen for requests, just add a parameter to the Flume configuration (it uses port 41414 by default):flume.monitoring.port = 61509A request to the server looks like this:
localhost:61509/metrics. If this method of monitoring metrics is not enough, then you have to go the second way and write your own implementation
MonitorService. This is exactly what we did in order to monitor the state of our nodes using Graphite. The following is a simple example of such an implementation.FlumeGraphiteMonitor
package ru.dmp.flume.monitoring;
import com.google.common.base.CaseFormat;
import java.util.HashSet;
import java.util.Map;
import java.util.Set;
import org.apache.flume.Context;
import org.apache.flume.instrumentation.MonitorService;
import org.apache.flume.instrumentation.util.JMXPollUtil;
public class FlumeGraphiteMonitor implements MonitorService {
    // нормализованные имена метрик, которые не нужно отправлять в Graphite
    private static final Set EXCLUDED_METRICS = new HashSet() {{
       add("start-time");
       add("stop-time");
    }};
    private volatile long period = 60 * 1000;   // интервал отправки, 1 минута
    private volatile boolean switcher = true;
    private Thread scheduler = new Thread(this::schedule);
    @Override
    public void configure(Context context) {
         // Здесь можно достать какие-нибудь настройки из файла конфигурации
    }
    private void schedule() {
        while (switcher) {
            send();
            synchronized (this) {
                try {
                    wait(period);
                } catch (InterruptedException ex) {}
            }
        }
    }
    @Override
    public void start() {
        scheduler.start();
    }
    @Override
    public void stop() {
        switcher = false;
        synchronized (this) {
            notifyAll();
        }
        try {
            scheduler.join();
        } catch (InterruptedException ex) {}
    }
    private void send() {
        Map> metricsMap = JMXPollUtil.getAllMBeans();
        for (Map.Entry> e: metricsMap.entrySet()) {
            if (e.getValue() != null) {
                // все метрики от узлов Flume начинаем с префикса "flume"
                String group = "flume." + normalize(e.getKey().toLowerCase()) + ".";
                for (Map.Entry metric : e.getValue().entrySet()) {
                    try {
                        Double value = Double.valueOf(metric.getValue());
                        String metricName = normalize(metric.getKey());
                        if (!EXCLUDED_METRICS.contains(metricName)) {
                            String fullName = group + normalize(metric.getKey());
                            // Отправляем данные в графит или куда-то еще
                            // Graphite.send(metricName, value);
                        }
                    } catch (NumberFormatException ex) {
                        // так отсеиваем значения, не являющиеся числом
                    }
                }
            }
        }
    }
    // приводим к виду EventReceivedCount -> event-received-count (необязательно)
    private static String normalize(String str) {
        return CaseFormat.UPPER_CAMEL.to(CaseFormat.LOWER_UNDERSCORE, str).replaceAll("_", "-");
    }
As a result, we get a neat Graphite branch with all node metrics.
Below are descriptions of the graphs and metrics that we use for one of our services.
- The intensity of the service sending messages to the Flume site. The graph is not built according to node metrics - these values in Graphite send services that generate data and are the starting point of our transport system. If your data sources do not allow you to track the sending of data to Flume, then similar graphs can be taken from the source (s) of the node.
If the value in this graph drops to zero, then the client for some reason cannot send messages to Flume. To diagnose who is to blame for such situations, we separately display a graph of errors that occur on the client side. Accordingly, if it is nonzero - a problem on the Flume node, the source cannot receive data. If the drop in intensity does not lead to an increase in the number of errors, then the problem is on the service side, he stopped sending messages.
- Fullness of the node channels. With this graph, everything is simple - it should always be very close to zero. If the channel does not have time to empty, then somewhere in our transport network a bottleneck has arisen and it is necessary to look for nodes that do not have time to cope with the load. Chart metric:
flume.channel.{CHANNEL-NAME}.channel-fill-percentage
- The intensity of the node drains. The expected indicators of flows on this node are “how much they received, so much they were sent”, since events from services are not duplicated into channels. Thus, the rate of wastewater emptying should be the same as the rate at which customers send data. Metric on the graph: A
flume.sink.{SINK-NAME}.event-drain-success-count
drop in the intensity of any of the sinks to zero indicates a potential problem at the next receiving node. As a result, the channel emptied by the “broken” drain will begin to fill up. It is also possible that the receiving nodes work fine, but just do not have time to process the input data - in this case, the drain graphs will be non-zero, but the channels will gradually fill up.
Creating Your Own Flume Components
Despite the fact that the set of standard Flume components is quite extensive, quite often there are situations that cannot be resolved with these standard components. In this case, you can write your own Flume component and use it in nodes. You can write your own implementation for any of the Flume components - sink, source, channel, interceptor, etc.
The first thing that caught my eye when studying Flume drains was the lack of a flexible drain for the file system. Yes, there is a File-Roll Sink , the capabilities of which were described in the 2nd part of the cycle . But this stock is completely deprived of the ability to somehow influence the file name, which is not very convenient.
We decided to develop our own stock, which allows us to create files in the local file system. The development was guided by the following considerations.
- We have quite a few services with a relatively small load. This means that in the end we will have quite a lot of heterogeneous files - I would not want to configure a separate sink for each of them.
- Files must rotate in time. Moreover, for different data, the rotation period may differ (by rotation we mean “slicing data” into files by time - 15 minutes, an hour, etc.).
- Data from each service should be stored in a separate folder. Moreover, one service can generate data for several subfolders.
Based on these theses, we came to the conclusion that it is better to leave the task of generating the file name to the client (that is, the services generating the data), otherwise the runoff configuration will be too cumbersome, and for each new “client” you will have to add a separate runoff with individual settings .
Note . A comparison with the HDFS drain, which we talked about in a previous article, is appropriate here. This stock allows for very fine-tuning of rotation and file naming. But this configuration flexibility has a downside - for example, for files rotating once every 15 and once every 30 minutes, you have to make different drains, even if the parameters are identical in everything else.
Total, the decision on the functionality of the file drain was made as follows:
- The name of the file in which the data should be written is determined by the client and passes it in the header along with the event.
- The file name may contain subfolders.
- Files recorded by the drain are closed at a certain timeout when events for them cease to come.
Schematically, the data processing process by this sink looks like this:
What did this result in:
- No need to add stock for each new service or data type.
- The drain does not have the cost of generating a file name (in the previous part we examined these costs using the example of an HDFS drain)
- Since the file name is uniquely identified by one heading, we can use the client-side event grouping (this technique is also described in the second part of the cycle).
The source code of the file drain and an example of its configuration are uploaded to GitHub . I’ll make no detailed analysis of the development process of this stock, I think it makes no sense, I will limit myself to a few points:
- The component is based on either an abstract class or the component interface (depending on what you are developing - a stock, an interceptor, or something else).
- We make our own implementation - the easiest way is to take one of the ready-made Flume components as an example, since all sources are available.
- When configuring, we specify not the reserved alias of the component (such as 'avro' or 'logger'), but the entire class name.
We design a transport network
We examined the general data management techniques in the previous parts of the cycle - events can be divided between nodes, duplicated, selected “direction of movement” using headers, etc. Let us now try to use all these techniques in order to build a reliable transport network. Suppose the task is as follows.
- A data provider is a service running on several machines (it has several identical instances).
- The data generated by the service is heterogeneous - some of them need to be delivered to HDFS, some to the file system on a certain log server.
- It is necessary to conduct some non-atomic calculations related to data in real time.
On condition 3 I will dwell in more detail. Suppose that the task is to count the unique users of the site in the last hour. In this case, we cannot afford to parallelize the data stream from the machines or calculate this value separately on each web service - it is necessary to count unique users by their cookies on a single data stream from all machines. Otherwise, each instance will have its own set of unique users that cannot be "taken and folded" to obtain the final result.
Note . Of course, the example is a little far-fetched - this problem can be solved in other, more effective ways. The essence of the example comes down to the situation when you need to pass a certain data stream centrally through one processor and it is impossible to share the load due to the nature of the task.
So, for starters, prepare the client and end nodes:
For each of the web services we put our own, individual node - on the same machine as the web service. This is done for the following reasons:
- These nodes play the role of a buffer - if, for some reason, the delivery of events to other machines becomes impossible, these nodes will allow some time to “hold out” without data loss due to the thick file channel.
- Reduces response time. Of course, sending data to Flume should be performed asynchronously - but during peak loads or a clogged network, a situation may arise when the background thread does not have time to send new events. In this case, the queue for sending can grow greatly, mercilessly consuming the memory of the service, which is not very good. When the node is located on the same machine as the service, these costs are significantly reduced.
- If the further logic of data processing changes and you decide to rebuild the transport network, then the changes will need to be made only in the configuration of the client node, not the web service. For him, everything will remain the same - "I am sending data to my node, then let him decide how to be."
The question remains - how to deliver data so that nothing is lost if something breaks? We have already taken a number of measures - data for HDFS and for FS are written on several machines. At the same time, the data is not duplicated, but divided. Thus, if one of the final machines fails, the entire load will go to the survivor. The result of such a breakdown will be an imbalance in the recorded data volume on various machines, but you can live with it.
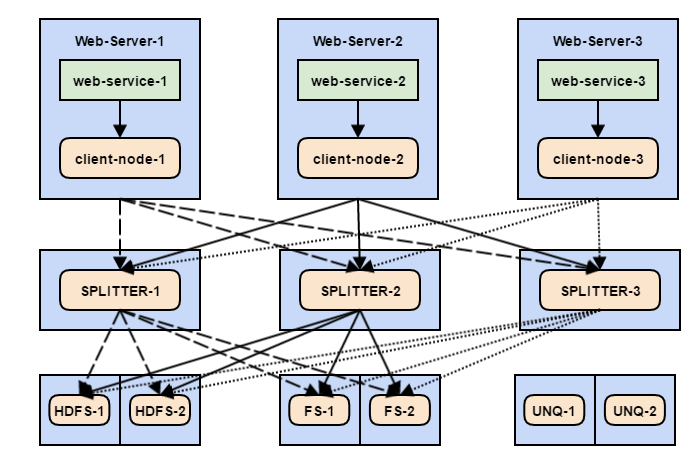
To provide greater stability, add a few intermediate nodes Flume, which will deal directly with the distribution of data:
The result was a rather creepy web. What's going on here:
- The web service sends events to the client node.
- Each event has a header that indicates “destination” (for example, dist = FS or dist = HDFS ), as well as an uniq header with possible values of 1 or 0.
- Each client node has 3 sinks that equally empty the channel and evenly distribute events between the three intermediate nodes - Splitters (so far, without regard to the dist header ).
- Each Splitter has several channels - for HDFS, FS and a unique user counter. The required channel is selected by dist and uniq headers .
- Each of these channels on Splitter has several sinks that evenly distribute events between end machines (FS, HDFS or UNQ).
If everything is relatively simple with client nodes - they simply share events between Splitters, then the structure of an individual Splitter should be considered in more detail.
Here you can see that the endpoint for the data is defined using the dist header . At the same time, the events by which unique users are considered do not depend on the dist header - they focus on the uniq header . This means that some events can be duplicated in several channels, for example HDFS and UNQ.
Earlier, I did not specifically indicate the direction from Splitters to UNQ nodes. The fact is that these nodes do not accept distributed data, like HDFS or FS. Given the specifics of the task of counting unique users, the entire data stream must go through only onea car. The logical question is - why do we need 2 nodes for counting unique users? The answer is because if one node breaks, there will be no one to replace it. What can we do here - we cannot divide events between nodes, leaving one alone is also impossible?
Here, another Flume tool can help us, allowing us to work the drains in the group according to the principle “If runoff 1 is broken, use runoff 2”. This component is called the Failover Sink Processor . Its configuration is as follows:
# Сами по себе стоки описываются как обычно
agent.sinks.sink-unq-1.type = avro
agent.sinks.sink-unq-1.batch-size = 5000
agent.sinks.sink-unq-1.channel = memchannel
agent.sinks.sink-unq-1.hostname = unq-counter-1.my-company.com
agent.sinks.sink-unq-1.port = 50001
agent.sinks.sink-unq-2.type = avro
agent.sinks.sink-unq-2.batch-size = 5000
agent.sinks.sink-unq-2.channel = memchannel
agent.sinks.sink-unq-2.hostname = unq-counter-2.my-company.com
agent.sinks.sink-unq-2.port = 50001
# Объединяем их в группу
agent.sinkgroups = failover-group
agent.sinkgroups.failover-group.sinks = sink-unq-1 sink-unq-2
# Тип процессинга указываем как failover
agent.sinkgroups.failover-group.processor.type = failover
# Приоритеты для стоков - сток с высоким значением будет задействован первым
agent.sinkgroups.failover-group.processor.priority.sink-unq-1 = 10
agent.sinkgroups.failover-group.processor.priority.sink-unq-2 = 1
# Как часто проверять - вернулся ли сток в строй (мс)
agent.sinkgroups.failover-group.processor.maxpenalty = 10000
The above setting of the group of flows allows you to use only one drain, but at the same time have a "backup" in case of an accident. Those. as long as the high priority runoff works properly, the low priority runoff will be idle.
Thus, the task has been completed - the data is distributed between HDFS and FS, the counters of unique users work correctly. In this case, the failure of any machine will not lead to data loss:
- If a machine with a Web service breaks down, then this problem is solved by the balancer.
- If one of the Splitters fails, the load will be distributed among the others.
- The end nodes are also duplicated, failure of one of them will not lead to stagnation or loss of data.
- The node for counting unique users has an “understudy” and in case of failure it will be replaced by it without violating the data processing logic.
For such a scheme, scaling tasks come down to a simple change in the configuration of Flume nodes for the corresponding node level (Client, Splitter, or Final):
- New Web service instance - no configuration changes are required; it is simply installed with the Flume client node.
- New Splitter - you only need to change the configuration of client nodes by adding a new stock.
- New end node - you only need to change the configuration of Splitter, adding a new stock.
Conclusion
This concludes our series of articles about Apache Flume. We covered all its most popular components, figured out how to control the flow of data, and examined an example of a full-fledged transport network. Nevertheless, the possibilities of Flume are not limited to all of this - in the standard package there are still quite a few components that we have not considered, which can greatly facilitate life in solving certain problems. We hope that this series of articles has helped you get acquainted with Flume and get a fairly complete picture of it.
Thanks for attention!