Go way: how garbage collection accelerated
- Transfer
Twitch's Go language is used on many busy systems. Simplicity, security, performance and readability make it a good tool to solve problems that services face, for example, when streaming video and servicing the correspondence of millions of users.
But this article is not yet another glorification of Go. It is about how our use of this language pushes some boundaries of the current runtime implementation and how we react to reaching these boundaries.
This is a story about how improving the runtime from Go 1.4 to Go 1.6 gave us a 20-fold decrease in pauses during the work of the garbage collector, how we got another 10-fold decrease in pauses in Go 1.6 and how, transferring our experience to the development team working over runtime'om Go, provided 10-fold acceleration in Go 1.7 without additional manual settings on our part.
Our IRC-based chat system was first implemented on Go at the end of 2013. It replaced the previous implementation in Python. To create it, we used pre-release versions of Go 1.2, and the system was able to simultaneously serve up to 500,000 users from each physical host without any special tricks.
When servicing each connection with a group of three goroutines (lightweight execution threads in Go), the program utilized 1,500,000 goroutines per process. And even with so many of them, the only serious performance problem that we encountered in versions prior to Go 1.2 was the length of pauses for garbage collection. The application stopped for tens of seconds each time the collector was launched, and this was unacceptable for our interactive chat service.
Not only was each pause for garbage collection very expensive, but the assembly was launched several times per minute. We spent a lot of effort on reducing the number and size of allocated memory blocks, so that the collector runs less frequently. It was a victory for us to increase the heap by only 50% every two minutes. And although there were fewer pauses, they remained very long.
After the release of Go 1.2, pauses were reduced “only” to a few seconds. We distributed traffic to more processes, which allowed us to reduce the duration of pauses to a more comfortable value.
Work on reducing memory allocation on our chat server continues to be beneficial even now, despite the development of Go, but splitting into several processes is a workaround for certain versions of Go only. Such tricks do not stand the test of time, but are important for solving the short-term tasks of providing quality service. And if we share with each other the experience of using workarounds, this will help to make improvements in Go runtime that will benefit the whole community, and not just one program.
Starting with Go 1.5 in August 2015, the Go garbage collector began to work for the most part competitively and incrementally. This means that almost all work is performed without a complete stop of the application. In addition to the fact that the preparation and interruption phases are quite short, our program continues to work while the garbage collection process is already underway. Switching to Go 1.5 instantly led to a 10-fold reduction in pauses in our chat system: under heavy load in the test environment from two seconds to approximately 200 ms.
Although reducing latency in Go 1.5 in itself was a celebration for us, the best feature of the new garbage collector was that it set the stage for further consistent improvements.
Garbage collection in Go 1.5 still consists of two main phases:
But each of these phases now consists of two stages:
The runtime function
Of course, we needed to collect more details about the work of the collector during pauses. Core packages at Go include a great user-level CPU profiler, but for our task we used the perf tool from Linux. While in the core, it allows you to receive samples with a higher frequency and visibility. Monitoring cycles in the kernel can help us debug slow system calls and make virtual memory management transparent.
The following is a partial profile of our chat server running Go 1.5.1. The graph (Flame Graph) is built using the tool of Brendan Gregg . Only those samples are included, the stack of which has a function
The peaks in the graph indicate an increase in stack depth, and the width of each section reflects the CPU runtime. Do not pay attention to the colors and order on the X axis, they do not matter. On the left side of the graph, we see that in almost every sample stack it
The function is
Go to
It seemed to us that it was worthy to be upset by the Go team. We wrote to the developers, and they helped us a lot with their advice on how to diagnose performance problems and how to isolate them in minimal test cases. In Go 1.6, developers moved the finalizer scan to the parallel mark phase, which reduced the pause in applications with a large number of TCP connections. Many other improvements were made, as a result, when switching to Go 1.6, pauses on our chat server decreased by half compared to Go 1.5 - up to 100 ms. Progress!
The concurrency approach adopted by Go implies the low cost of using a large amount of goroutine. If an application that uses 10,000 OS threads can run slowly, for goroutines this amount is in order. Unlike traditional large fixed-size stacks, goroutines start with a very small stack — just 2 KB — which grows as needed. At the beginning of a function call, Go checks to see if the stack size is sufficient for the next call. And if not, then before continuing the call, the goroutine stack moves to a larger memory area, with rewriting of pointers if necessary.
Therefore, as the application runs, the goroutine stacks increase to fulfill the deepest calls. The task of the garbage collector is to return unused memory. For moving goroutine stacks to more suitable memory areas, a function is responsible
This chart is recorded on the release version 1.6 of October 2015.
The Go runtime package documentation explains how to disable stack reduction. For our chat server, the loss of some memory is a small fee for reducing pauses in garbage collection. We did so by switching to Go 1.6. After disabling stack reduction, the duration of pauses decreased to 30–70 ms, depending on the “wind direction”.
The structure and operation scheme of our chat server did not change much, but from multi-second pauses in Go 1.2 we reached 200 ms in Go 1.5, and then up to 100 ms in Go 1.6. In the end, most pauses became shorter than 70 ms, that is, we got an improvement of more than 30 times.
But surely there must be potential for further improvement. It's time to take your profile again!
Up to this point, the spread in the duration of pauses was small. But now they began to change over a wide range (from 30 to 70 ms), without correlating with any results
When the garbage collector calls
Function
Hint may be hidden in our equipment. For the chat system, we use modern dual-processor servers. Each socket is directly connected to several memory banks. This configuration allows for uneven memory access (NUMA, Non-Uniform Memory Access). When a thread runs in the core of socket 0, it has faster access to the memory connected to this socket than to the rest of the memory. The Linux kernel tries to reduce this difference by launching threads on the kernel to which the memory they use is connected, and moving pages of physical memory “closer” to the corresponding threads.
Given this scheme, let's take a closer look at the behavior of the kernel function
The Linux kernel picked up almost meaningless memory access patterns during the interruption of the mark phase and because of them transfers memory pages, which costs us a lot. This behavior showed up very weakly on the Go 1.5.1 chart, but when we turned our attention to it
Here, the benefits of profiling with perf are most apparent. This tool can show kernel stacks, while a user-level Go profiler would only show that Go functions are inexplicably slow. Perf is much more difficult to use, it requires root access to view kernel stacks and in Go 1.5 and 1.6 requires the use of a non-standard toolchain (GOEXPERIMENT = framepointer ./make.bash, in Go 1.7 it will be standard). But solving the problems described is worth the effort.
If using two sockets and two memory banks is difficult, let's reduce the number. It’s best to take advantage of a command
After binding to a single NUMA node, the duration of the interruption of the mark phase decreased to 10-15 ms. Significant improvement over 200 ms in Go 1.5 or two seconds in Go 1.4. The same result can be obtained without sacrificing half the server. It is enough to use
Up to Go 1.6, we turned off the stack reduction feature. This had a minimal impact on memory usage by our chat server, but significantly increased operational complexity. For some applications, stack reduction plays a very large role, so we turned off this feature very selectively. In Go 1.7, the stack is now reduced right while the application is running. So we got all the best of the two worlds: low memory consumption without special settings.
Since the advent of a parallel-running garbage collector in Go 1.5, runtime keeps track of whether every goroutine has been running since its last scan. During the interruption of the mark phase, goroutins that were recently performed are again detected and are scanned. In Go 1.7, runtime supports a hotel short list of such goroutines. This allows you to no longer search the entire list of goroutines when the code is paused, and greatly reduces the number of memory accesses that can trigger memory migration in accordance with NUMA algorithms.
Finally, compilers for the AMD64 architecture support frame pointers by default, so standard debugging and performance tools like perf can determine the current function call stack. Users who create their applications using the Go packages prepared for their platform will be able to select more advanced tools if necessary without studying the procedure for rebuilding the toolchain and rebuild / redeploy their applications. This promises a good future in terms of further improvements in the performance of the main packages and Go runtime, when engineers like me and you can collect enough information for high-quality reports.
In the pre-release version of Go 1.7 from June 2016, pauses for garbage collection became even smaller, and without any additional tricks. At our server, they “out of the box” approached 1 ms - ten times less compared to the configured Go 1.6 configuration!
Our experience has helped the Go development team find a permanent solution to the problems we encountered. For applications like ours, when switching from Go 1.5 to 1.6, profiling and tuning allowed ten-fold pause reduction. But in Go 1.7, developers were able to achieve a 100-fold difference compared to Go 1.5. Hats off before their efforts to improve runtime's performance.
All this analysis is dedicated to the curse of our chat server - pauses in work, but this is only one measurement of the performance of the garbage collector. By resolving the pause problem, Go developers can now tackle the bandwidth problem.
According to the description of the Transaction Oriented Collector , it uses the approach of transparent, inexpensive allocation and assembly of memory, which is not shared by goroutines. This will delay the need for a full run collector and reduces the total number of CPU cycles for garbage collection.
This is a story about how improving the runtime from Go 1.4 to Go 1.6 gave us a 20-fold decrease in pauses during the work of the garbage collector, how we got another 10-fold decrease in pauses in Go 1.6 and how, transferring our experience to the development team working over runtime'om Go, provided 10-fold acceleration in Go 1.7 without additional manual settings on our part.
Beginning of the garbage collection pause saga
Our IRC-based chat system was first implemented on Go at the end of 2013. It replaced the previous implementation in Python. To create it, we used pre-release versions of Go 1.2, and the system was able to simultaneously serve up to 500,000 users from each physical host without any special tricks.
When servicing each connection with a group of three goroutines (lightweight execution threads in Go), the program utilized 1,500,000 goroutines per process. And even with so many of them, the only serious performance problem that we encountered in versions prior to Go 1.2 was the length of pauses for garbage collection. The application stopped for tens of seconds each time the collector was launched, and this was unacceptable for our interactive chat service.
Not only was each pause for garbage collection very expensive, but the assembly was launched several times per minute. We spent a lot of effort on reducing the number and size of allocated memory blocks, so that the collector runs less frequently. It was a victory for us to increase the heap by only 50% every two minutes. And although there were fewer pauses, they remained very long.
After the release of Go 1.2, pauses were reduced “only” to a few seconds. We distributed traffic to more processes, which allowed us to reduce the duration of pauses to a more comfortable value.
Work on reducing memory allocation on our chat server continues to be beneficial even now, despite the development of Go, but splitting into several processes is a workaround for certain versions of Go only. Such tricks do not stand the test of time, but are important for solving the short-term tasks of providing quality service. And if we share with each other the experience of using workarounds, this will help to make improvements in Go runtime that will benefit the whole community, and not just one program.
Starting with Go 1.5 in August 2015, the Go garbage collector began to work for the most part competitively and incrementally. This means that almost all work is performed without a complete stop of the application. In addition to the fact that the preparation and interruption phases are quite short, our program continues to work while the garbage collection process is already underway. Switching to Go 1.5 instantly led to a 10-fold reduction in pauses in our chat system: under heavy load in the test environment from two seconds to approximately 200 ms.
Go 1.5 - the new era of garbage collection
Although reducing latency in Go 1.5 in itself was a celebration for us, the best feature of the new garbage collector was that it set the stage for further consistent improvements.
Garbage collection in Go 1.5 still consists of two main phases:
- Mark - at first those sections of memory which are still in use are marked;
- Sweep - all unused areas are prepared for reuse.
But each of these phases now consists of two stages:
- Mark:
- the application pauses, waiting for the completion of the previous sweep phase;
- then, simultaneously with the application, a search for used memory blocks is performed.
- Sweep:
- the application is paused again to interrupt the mark phase;
- simultaneously with the application, unused memory is gradually being prepared for reuse.
The runtime function
gctraceallows you to display information with the results for each iteration of the garbage collection, including the duration of all phases. For our chat server, she showed that most of the pause falls on the interruption of the mark phase, so we decided to focus on this. Although the Go development team responsible for runtime requested bug reports from applications that have long pauses in garbage collection, we were slobs and kept it a secret! Of course, we needed to collect more details about the work of the collector during pauses. Core packages at Go include a great user-level CPU profiler, but for our task we used the perf tool from Linux. While in the core, it allows you to receive samples with a higher frequency and visibility. Monitoring cycles in the kernel can help us debug slow system calls and make virtual memory management transparent.
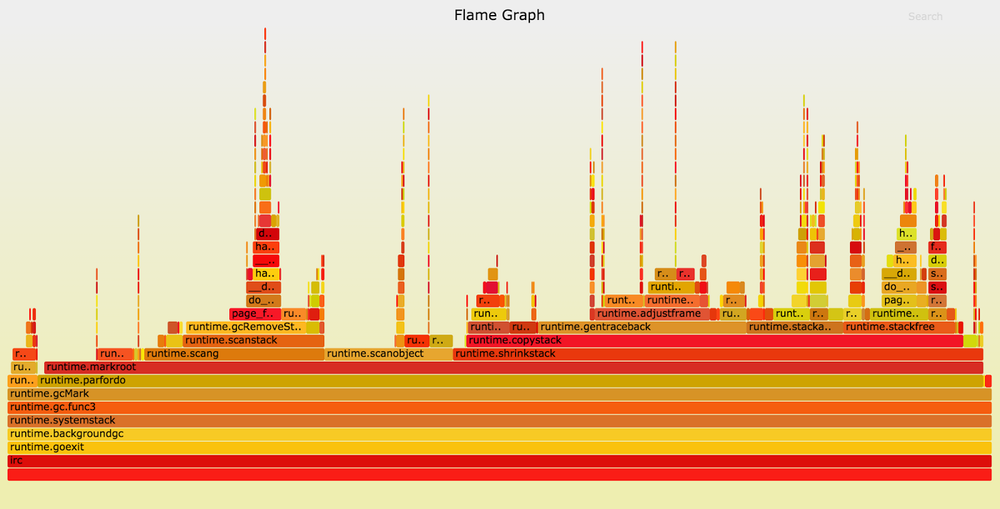
The following is a partial profile of our chat server running Go 1.5.1. The graph (Flame Graph) is built using the tool of Brendan Gregg . Only those samples are included, the stack of which has a function
runtime.gcMark, which in Go 1.5 approximates the time spent interrupting the mark phase.The peaks in the graph indicate an increase in stack depth, and the width of each section reflects the CPU runtime. Do not pay attention to the colors and order on the X axis, they do not matter. On the left side of the graph, we see that in almost every sample stack it
runtime.gcMarkcalls runtime.parfordo. Looking above, we notice that most of the time is occupied by the runtime.markrootcalls made runtime.scang, runtime.scanobjectand runtime.shrinkstack. The function is
runtime.scangdesigned to rescan the memory to help complete the mark phase. The essence of the interruption is to finish scanning the application memory, so this work is absolutely necessary. Better think of how to improve the performance of other functions. Go to
runtime.scanobject. This function has several tasks, but its execution during the interruption of the mark-phase in Go 1.5 is necessary for the implementation of finalizers (the function that is performed before the object is removed by the garbage collector. - Note. Translator). You may ask: “Why does the program use so many finalizers that they significantly affect the duration of pauses during garbage collection?” In this case, the application is a chat server that processes messages from hundreds of thousands of users. The main “network” packet in Go attaches a finalizer to each TCP connection to help manage file descriptor leaks. And since each user receives their own TCP connection, this makes a small contribution to the duration of the interruption of the mark phase.It seemed to us that it was worthy to be upset by the Go team. We wrote to the developers, and they helped us a lot with their advice on how to diagnose performance problems and how to isolate them in minimal test cases. In Go 1.6, developers moved the finalizer scan to the parallel mark phase, which reduced the pause in applications with a large number of TCP connections. Many other improvements were made, as a result, when switching to Go 1.6, pauses on our chat server decreased by half compared to Go 1.5 - up to 100 ms. Progress!
Stack reduction
The concurrency approach adopted by Go implies the low cost of using a large amount of goroutine. If an application that uses 10,000 OS threads can run slowly, for goroutines this amount is in order. Unlike traditional large fixed-size stacks, goroutines start with a very small stack — just 2 KB — which grows as needed. At the beginning of a function call, Go checks to see if the stack size is sufficient for the next call. And if not, then before continuing the call, the goroutine stack moves to a larger memory area, with rewriting of pointers if necessary.
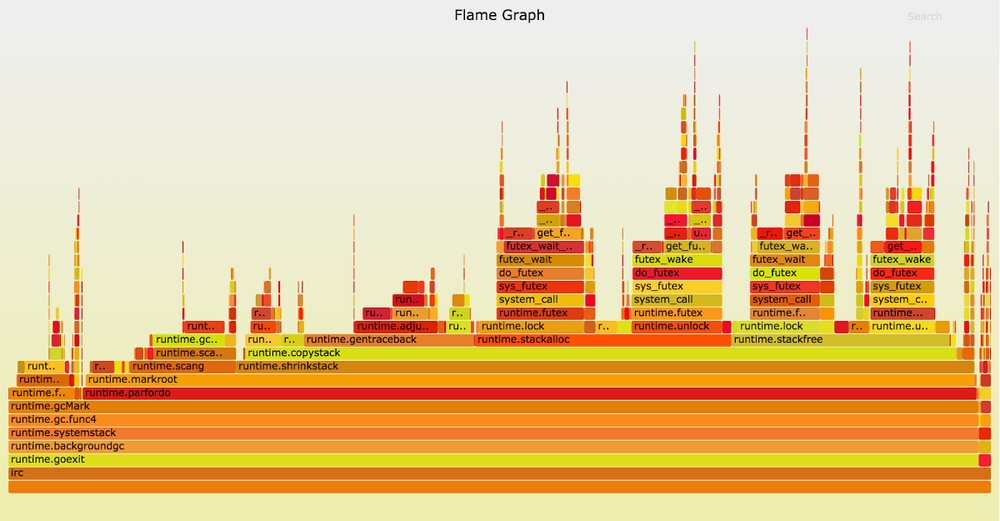
Therefore, as the application runs, the goroutine stacks increase to fulfill the deepest calls. The task of the garbage collector is to return unused memory. For moving goroutine stacks to more suitable memory areas, a function is responsible
runtime.shrinkstackthat in Go 1.5 and 1.6 is executed during the interruption of the mark phase, when the application is paused. This chart is recorded on the release version 1.6 of October 2015.
runtime.shrinkstacktakes about three quarters of samples. If this function was performed while the application was running, then we would get a serious reduction in pauses on our chat server and other similar applications.The Go runtime package documentation explains how to disable stack reduction. For our chat server, the loss of some memory is a small fee for reducing pauses in garbage collection. We did so by switching to Go 1.6. After disabling stack reduction, the duration of pauses decreased to 30–70 ms, depending on the “wind direction”.
The structure and operation scheme of our chat server did not change much, but from multi-second pauses in Go 1.2 we reached 200 ms in Go 1.5, and then up to 100 ms in Go 1.6. In the end, most pauses became shorter than 70 ms, that is, we got an improvement of more than 30 times.
But surely there must be potential for further improvement. It's time to take your profile again!
Page faults ?!
Up to this point, the spread in the duration of pauses was small. But now they began to change over a wide range (from 30 to 70 ms), without correlating with any results
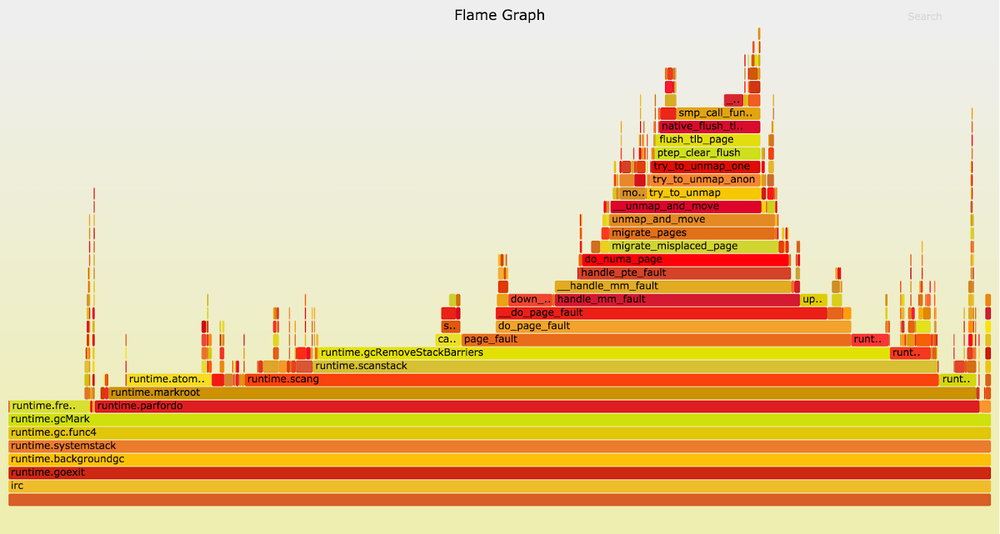
gctrace. Here is a graph of cycles during fairly long pauses of interruption of the mark phase: When the garbage collector calls
runtime.gcRemoveStackBarriers, the system generates a page fault error, which leads to a kernel function call page_fault. This reflects the wide “tower” to the right of the center of the chart. Using page faults, the kernel distributes pages of virtual memory (usually 4 KB in size) in physical memory. Often processes can allocate huge amounts of virtual memory, which is converted to resident when the application is accessed only through page faults. Function
runtime.gcRemoveStackBarriersconverts the stack memory that the application recently accessed. In fact, it is designed to remove “stack barriers” added some time before at the beginning of the garbage collection cycle. The system has enough memory available, it does not assign physical memory to some other, more active processes. So why does accessing it lead to errors?Hint may be hidden in our equipment. For the chat system, we use modern dual-processor servers. Each socket is directly connected to several memory banks. This configuration allows for uneven memory access (NUMA, Non-Uniform Memory Access). When a thread runs in the core of socket 0, it has faster access to the memory connected to this socket than to the rest of the memory. The Linux kernel tries to reduce this difference by launching threads on the kernel to which the memory they use is connected, and moving pages of physical memory “closer” to the corresponding threads.
Given this scheme, let's take a closer look at the behavior of the kernel function
page_fault. If you look at the call stack (above in the graph), you will see that the kernel is callingdo_numa_page and migrate_misplaced_page. This means that the kernel moves application memory between banks of physical memory. The Linux kernel picked up almost meaningless memory access patterns during the interruption of the mark phase and because of them transfers memory pages, which costs us a lot. This behavior showed up very weakly on the Go 1.5.1 chart, but when we turned our attention to it
runtime.gcRemoveStackBarriers, it became much more noticeable.Here, the benefits of profiling with perf are most apparent. This tool can show kernel stacks, while a user-level Go profiler would only show that Go functions are inexplicably slow. Perf is much more difficult to use, it requires root access to view kernel stacks and in Go 1.5 and 1.6 requires the use of a non-standard toolchain (GOEXPERIMENT = framepointer ./make.bash, in Go 1.7 it will be standard). But solving the problems described is worth the effort.
Migration management
If using two sockets and two memory banks is difficult, let's reduce the number. It’s best to take advantage of a command
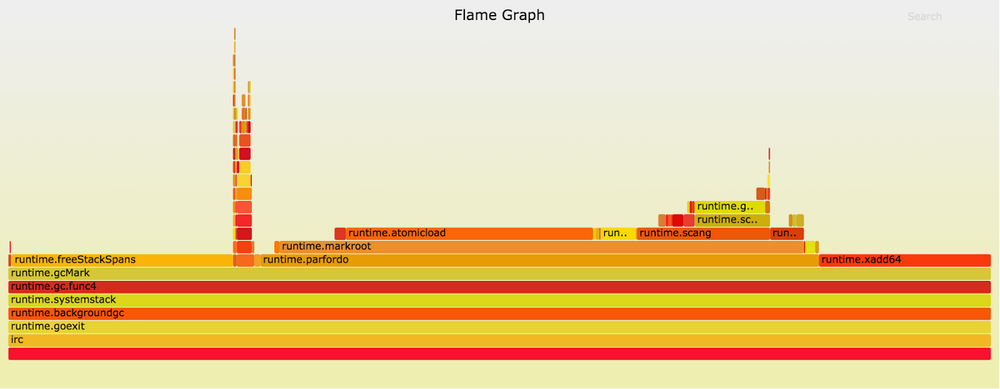
tasksetthat can make an application run on the kernels of only one socket. Since program threads access memory from a single socket, the kernel will move their data to the corresponding banks. After binding to a single NUMA node, the duration of the interruption of the mark phase decreased to 10-15 ms. Significant improvement over 200 ms in Go 1.5 or two seconds in Go 1.4. The same result can be obtained without sacrificing half the server. It is enough to use
set_mempolicy(2)or mbind(2)to assign a memory policy to a processMPOL_BIND. The above profile was obtained on the pre-release version of Go 1.6 in October 2015. The left side shows that the execution runtime.freeStackSpanstakes a lot of time. After this function has been transferred to the parallel phase of garbage collection, it no longer affects the duration of the pause. Little can now be removed from the interruption phase of the mark phase!Go 1.7
Up to Go 1.6, we turned off the stack reduction feature. This had a minimal impact on memory usage by our chat server, but significantly increased operational complexity. For some applications, stack reduction plays a very large role, so we turned off this feature very selectively. In Go 1.7, the stack is now reduced right while the application is running. So we got all the best of the two worlds: low memory consumption without special settings.
Since the advent of a parallel-running garbage collector in Go 1.5, runtime keeps track of whether every goroutine has been running since its last scan. During the interruption of the mark phase, goroutins that were recently performed are again detected and are scanned. In Go 1.7, runtime supports a hotel short list of such goroutines. This allows you to no longer search the entire list of goroutines when the code is paused, and greatly reduces the number of memory accesses that can trigger memory migration in accordance with NUMA algorithms.
Finally, compilers for the AMD64 architecture support frame pointers by default, so standard debugging and performance tools like perf can determine the current function call stack. Users who create their applications using the Go packages prepared for their platform will be able to select more advanced tools if necessary without studying the procedure for rebuilding the toolchain and rebuild / redeploy their applications. This promises a good future in terms of further improvements in the performance of the main packages and Go runtime, when engineers like me and you can collect enough information for high-quality reports.
In the pre-release version of Go 1.7 from June 2016, pauses for garbage collection became even smaller, and without any additional tricks. At our server, they “out of the box” approached 1 ms - ten times less compared to the configured Go 1.6 configuration!
Our experience has helped the Go development team find a permanent solution to the problems we encountered. For applications like ours, when switching from Go 1.5 to 1.6, profiling and tuning allowed ten-fold pause reduction. But in Go 1.7, developers were able to achieve a 100-fold difference compared to Go 1.5. Hats off before their efforts to improve runtime's performance.
What's next
All this analysis is dedicated to the curse of our chat server - pauses in work, but this is only one measurement of the performance of the garbage collector. By resolving the pause problem, Go developers can now tackle the bandwidth problem.
According to the description of the Transaction Oriented Collector , it uses the approach of transparent, inexpensive allocation and assembly of memory, which is not shared by goroutines. This will delay the need for a full run collector and reduces the total number of CPU cycles for garbage collection.