As we wrote the application on the NASA Space Apps Challenge hackathon

Our team “Space Monkeys”, which included Oleg Borodin (Front-end developer at Singularis lab), Vladislav Plotnikov (QA engineer at Singularis lab), Yegor Shvetsov, Dmitry Petrov, Yuri Bederov and Nikolai Denisenko, chose to solve the problem under catchy titled “Spot that fire!”, which is worded as follows: “ Apply crowdsourcing so that people can contribute to the detection, confirmation and tracking of forest fires. The solution can be a mobile or web application. ”
Due to the fact that the team gathered 5 developers with development experience for various platforms, it was immediately decided that the prototype of our application would be implemented under the Web and Mobile platform.
What NASA data did we use?
Still, the hackathon was conducted under the auspices of the National Aeronautics and Space Administration, so it would be wrong not to use open data from NASA storerooms. In addition, we immediately found the Active Fire Data data we need . This dataset contains information about the coordinates of fires around the world (you can download information on a specific continent). Data is updated every day (you can get data for 24 hours, 48 hours, 7 days).
The file contains information on the following fields: latitude, longitude, brightness, scan, track, acq_date, acq_time, satellite, confidence, version, bright_t31, frp, daynight, of which we used only the coordinates of the fire points (latitude and longitude).
The principle of the application
Since the application is crowdsourced, then ideally it should be used by a large number of users. The principle of the application is as follows:
The user, having found a fire, photographs it (with a geotagging) and loads it using the service. Photos with geotagging and sending coordinates go to the application server. The photo can be downloaded from the Web or Mobile version of the application.
The resulting photo is processed on the server by a trained neural network to confirm that the photo is really fire. The result of the script execution is the prediction accuracy, if> 0.7, then the photo is really fire. Otherwise, we do not fix this information and ask the user to upload another photo.
If the image analysis script gave a positive result, the coordinates from the geo-tag are added to the dataset with all coordinates. Further, the distances between the i -th point from NASA dataset and the point from the user are calculated . If the distance between the points is ≤ 3 km, then the point from the NASA set is added to the dictionary. So go through all the points. After that, on the client side of the application we return json with coordinates that satisfy the condition. If the coordinates are not found by the given condition, then we return back the single point that we received from the user.
If the server returns an array of points, then the client part of the application draws a fire zone on the map. In the case when the server returned one point, it is marked on the map with a special label.
Used technology stack
Front-end part of a web application
The web application accessible from the browser was oriented to computer screens and was not adaptive, however, the technologies used easily made it possible to refine this aspect for mobile devices. We used the following technology stack on the web side:
- Angular 6 framework from Google in TypeScript
- CSS & JS framework Materialize
- ng2-file-upload file upload module
- OpenStreetMap maps , Leaflet library
Work scenario
The user opens the application and sees its location:
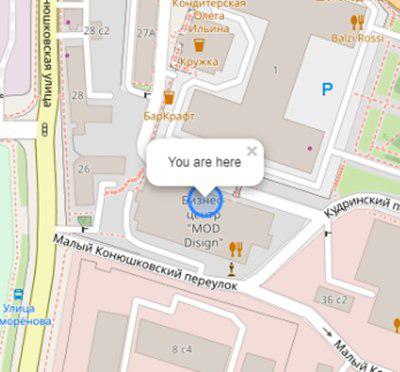
Initialization of user’s map and geotagging:
this.map = L.map('map').setView([latitude, longitude], 17);
L.tileLayer('https://{s}.tile.openstreetmap.org/{z}/{x}/{y}.png', {
        attribution: '& copy; <a href="https://www.openstreetmap.org/copyright">OpenStreetMap</a> contributors'
      }).addTo(this.map);
L.circle([latitude, longitude]).addTo(this.map)
        .bindPopup('You are here')
        .openPopup();
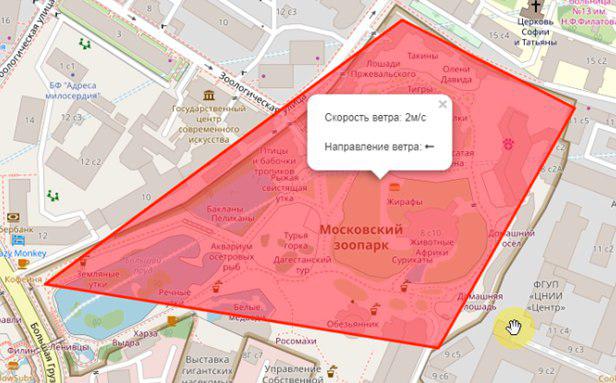
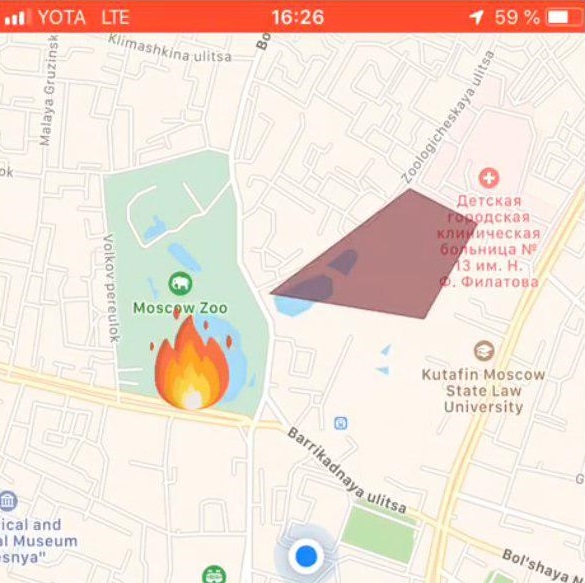
If there is a fire within a radius of n (adjustable variable) kilometers, it will be displayed as a polygon with a summary of additional information:
The user selects the location of the fire on the map:
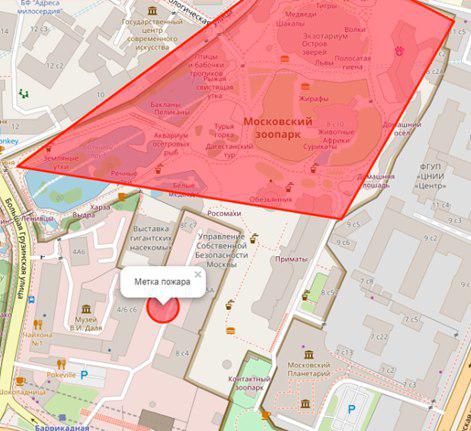
Setting the fire mark:
let marker;
this.map.on('click', function (e) {
       if (marker) {
          self.map.removeLayer(marker);
        }
        marker = L.circle([e.latlng.lat, e.latlng.lng], {
          color: 'red',
          fillColor: '#f03',
          fillOpacity: 0.5,
          radius: 15
        }).addTo(self.map)
          .bindPopup('Метка пожара')
          .openPopup();
        self.appService.coordinatesStorage.latitude = e.latlng.lat;
        self.appService.coordinatesStorage.longitude = e.latlng.lng;
        console.log('fire', self.appService.coordinatesStorage);
      });
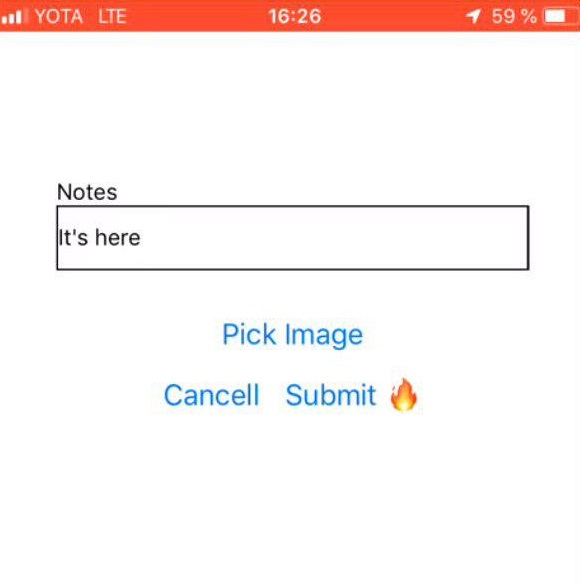
Next, the user uploads a photo of the fire using ng2-file-upload .
As a result of these actions, the following data is transmitted to the server:
- user coordinates
- coordinates of the specified fire
- fire photo
The output of the application is the result of recognition.
Mobile-app apps
Used technologies
- React native - framework for developing cross-platform applications for iOS and Android
- Redux - flow control in applications
- Redux-saga - a library that uses side effects in Redux
Work scenario
Choosing a photo of fire | User comment | Label for fire |

Back-end part of the application
Programming language - JAVA 8
Cloud Platform - Microsoft Azure
Web application framework - Play Framework
Object-relational mapping - Ebean framework
The server has 2 scripts written in Python: predict.py and getZone.py, the following Python libraries have been installed for their work:
- pandas - for processing and analyzing data
- geopandas - for work with geodata
- numpy - for working with multidimensional arrays
- matplotlib - for visualizing two-dimensional (2D) graphics data (3D graphics are also supported)
- shapely - for manipulating and analyzing flat geometric objects.
Server API: fire.iconx.app/api
- loading coordinates
post /pictures {}
return { id }
- loading pictures
post /pictures/:id
Script predict.py
The input script received a picture, a simple preprocessing of the picture took place (more about it in the “Model Training” block) and based on the saved file with weights, which is also on the server, a prediction was issued. If the model has given an accuracy of> 0.7, then the fire is fixed, otherwise - no.
The script runs in the classic way.
$ python predict.py image.jpg import keras
import sys
from keras.layers import Dense
from keras.models import model_from_json
from sklearn.externals import joblib
from PIL import Image
import numpy as np
from keras import models, layers, optimizers
from keras.applications import MobileNet
from keras.models import Sequential
from keras.layers import Dense, Dropout, Flatten
from keras.layers import Conv2D, MaxPooling2D
def crop_resize(img_path, img_size_square):
# Get dimensions
mysize = img_size_square
image = Image.open(img_path)
width, height = image.size
# resize
if (width and height) >= img_size_square:
if width > height:
wpercent = (mysize/float(image.size[1]))
vsize = int((float(image.size[0])*float(wpercent)))
image = image.resize((vsize, mysize), Image.ANTIALIAS)
else:
wpercent = (mysize/float(image.size[0]))
hsize = int((float(image.size[1])*float(wpercent)))
image = image.resize((mysize, hsize), Image.ANTIALIAS)
# crop
width, height = image.size
left = (width - mysize)/2
top = (height - mysize)/2
right = (width + mysize)/2
bottom = (height + mysize)/2
image=image.crop((left, top, right, bottom))
return image
conv_base = MobileNet(weights='imagenet', include_top=False, input_shape=(224, 224, 3))
def build_model():
model = models.Sequential()
model.add(conv_base)
model.add(layers.Flatten())
model.add(layers.Dense(256, activation='relu'))
model.add(layers.Dense(64, activation='relu'))
model.add(layers.Dense(1, activation='sigmoid'))
model.compile(loss='binary_crossentropy',
optimizer=optimizers.RMSprop(lr=2e-5),
metrics=['acc'])
return model
image=crop_resize(sys.argv[1],224)
image = np.reshape(image,[1,224,224,3])
#Loading models and text processing
model = build_model()
print('building a model')
model.load_weights('./models/mobile_weights.h5')
print('model loaded')
pred_cat=model.predict(image)
if pred_cat > 0.7:
print('fire {}'.format(pred_cat))
else: print('no fire {}'.format(pred_cat))
GetZone.py script
The input data of the script are the coordinates of the point that came from the client side of the application. The script pulls in all coordinates from NASA, adds a new latitude and longitude to this file, overwrites the original file and starts looking for the nearest points. The distance between the points is calculated according to the formula of haversine (Eng. Haversine formula ).
For this, the latitude and longitude of the points are converted to radians:
pt1_lon, pt1_lat, pt2_lon, pt2_lat = map(radians, [pt1_lon, pt1_lat, pt2_lon, pt2_lat])
There are differences between latitude and longitude for each of the points:
d_lon = pt2_lon - pt1_lon
d_lat = pt2_lat - pt1_lat
All this is substituted into the formula of haversinus:
a = sin(d_lat/2)**2 + cos(pt1_lat) * cos(pt2_lat) * sin(d_lon/2)**2
Take the root of the result of the calculation, calculate the arcsine and multiply the result by 2.
c = 2 * asin(sqrt(a))
The distance will be the product of the radius of the Earth (6371 km) by the result of the previous calculation.
Model training
To analyze the picture on the subject of a fire, we needed a training set of photos with fires. The photos were collected by the script from https://www.flickr.com/ and manually marked up.
Downloading was done using FlikerAPI. In the script, standard preprocessing operations were performed with pictures: framing is square with centering (ratio 1: 1), and resizing to 256 × 256 format.
import flickrapi
import urllib.request
from PIL import Image
import pathlib
import os
from tqdm import tqdm
# Flickr api access key
flickr=flickrapi.FlickrAPI('your API key', 'your secret key', cache=True)
def get_links():
    search_term = input("Input keywords for images: ")
    keyword = search_term
    max_pics=2000
    photos = flickr.walk(text=keyword,
                         tag_mode='all',
                         tags=keyword,
                         extras='url_c',
                         per_page=500, # mb you can try different numbers..
                         sort='relevance')
    urls = []
    for i, photo in enumerate(photos):
        url = photo.get('url_c')
        if url is not None:
            urls.append(url)
        if i > max_pics:
            break
    num_of_pics=len(urls)
    print('total urls:',len(urls)) # print number of images available for a keywords
    return urls, keyword, num_of_pics
#resizing  and cropping output images will be besquare
def crop_resize(img_path, img_size_square):
    # Get dimensions
    mysize = img_size_square
    image = Image.open(img_path)
    width, height = image.size
    # resize
    if (width and height) >= img_size_square:
        if width > height:
            wpercent = (mysize/float(image.size[1]))
            vsize = int((float(image.size[0])*float(wpercent)))
            image = image.resize((vsize, mysize), Image.ANTIALIAS)
        else:
            wpercent = (mysize/float(image.size[0]))
            hsize = int((float(image.size[1])*float(wpercent)))
            image = image.resize((mysize, hsize), Image.ANTIALIAS)
        # crop
        width, height = image.size
        left = (width - mysize)/2
        top = (height - mysize)/2
        right = (width + mysize)/2
        bottom = (height + mysize)/2
        image=image.crop((left, top, right, bottom))
        return image
def download_images(urls_,keyword_, num_of_pics_):
    num_of_pics=num_of_pics_
    keyword=keyword_
    urls=urls_
    i=0
    base_path='./flickr_data/' # your base folder to save pics
    for item in tqdm(urls):
        name=''.join([keyword,'_',str(i),'.jpg'])
        i+=1
        keyword_=''.join([keyword,'_',str(num_of_pics)])
        dir_path= os.path.join(base_path,keyword_)
        file_path=os.path.join(dir_path,name)
        pathlib.Path(dir_path).mkdir(parents=True, exist_ok=True)
        urllib.request.urlretrieve(item, file_path)
        resized_img=crop_resize(file_path, 256) #set output image size
        try:
            resized_img.save(file_path)
        except:
            pass
urls, keyword, num_of_pics =get_links()
continue = input("continue  or try other keywords (y,n): ")
if continue =='y':
    download_images(urls, keyword, num_of_pics)
elif continue =='n':
    get_links()
else:
    pass
Naturally, for work with pictures, the convolutional architecture of the neural network, in which the pre-trained model was used, was used. The choice fell (expectedly) on MobileNet , because:
- Lightweight - it is important that the application response time is minimal.
- Fast - it is important that the response time of the application is minimal.
- Accurate - MobileNet predicts with the necessary accuracy.
After training, the network gave an accuracy of ~ 0.85.
To build the model, training and prediction used a bunch of Keras + Tensorflow . Work with data was carried out through Pandas .
Since NASA DataSet is a geographic data, we wanted to use the GeoPandas library . This library is an extension of the capabilities of Pandas to provide spatial methods and operation on geometric types. Geometrical operations are implemented through the shapely library, fiona file handling, and matplotlib graphing.
Having spent almost a day and a half to deal with this library, we abandoned it because we could not find what it could give us a real advantage from working with it. Our task of calculating the coordinates was very small, so in the end, everyone implemented natively.
What's next?
Naturally, all that we got as a result is an extremely unstable and raw application that has the right to be finalized.
We made it:
- Implement prototypes of mobile and Web-based applications that were able to take photos (only for the mobile version), download and send them to the server. Also send coordinates to the server successfully.
- The server managed to deploy 2 scripts that implement the main application logic. The input data to these scripts and the output data were sent and sent to the client part.
- Implement the real “prototype” of our application.
We failed to implement, but I would like to solve the following problems and add features (items go according to the priority of the task):
- To organize the recording of all coordinates from the dataset to the database in order to interact directly with the database.
- To organize automatic uploading of a new file from the NASA site, i.e. organize automatic daily update of coordinates.
- Add notification of users located in the zone close to the fire.
- Add registration (necessary for the implementation of the first paragraph).
- Rewrite the algorithm for calculating the fire zone.
- Solve design problems - bring beauty to the mobile and web versions of the application.