We create a system of balanced indicators with our own hands. Part Three - Final

So, we have figured out the theory of building a Balanced Scorecard System, have decided on how to write a company development strategy (which, in fact, lies at the heart of the BSC).
Now is the time to start the process of creating an MTP and determining KPI.
Prepare the template.
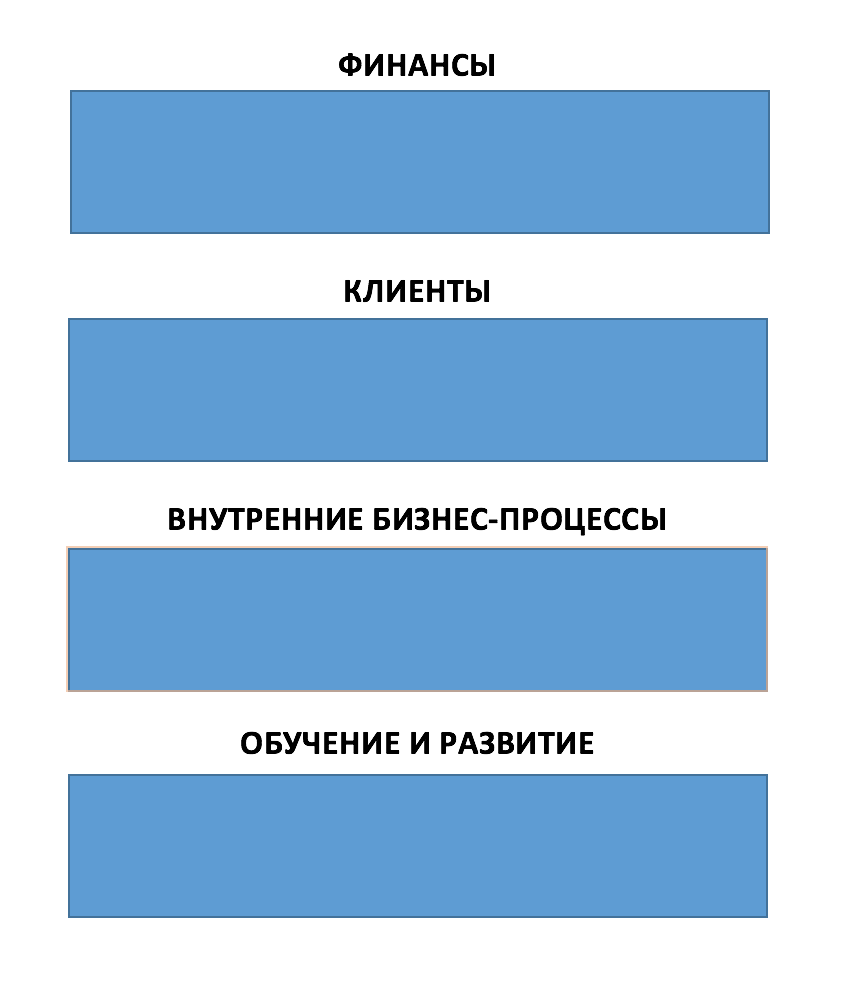
Now put aside the PC keyboard and close the laptop covers. Pick up a good old sheet of paper and draw 4 rectangles on it, one above the other.
These will be the prospects . In them you will place your KPI.
Now is the time to name the prospects. On the bottom rectangle, write " LEARNING AND DEVELOPMENT"(for brevity, I will call this perspective O&R in the future). There will be indicators and tasks that are responsible for the state of your team.
Each team member must be properly motivated to perform work tasks and have sufficient qualifications. Otherwise, you will be a general without Army - employees will regularly receive a salary, will not be able or unwilling to implement your company's strategy.
On the next box, write " INTERNAL BUSINESS PROCESSES"(hereinafter VBP). Here will be indicators that measure how efficiently the internal services of your company work. How long do you have to wait for the delivery of goods from the warehouse? How quickly does the accounting department issue closing documents? Is there a regular salary? (And this, incidentally, affects motivation) .
The third bottom rectangle will be called " cUSTOMERS ". here we will write all that concerns the interaction with the customers of our products and services. How quickly is working, the degree of customer satisfaction, and so on.
and, finally, the topmost rectangle is called “ FINANCE .” There will be information about our income and expenses. Here we will also write down the tasks to increase the first and decrease the second.
And over all this beauty we will write our strategic goals. To know what to strive for.
Did it turn out like this?
Now make 20-30 copies of this leaflet. You still have to cross out what has been written many times, toss it in the bin and write again.
It is important to remember the interconnectedness of perspectives.
All indicators and actions in all four perspectives are interdependent. For example, sending an employee to training will increase his degree of readiness for work in the future of R&D, but will require financial costs, which will negatively affect the future of Finance. But subsequently, the quality of work with customers in the same perspective will improve, which will bring more money to the company, and this ... Yes, yes, the Finance perspective will improve.
Getting down to action definition
For now, forget about KPI. The fact is that any indicator is only able to determine how effectively this or that action is performed. But we don’t have any actions yet and we just have to create them.
Take the first strategic goal from your list and conduct a SWOT analysis. For the uninitiated it sounds scary, of course, but in fact you take another piece of paper, draw a 2x2 square. In the left column you will write about the strengths of your company regarding the implementation of a strategic initiative, in the right - weak. In the upper internal factors, in the lower appearance. Something like this:
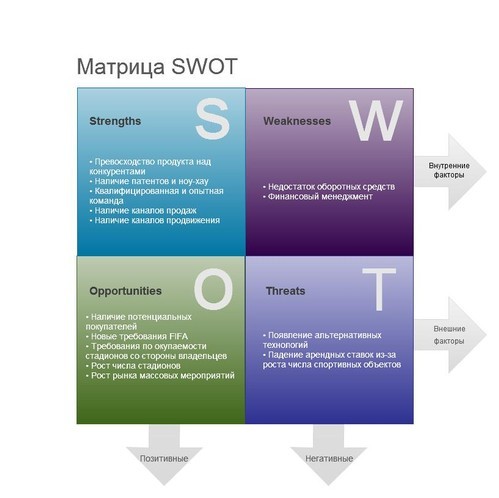
If you describe everything in detail and honestly, it will be clear what helps you, what prevents you - and most importantly, what needs to be changed.
for instance. You want to double sales, but sales of your miracle product are hindered by the low qualifications of sellers and the lack of certain functionality in the product itself. In the O&R perspective, you include “sales training.” Draw an arrow (link) from this inscription in the Finance perspective and write “Training costs” there. Spend the second arrow from the "sales training" perspective on Clients and write "Improving customer satisfaction." But that is not all. Draw the third arrow, now in the perspective of PFS. There you write "Refusal of the services of a logistician" (because your trained sellers themselves invoice). And from the words “Failure”, draw an arrow in the Finance perspective and write “Cost reduction from staff optimization”.
And of course, you draw the arrow from the increase with satisfaction in the Finance perspective - sales should increase, because of this, everything was started.
It turns out something like this:

(by the way, who does not like pen and paper, write in Word, as I did)
Now you do the same with programmers. What needs to be done so that they add the missing functionality and what prospects this will affect.
The list of actions (initiatives) is ready. Now you need to control the execution.
This is where KPIs finally appear.
First, we assign indicators to each of the previously described actions. I hope you remember that indicators can be not only quantitative, but also qualitative (good / medium / bad). We must strive to ensure that most KPIs at the highest level are precisely qualitative (and they will be calculated from a quantitative one). Because at first glance, many will not understand - the sales volume is 1 million rubles. - Is this good or bad?
Remember that the essence of KPI is that at a glance at the prospects it is possible to assess whether the plan is being implemented or not.
In the case of training for sellers, you can put KPI on the number of trainees, on the number of courses taken, on examinations the student, etc. In a financial perspective, KPIs can be expressed either with amounts of money or in the form of estimated values (they saved a little, medium, a lot).
And now we are starting to decompose the top-level KPIs.
As you recall, in our example there is an indicator dedicated to the training of sellers. Let's see how it is considered for all companies.
We have several sellers. We measure the average score obtained by the seller in the exam and translate quantitative values (from 1 to 5) into qualitative ones (passed / failed). Moreover, the formula can be arbitrarily complex, include lower coefficients for simple exams and higher for important / complex ones.
Now we are starting to integrate KPIs of individual sellers into KPIs at the company level. To do this, you can use the formula of the arithmetic mean value, or you can assign the minimum value from the indicators of sellers (as long as the team has two students, training cannot be considered successful).
When the manager looks at the top-level KPIs and sees that the “Seller training” indicator is in the “not passed” red zone, he will be able to go down one level and see which particular seller cannot pass the exam.
It was a bottom-up composition . That is, we know the possible values at the lower level and on their basis we calculate the indicators of the upper level.
But in the case when there is a sales plan for the company and based on it we begin to assign individual sales plans to managers, then this is already a top-down composition .
As a result, a number of individual indicators should be determined for each employee of the company . Among other things, this approach increases employee involvement in the company's affairs. He understands how his work affects the business as a whole.