Translation of Andrew Un's book “Passion for Machine Learning” Chapter 28 - 29
Learning curves
28 Diagnosing Offset and Scatter: Learning Curves
We considered several approaches to separating errors into avoidable bias and scatter. We did this by evaluating the optimal proportion of errors by calculating errors on the training sample of the algorithm and on the validation sample. Let's discuss a more informative approach: learning curve graphs.
Graphs of learning curves are dependences of the fraction of an error on the number of examples of a training sample.
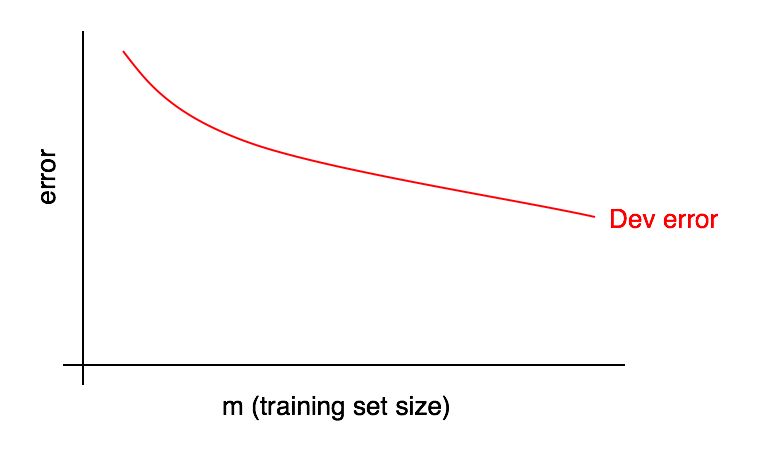
As the size of the training sample increases, the error on the validation sample should decrease.
We will often be guided by some “desired fraction of errors” that we hope will eventually reach our algorithm. For example:
- If we hope to achieve the level of quality available to man, then the proportion of human errors should be “the desired fraction of errors”
- If a learning algorithm is used in a certain product (such as a supplier of feline images), we may have an understanding of what level of quality needs to be achieved so that users get the most benefit.
- If you are working on an important application for a long time, you may have a reasonable understanding of what progress you can make in the next quarter / year.
Add the desired quality level to our learning curve:
You can visually extrapolate the red error curve in a validation sample and assume how much closer you could get to the desired level of quality by adding more data. In the example shown in the picture, it seems likely that doubling the size of the training sample will achieve the desired level of quality.
However, if the curve of the fraction of the error of the validation sample reached the plateau (that is, it turned into a straight line parallel to the x-axis), it immediately indicates that adding additional data will not help achieve the goal:
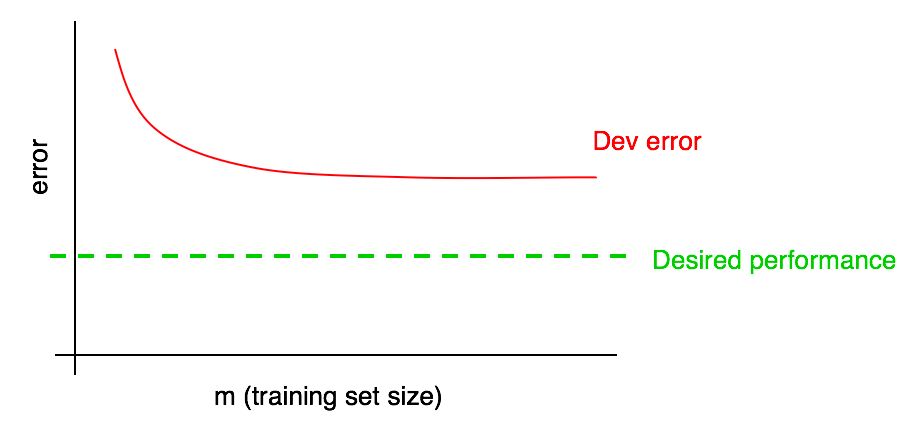
A look at the learning curve can thus help you avoid spending months collecting twice as much training data just to realize that adding them does not help.
One of the drawbacks of this approach is that if you look only at the error curve on a validation sample, it can be difficult to extrapolate and accurately predict how the red curve will behave if you add more data. Therefore, there is another additional schedule that can help assess the impact of additional training data on the proportion of errors: a training error.
29 Graph of learning errors
Errors in the validation (and test) samples should decrease as the training sample increases. But on the training sample, the error in adding data usually increases.
Let's illustrate this effect with an example. Suppose your training sample consists of only 2 examples: One picture with cats and one without cats. In this case, it is easy for the learning algorithm to remember both examples of a training sample and to show 0% error on the training sample. Even if both teaching examples are incorrectly labeled, the algorithm will easily remember their classes.
Now imagine that your training sample consists of 100 examples. Suppose a certain number of examples are classified incorrectly, or for some examples it is impossible to establish a class, for example, in blurred images, when even a person cannot determine whether a cat is present in the image or not. Suppose that the learning algorithm still “remembers” most examples of the training sample, but now it is more difficult to obtain an accuracy of 100%. By increasing the training sample from 2 to 100 examples, you will find that the accuracy of the algorithm on the training sample will gradually decrease.
In the end, imagine that your training sample consists of 10,000 examples. In this case, it becomes increasingly difficult for the algorithm to perfectly classify all the examples, especially if there are blurry images and classification errors in the training set. Thus, your algorithm will work worse on such a training sample.
Let's add a graph of learning errors to our previous ones.
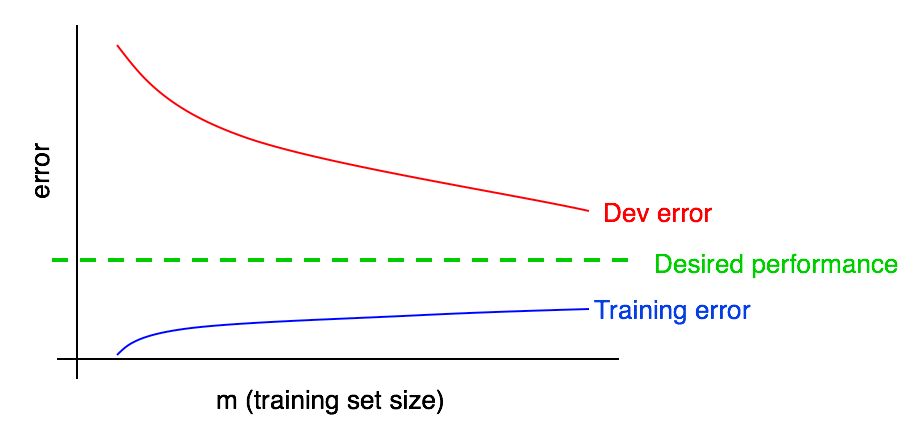
You can see that the blue “Learning Errors” curve increases as your training sample increases. Moreover, the learning algorithm usually shows better quality in the training sample than in the validation sample; thus, the red error curve on the validation sample lies strictly above the blue error curve on the training sample.
Next, let's discuss how to interpret these graphs.
to be continued