Corporate Social Infographic
I have long wanted to understand the statistics on the use of corporate social media, as well as try myself in the field of infographics. And this is what happened (see below).
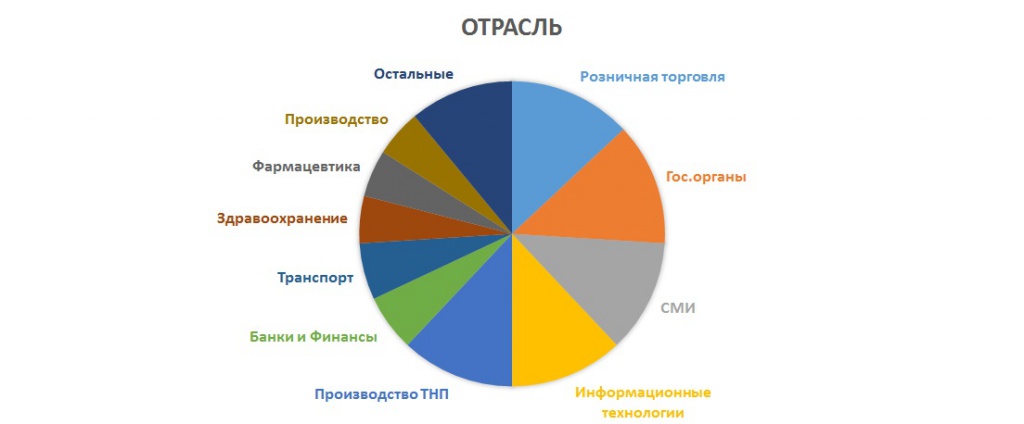
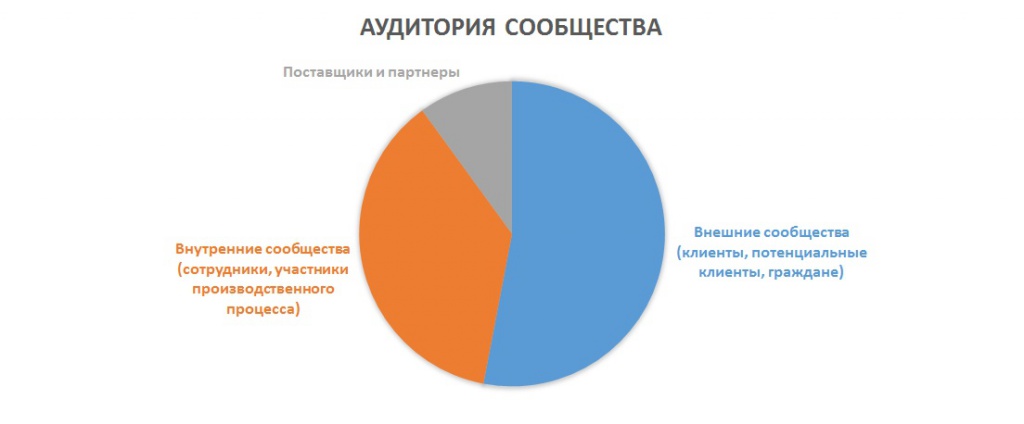
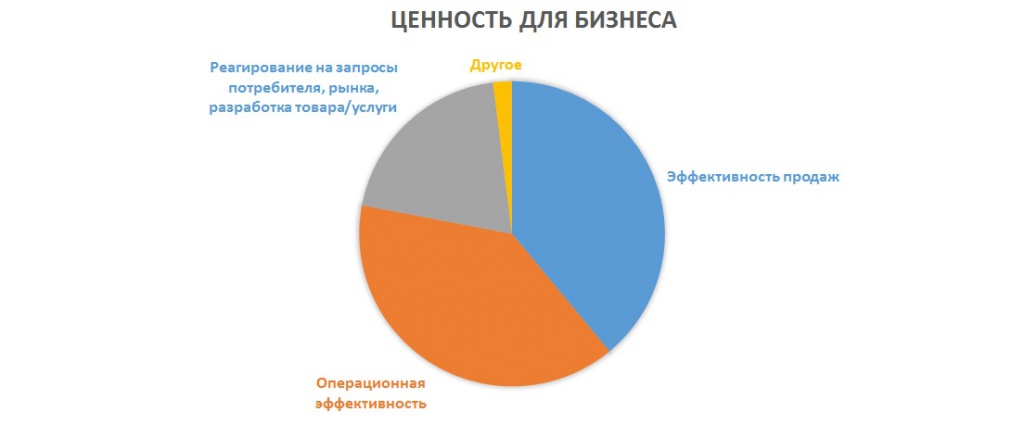
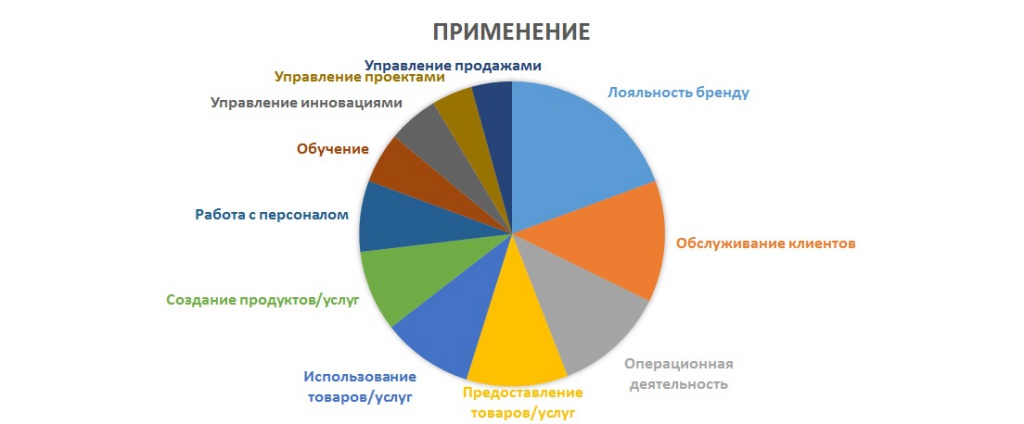

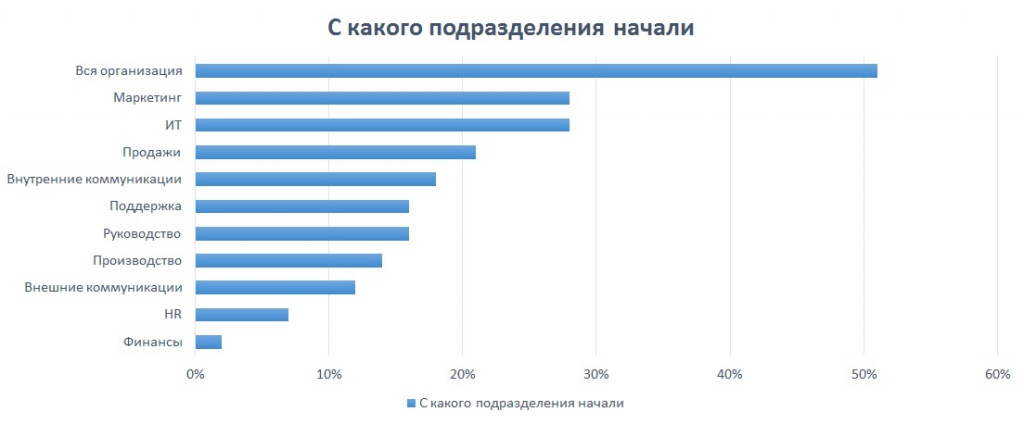
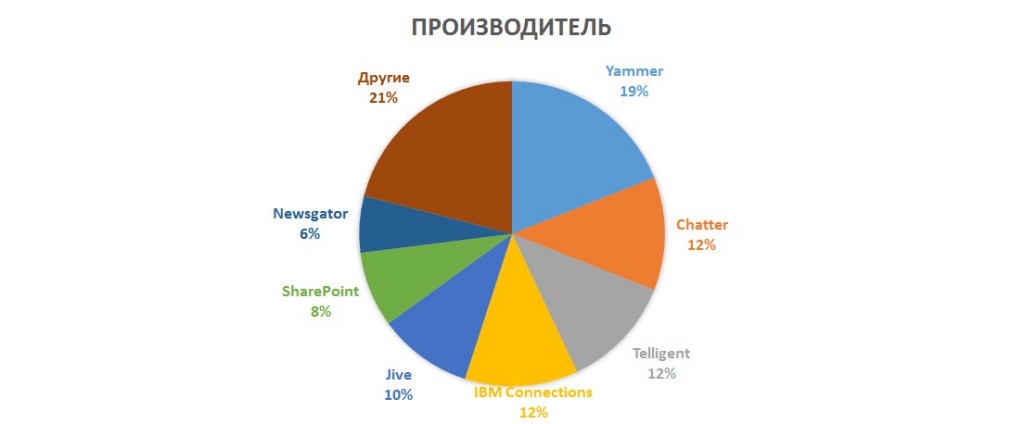
These graphs are based on two sources:
Gartner, The Social Organization, 2011
Altimeter, Making the Business Case for Enterprise Social Networks, 2012
On the one hand, four years have passed since the publication, on the other hand, the Russian IT market is repeating the dynamics of the West with a lag of some years. So, these graphs may well be relevant for us.
I propose the following interpretation of charts: if you work in the B2C industry and think about operational efficiency and sales efficiency , increase brand loyaltyand improve customer service. Use communities for crowdsourcing and expertise . And feel free to start introducing corporate social networks throughout your organization.
Vladimir Ivanitsa Facebook | LinkedIn
