How I did the animation of the solar system for the second-grader son
Once upon a time I graduated in physics. Later, even independently learned to a web programmer. Since then, I mostly work as a programmer, but I continue to devote time to both physics and technology (I’m counting on something or designing) and science in general. Such a "split" brings interesting results. It turned out that some facts in physics can be well explained with the help of programming.
Where did this question come from? The eldest child in school had a lesson about the planets of the solar system. In general, he knows them, and in the evening sky we saw some (Jupiter, Mars, Saturn). But many interesting facts remain beyond comprehension. Lack of clarity, movement, maybe interactivity. This is exactly the gap in the presentation of the material I wanted to fill with web programming, following the well-known wisdom “it’s better to see once than to hear a hundred times”.
As you may have guessed, the article will deal with facts relating to the solar system (not only the planets). Let's see what is so curious in our galactic corner.
To demonstrate everything I have written, I prepared a number of web pages to which I will give links during the conversation. In this article, we use a bunch of html + svg + javascript . It is simple, understandable and well suited to our goals. If you are interested in how this or that works “under the hood”, you can safely open and view the source of my pages. Also given links to Wikipedia, if you want to read about something more.
The main assumption when creating pages is associated with eccentricity. This parameter indicates the degree of orbit elongation. If the eccentricity is zero, then it is a clear circle, if from zero to one, then an ellipse. Many know that Pluto’s orbit is clearly elliptical (even partially superimposed on the orbit of Neptune). So, its eccentricity is 0.24. What is interesting, it turns out, and the orbit of Mercury has an eccentricity of 0.2. For other planets, the value ranges from 0.01 to 0.1 .
In order not to complicate the calculations and graphics, we will further consider the orbits as simply circular, including Mercury. We exclude Pluto from consideration, since it also has an inclination of the orbit - it turns out to be too complex a model. Of course, svg allows you to draw and ellipses, but circular orbits will be enough for us to understand the basic issues and to draw in the browser.
Now you can create everything you need on our page. In svg there is an element that just suits us. With it you can draw and the sun, and the planets, and their orbits. The positioning of the Sun and the planets, as well as the sizes of the orbits, are calculated by javascript, based on the current size of the browser window (sorry, but in mobile browsers, most likely, it will be too small). For rendering, the scale is calculated so that the largest orbit fits into the screen. To calculate the current position of the planet, the period of its revolution around the Sun in the Earth years is taken.
Let's start. Part one, there are four inner planets on the scene . On this page, we “run in” the html and svg structure so that nothing moves anywhere, debug javascript. It is important to do everything qualitatively, so that all of the following pages will use the same "frame". So, done, everything is drawn, the planets are moving. Now you can look at the results relating specifically to physics (astronomy). First, the relationships between the sizes of the orbits, and, second, between the orbital periods, became illustrative. Notice how fast Mercury is compared to Earth or Mars. Two dotted circles on the animation limit the so-called habitable zone , where the existence of life is possible. As Wikipedia tells us, different scientists give
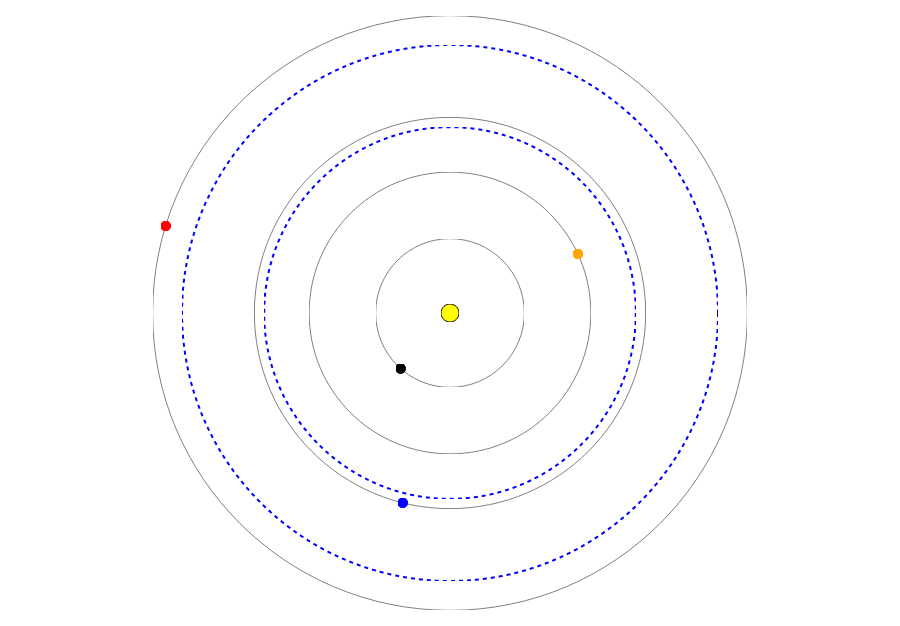
slightly different estimates for its boundaries . We took a range of 0.95 - 1.37 AU. The animation clearly shows how lucky we earthlings are - our planet is the only one that has fallen into the desired area.
Moving on.
Part two - Jupiter is on the stage .
Compared with the first animation here, we accelerated the movement by 15 times - just so that Jupiter has a more or less decent speed of movement (otherwise it is absolutely impossible to wait for him to make at least one turn). This nuance shows how slow the outer planets are moving compared to the inner ones - each revolution around the Sun is already beginning to be calculated in tens and hundreds of years.
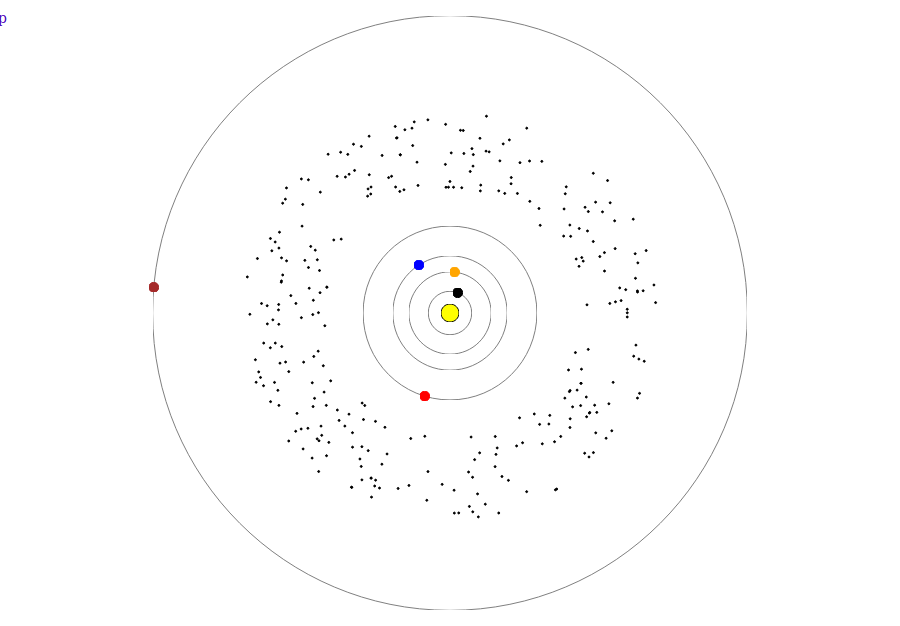
Of course, the huge gap between the orbits of Mars and Jupiter is striking. In reality, there is an asteroid belt- objects that could not form a planet due to the gravitational influence of Jupiter. The belt stretches from 2.2 to 3.6 AU. All this "construction debris" left over from the birth of the solar system is shown in the animation with black dots. Of course, you need to understand that this is an approximate display. So, there are about 300 thousand real objects in the belt, the animation shows 300 randomly located - solely for understanding the essence.
Part three - we remove the minor planets, and add Saturn to Jupiter .
The two largest planets, whatever you say, deserve special attention. They have a pronounced orbital resonance - a situation when, due to gravitational interaction, their orbital periods are related as small natural numbers . Specifically for the Jupiter-Saturn pair, the ratio of periods is 5: 2 (that is, five turns of Jupiter, Saturn makes two).
We demonstrate this phenomenon with the help of animation. Let's make a separate div on the page, in which we will put a vertical mark for each planet for each revolution. On top will be the marks of Jupiter (brown), below - Saturn (blue). Labels are also drawn using svg.

If you run the animation, we will see a gradual divergence of the tags. In fact, this is the right result: when reading the same Wikipedia, for some reason, in the phrase “almost 5: 2,” we drop the word “almost.” And we think that the Solar System is like a clock mechanism with perfectly fitted gears. But the real world is more complicated. Hence the discrepancy.
Part four - gas giants (Jupiter, Saturn, Uranus and Neptune) on the stage .
As we can see, the orbits of the planets become even larger, and the orbital velocities become even smaller. Compared with the very very first animation, time is accelerated already by 150 (!) Times - so that everything more or less “breathes”.
In this part we will talk about comets, especially since they are connected with the giant planets. Astronomers divide comets into short-period and long-period comets (the former have a revolution period of less than 200 years, the latter have, respectively, more than 200 years). Further, short-period, in turn, are divided into familiesjust on four planets - the family of Jupiter, Saturn, Uranus and Neptune. This is due to which of the planets has the greatest impact on a particular comet. A lot of material on comets, of course, is in Wikipedia, and I also found a good article on Habré.
For a better understanding of what a family is, we impose on the animation of the orbit for a pair of some comets. Let it be, for example, Halley's comet (red orbit) and Enke's comet (purple orbit) - the very first for which scientists were able to calculate the motion parameters.

For the correct drawing of ellipses in svg, I had to sit for a while with a pencil and paper and calculate the semi-axes of either orbit. Of course, I do not know the specific orientation of the ellipses, so they are directed simply to the left. Nevertheless, it is now clearly seen why Enke’s comet is attributed to the Jupiter family, and Halley to the Neptune family: the first “holds out” only to Jupiter’s orbit, and the second, respectively, Neptune (if you prefer, you can play around with code, substituting there any other comets, from these or other families - it will be seen where the orbits will reach).
So, on four animations, we looked at everything that is in the Solar System - planets, asteroids, comets, zones and belts. It remains to discuss the latter .
The overall picture is interesting because it shows how small the area of our system we have studied and mastered. The familiar circle of the inner planets is only a microscopic “patch” in the center. Neptune's orbit is the next frontier, far more distant. And around it is a giant "spatium incognita" - Kuiper belt , which is bounded by dashed lines. I want to believe that the aspirations of mankind will not remain limited to that tiny island that is outlined by the orbit of Mars. Even this simple html-page says that there is still a lot of interesting things ahead of us.

Where did this question come from? The eldest child in school had a lesson about the planets of the solar system. In general, he knows them, and in the evening sky we saw some (Jupiter, Mars, Saturn). But many interesting facts remain beyond comprehension. Lack of clarity, movement, maybe interactivity. This is exactly the gap in the presentation of the material I wanted to fill with web programming, following the well-known wisdom “it’s better to see once than to hear a hundred times”.
As you may have guessed, the article will deal with facts relating to the solar system (not only the planets). Let's see what is so curious in our galactic corner.
To demonstrate everything I have written, I prepared a number of web pages to which I will give links during the conversation. In this article, we use a bunch of html + svg + javascript . It is simple, understandable and well suited to our goals. If you are interested in how this or that works “under the hood”, you can safely open and view the source of my pages. Also given links to Wikipedia, if you want to read about something more.
Eccentricity
The main assumption when creating pages is associated with eccentricity. This parameter indicates the degree of orbit elongation. If the eccentricity is zero, then it is a clear circle, if from zero to one, then an ellipse. Many know that Pluto’s orbit is clearly elliptical (even partially superimposed on the orbit of Neptune). So, its eccentricity is 0.24. What is interesting, it turns out, and the orbit of Mercury has an eccentricity of 0.2. For other planets, the value ranges from 0.01 to 0.1 .
In order not to complicate the calculations and graphics, we will further consider the orbits as simply circular, including Mercury. We exclude Pluto from consideration, since it also has an inclination of the orbit - it turns out to be too complex a model. Of course, svg allows you to draw and ellipses, but circular orbits will be enough for us to understand the basic issues and to draw in the browser.
Model structure
Now you can create everything you need on our page. In svg there is an element that just suits us. With it you can draw and the sun, and the planets, and their orbits. The positioning of the Sun and the planets, as well as the sizes of the orbits, are calculated by javascript, based on the current size of the browser window (sorry, but in mobile browsers, most likely, it will be too small). For rendering, the scale is calculated so that the largest orbit fits into the screen. To calculate the current position of the planet, the period of its revolution around the Sun in the Earth years is taken.
Earth Group Planets
Let's start. Part one, there are four inner planets on the scene . On this page, we “run in” the html and svg structure so that nothing moves anywhere, debug javascript. It is important to do everything qualitatively, so that all of the following pages will use the same "frame". So, done, everything is drawn, the planets are moving. Now you can look at the results relating specifically to physics (astronomy). First, the relationships between the sizes of the orbits, and, second, between the orbital periods, became illustrative. Notice how fast Mercury is compared to Earth or Mars. Two dotted circles on the animation limit the so-called habitable zone , where the existence of life is possible. As Wikipedia tells us, different scientists give
slightly different estimates for its boundaries . We took a range of 0.95 - 1.37 AU. The animation clearly shows how lucky we earthlings are - our planet is the only one that has fallen into the desired area.
Moving on.
Asteroid belt
Part two - Jupiter is on the stage .
Compared with the first animation here, we accelerated the movement by 15 times - just so that Jupiter has a more or less decent speed of movement (otherwise it is absolutely impossible to wait for him to make at least one turn). This nuance shows how slow the outer planets are moving compared to the inner ones - each revolution around the Sun is already beginning to be calculated in tens and hundreds of years.
Of course, the huge gap between the orbits of Mars and Jupiter is striking. In reality, there is an asteroid belt- objects that could not form a planet due to the gravitational influence of Jupiter. The belt stretches from 2.2 to 3.6 AU. All this "construction debris" left over from the birth of the solar system is shown in the animation with black dots. Of course, you need to understand that this is an approximate display. So, there are about 300 thousand real objects in the belt, the animation shows 300 randomly located - solely for understanding the essence.
Orbital resonance
Part three - we remove the minor planets, and add Saturn to Jupiter .
The two largest planets, whatever you say, deserve special attention. They have a pronounced orbital resonance - a situation when, due to gravitational interaction, their orbital periods are related as small natural numbers . Specifically for the Jupiter-Saturn pair, the ratio of periods is 5: 2 (that is, five turns of Jupiter, Saturn makes two).
We demonstrate this phenomenon with the help of animation. Let's make a separate div on the page, in which we will put a vertical mark for each planet for each revolution. On top will be the marks of Jupiter (brown), below - Saturn (blue). Labels are also drawn using svg.
If you run the animation, we will see a gradual divergence of the tags. In fact, this is the right result: when reading the same Wikipedia, for some reason, in the phrase “almost 5: 2,” we drop the word “almost.” And we think that the Solar System is like a clock mechanism with perfectly fitted gears. But the real world is more complicated. Hence the discrepancy.
Giant planets
Part four - gas giants (Jupiter, Saturn, Uranus and Neptune) on the stage .
As we can see, the orbits of the planets become even larger, and the orbital velocities become even smaller. Compared with the very very first animation, time is accelerated already by 150 (!) Times - so that everything more or less “breathes”.
In this part we will talk about comets, especially since they are connected with the giant planets. Astronomers divide comets into short-period and long-period comets (the former have a revolution period of less than 200 years, the latter have, respectively, more than 200 years). Further, short-period, in turn, are divided into familiesjust on four planets - the family of Jupiter, Saturn, Uranus and Neptune. This is due to which of the planets has the greatest impact on a particular comet. A lot of material on comets, of course, is in Wikipedia, and I also found a good article on Habré.
For a better understanding of what a family is, we impose on the animation of the orbit for a pair of some comets. Let it be, for example, Halley's comet (red orbit) and Enke's comet (purple orbit) - the very first for which scientists were able to calculate the motion parameters.
For the correct drawing of ellipses in svg, I had to sit for a while with a pencil and paper and calculate the semi-axes of either orbit. Of course, I do not know the specific orientation of the ellipses, so they are directed simply to the left. Nevertheless, it is now clearly seen why Enke’s comet is attributed to the Jupiter family, and Halley to the Neptune family: the first “holds out” only to Jupiter’s orbit, and the second, respectively, Neptune (if you prefer, you can play around with code, substituting there any other comets, from these or other families - it will be seen where the orbits will reach).
All planets and beyond
So, on four animations, we looked at everything that is in the Solar System - planets, asteroids, comets, zones and belts. It remains to discuss the latter .
The overall picture is interesting because it shows how small the area of our system we have studied and mastered. The familiar circle of the inner planets is only a microscopic “patch” in the center. Neptune's orbit is the next frontier, far more distant. And around it is a giant "spatium incognita" - Kuiper belt , which is bounded by dashed lines. I want to believe that the aspirations of mankind will not remain limited to that tiny island that is outlined by the orbit of Mars. Even this simple html-page says that there is still a lot of interesting things ahead of us.