Nontrivial metrics of the effectiveness of advertising campaigns
When analyzing the chains of advertising channels, some fairly simple but useful ideas slip unnoticed. Analysts well familiar with mathematics aspire to immerse themselves in machine learning, and analysts who are far from mathematics do not really understand where and how to look apart from standard Google Analytics reports.
At the same time, such a rather banal thing as the distribution of lengths of attribution chains for a period can tell very eloquent things, and not only about the effectiveness of your advertising.
In this article, I will show how this distribution:

Suppose you have data on all the chains of channels that users have been through in a month. To begin with, we divide them into two groups:
Construct a table containing the number of chains of a certain length:
After that, you can build graphs of the logarithm of the number of converted and unconverted chains on their length and look at them together. For example, we built such a schedule for one of our B2C clients over a period of time:
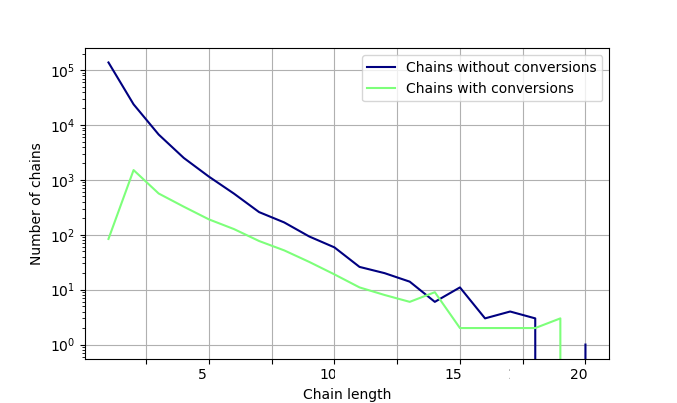
Fig.1. Dependence of the number of chains on the length of the chain
Each point in the graph specifies a certain group of users who either completed the conversion (green line) or did not complete (the blue line) while passing a chain of a given length. Both charts go down because the number of chains decreases exponentially with its length. For short chains (from 2 to 7-8) the level of conversion (distance between the lines) gradually increases.
There are several extremely interesting points that can be identified by looking at this chart:
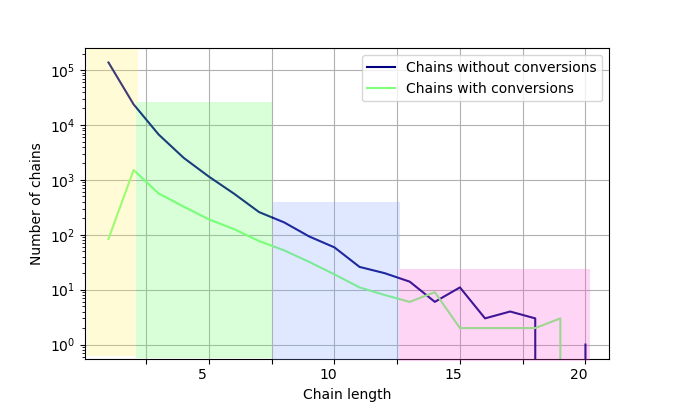
Fig.2. The dependence of the number of chains on their length with superimposed regions that distinguish different types of behavior.
We have 4 explicit user groups:
Highlighting these 4 groups helps to understand the volume of people who potentially respond to advertising. This is mostly a group (2).
To begin, we throw out all unnecessary. Lengths greater than 15 (within the framework of these data) are not very informative for us. Too small a number of chains of this length does not allow to draw any conclusions. Draw a graph of the conversion level of the chain length:
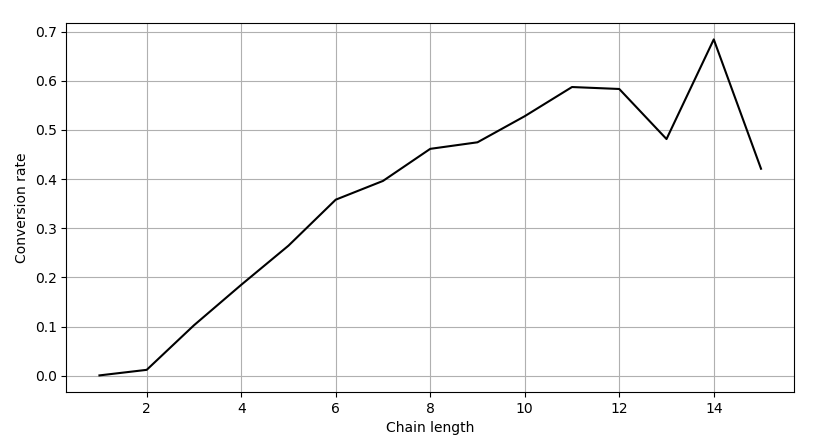
Fig.3. The dependence of the level of conversion on the length of the chain.
This graph is approximately from the igmoid . Such dependencies are described by the Logistic regression . The description of the obtained dependency with the help of logistic regression helps to draw additional useful conclusions, but two facts prevent the good approximation with the help of logistic regression:
Both of these issues are solved quite simply.
Why does the lower tail have such inadequate (for log regression) low probabilities?
It is intuitively obvious that if a person followed at least three times the links to your resource, it probably did not quite happen by chance. And once a chance is very likely. Thus, the question posed is solved simply and radically - all these people were on the site by chance (most likely), and they and neither your products nor your services were needed. But here they are on your site, and there is a chance that they are converted.
Therefore, we will simply not consider this group anymore. To approximate logistic regression, we will consider only user groups (2) and (3).
How to get rid of the fact that the probability tends not to 1, if in logistic regressions it should tend to 1?
What do advertising companies give? They enable the client to fully get acquainted with the company, its services and amenities. If a person has already learned everything about the company, does this necessarily mean that he will buy something? Not. Most likely there are tens and hundreds of alternatives to the advertised service. A person who already knows everything about your particular service is likely to be close enough with a certain number of other services. And now he has enough information to choose with some probability a certain firm in which he will order something. And this probability is less than 1. An increase in the number of passes for advertisements with a certain amount becomes meaningless. Therefore, in order for the graph to strive for 1,
Let's look at the above from the other side. For sufficiently long chains, the number of additional passes of the user in advertising no longer plays a role. The value has something else. We call this the degree of convenience of the company as such. It is permanent for the organization.
Then the total probability of conversion is divided into the product of two probabilities:
 - integral assessment of the effectiveness of the organization, i.e. the probability to buy something in an organization, about which you already know everything you can, and consciously choose between this organization and alternatives (additional passes through advertising channels will not affect the decision to purchase).
  - integral assessment of the effectiveness of the marketing strategy, i.e. the likelihood of buying something in an organization, provided that only marketing is influenced, and if a person knows everything that is possible, then he will definitely buy it from that organization, and he will not consider alternatives. And, of course, this probability depends on the length of the chain.
 .
.
If we again return to Figure 3, we will see that the area of influenceextends just for (2) a user group. For group (3) -  , and therefore the probability of purchase is equal . In our case, on average
  that is extremely good. This figure says that, having all the cards in hand, a person selects this organization from all possible alternatives in 55% of cases.
Well, it remains to add that now we have rationalization forwhich aspires to 1. To it now it is possible to apply simple univariate logistic regression. We will do this by approximating the sigmoid data normalized to 1 by dividing the data by.
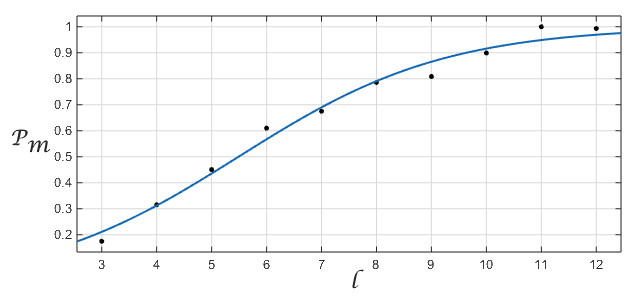
Fig.4. The dependence of the conversion on the length of the chain with a superimposed curve for logistic regression.
On the chart- chain length, P m -. The exponent for the log regression exponent ( log-odds ratio ) = 0.53. If the company would have a 100% chance of "conscious conversion" ( ), this would roughly mean that with each increase in the chain by one, the ratio of the number of chains with conversion and without conversion would change by [exp (0.53) = 1.699].
This indicator measures the degree of effectiveness of the marketing strategy as a whole. The faster the probability is reachedthe more effective the strategy is. Naturally, we must follow to accepted the values satisfactory for your business, otherwise an effective marketing strategy will force a potential client to buy something not from you.
Consider the figure (3), which shows the dependence of the probability of conversion on the number of channels currently passed by the user. Each point on the chart corresponds to a conditional slice of the target audience. For example, people who went through 10 channels are somehow different from those that went through only 2, because most of those who went through two channels will not get to 10.
Moreover, for those who have passed 10 channels, marketing programs most likely do not work anymore. They have already seen all possible advertising. For those who have only two channels, advertising may be working. Thus, the entire marketing strategy should be focused specifically on the group (2). People who have passed more than two channels, but have not yet passed, for example, 10.
Our data study showed that for group (2) there is a significant negative correlation between the level of conversion and the total number of clicks on advertising for a certain period. Those. the more people from Central Asia, in principle, passed through some advertising channel, the less likely it is that a member of the group (2) of this channel will convert.
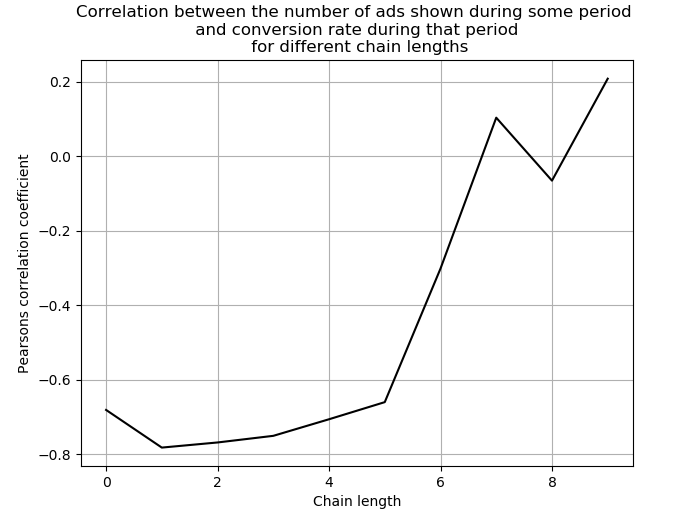
Fig. 5. Relationship between correlation and different chain lengths. Correlation is the Pearson correlation coefficient between the level of conversion and the total number of clicks on advertising channels.
This may be due to the fact that the growth of transitions is associated with an increase in hits. Intellectual algorithms of advertising sites try to show advertisements of the most effective part of Central Asia, but this part is limited. Thus, with an increase in the number of impressions, the algorithms are forced to start advertising for the less effective part of Central Asia. This part of Central Asia is less likely to convert.
It can be assumed that there is some optimal choice of the frequency of ad impressions on the channel, which would only affect the most effective part of Central Asia. The degree of adequacy of the choice of the current frequency can be estimated by considering the correlation between the total number of transitions for the period and the level of conversion. If this correlation is negative, the frequency of impressions should be reduced. If it is approximately 0, then the size is optimal. If it is positive, the size of the audience can be increased.
In our case, a change in the frequency of impressions, which led to a decrease in the number of conversions by 25%, led to an increase in the average conversion level of the group (2) from 3.5% to 4%.
The main proposed metrics are:
All of the above has a number of limitations in interpretation. And the main limitation imposes on us a finite time consideration. Obviously, sufficiently long chains may end up with conversion somewhere in the future (which we have not yet found) and some “real” level of chain conversion may be somewhat higher. It is reasonable to assume that Pfirm turns out to be somewhat underestimated and this assessment is an integral assessment of the effectiveness of the organization from below. To avoid these difficulties, we can consider a time interval in which all these effects of a finite time would be vanishingly small. For example, a whole year.
PS To keep up with the news of the Maxilect company and be the first to know about all publications, subscribe to our pages on VK , FB orTelegram channel .
At the same time, such a rather banal thing as the distribution of lengths of attribution chains for a period can tell very eloquent things, and not only about the effectiveness of your advertising.
In this article, I will show how this distribution:
- To distinguish among users who react to advertisements through the advertising channels;
- Evaluate the effectiveness of the impact of your advertising campaign on this group;
- Rate how people would react to your product if they knew everything about it that you wanted to tell them;
- Evaluate the optimal frequency of advertisements in terms of conversion level.
User engagement groups
Suppose you have data on all the chains of channels that users have been through in a month. To begin with, we divide them into two groups:
- Chains that ended in conversion.
- Chains that did not end in conversion.
Construct a table containing the number of chains of a certain length:
| Chain length | one | 2 | 3 | four | ... |
| The number of chains with conversion | 200 | 400 | 600 | 1000 | ... |
| The number of chains without conversions | 400,000 | 300,000 | 30,000 | 7,000 | ... |
Fig.1. Dependence of the number of chains on the length of the chain
Each point in the graph specifies a certain group of users who either completed the conversion (green line) or did not complete (the blue line) while passing a chain of a given length. Both charts go down because the number of chains decreases exponentially with its length. For short chains (from 2 to 7-8) the level of conversion (distance between the lines) gradually increases.
There are several extremely interesting points that can be identified by looking at this chart:
Fig.2. The dependence of the number of chains on their length with superimposed regions that distinguish different types of behavior.
We have 4 explicit user groups:
- Chains of length 1 and 2 (yellow). The number of conversions is growing, but this growth itself and the values of the conversion rate do not correspond to the main trend. These are users who are just familiar with the product.
- Chains of length from 3 to 9 (green). The main trend when the number of conversions decreases. The graphs come closer, which says that the ratio of chains changes in the direction of increasing the proportion of chains with conversion. Those. conversion rate is growing. This corresponds to users who purposefully move on advertisements.
- Chains from 9 to 15 (blue). The number of conversions decreases, and the level of conversion remains unchanged. Charts run in parallel, which says that the conversion rate is unchanged. Users have an idea of how an organization can meet their needs, and additional advertising does not increase the likelihood of a purchase.
- More than 15 (pink). Less than 10 conversions and no conversion chains. Too little data to say.
Highlighting these 4 groups helps to understand the volume of people who potentially respond to advertising. This is mostly a group (2).
Group Conversion Level Analysis
To begin, we throw out all unnecessary. Lengths greater than 15 (within the framework of these data) are not very informative for us. Too small a number of chains of this length does not allow to draw any conclusions. Draw a graph of the conversion level of the chain length:
Fig.3. The dependence of the level of conversion on the length of the chain.
This graph is approximately from the igmoid . Such dependencies are described by the Logistic regression . The description of the obtained dependency with the help of logistic regression helps to draw additional useful conclusions, but two facts prevent the good approximation with the help of logistic regression:
- The lower tail is too low, the regression will greatly overestimate the probability of conversion for short chain lengths.
- As the number of chains increases, the graph tends not to 1, like a sigmoid, but to 0.5.
Both of these issues are solved quite simply.
Why does the lower tail have such inadequate (for log regression) low probabilities?
It is intuitively obvious that if a person followed at least three times the links to your resource, it probably did not quite happen by chance. And once a chance is very likely. Thus, the question posed is solved simply and radically - all these people were on the site by chance (most likely), and they and neither your products nor your services were needed. But here they are on your site, and there is a chance that they are converted.
Therefore, we will simply not consider this group anymore. To approximate logistic regression, we will consider only user groups (2) and (3).
How to get rid of the fact that the probability tends not to 1, if in logistic regressions it should tend to 1?
What do advertising companies give? They enable the client to fully get acquainted with the company, its services and amenities. If a person has already learned everything about the company, does this necessarily mean that he will buy something? Not. Most likely there are tens and hundreds of alternatives to the advertised service. A person who already knows everything about your particular service is likely to be close enough with a certain number of other services. And now he has enough information to choose with some probability a certain firm in which he will order something. And this probability is less than 1. An increase in the number of passes for advertisements with a certain amount becomes meaningless. Therefore, in order for the graph to strive for 1,
Integral evaluation of the effectiveness of the organization and its marketing strategy
Let's look at the above from the other side. For sufficiently long chains, the number of additional passes of the user in advertising no longer plays a role. The value has something else. We call this the degree of convenience of the company as such. It is permanent for the organization.
Then the total probability of conversion is divided into the product of two probabilities:

- integral assessment of the effectiveness of the organization, i.e. the probability to buy something in an organization, about which you already know everything you can, and consciously choose between this organization and alternatives (additional passes through advertising channels will not affect the decision to purchase). - integral assessment of the effectiveness of the marketing strategy, i.e. the likelihood of buying something in an organization, provided that only marketing is influenced, and if a person knows everything that is possible, then he will definitely buy it from that organization, and he will not consider alternatives. And, of course, this probability depends on the length of the chain.. If we again return to Figure 3, we will see that the area of influence
extends just for (2) a user group. For group (3) - , and therefore the probability of purchase is equal . In our case, on average that is extremely good. This figure says that, having all the cards in hand, a person selects this organization from all possible alternatives in 55% of cases. Well, it remains to add that now we have rationalization for
which aspires to 1. To it now it is possible to apply simple univariate logistic regression. We will do this by approximating the sigmoid data normalized to 1 by dividing the data by. Fig.4. The dependence of the conversion on the length of the chain with a superimposed curve for logistic regression.
On the chart
- chain length, P m -. The exponent for the log regression exponent ( log-odds ratio ) = 0.53. If the company would have a 100% chance of "conscious conversion" (), this would roughly mean that with each increase in the chain by one, the ratio of the number of chains with conversion and without conversion would change by [exp (0.53) = 1.699]. This indicator measures the degree of effectiveness of the marketing strategy as a whole. The faster the probability is reached
the more effective the strategy is. Naturally, we must follow to accepted the values satisfactory for your business, otherwise an effective marketing strategy will force a potential client to buy something not from you. Evaluation of the optimal frequency of advertising on the channel
Consider the figure (3), which shows the dependence of the probability of conversion on the number of channels currently passed by the user. Each point on the chart corresponds to a conditional slice of the target audience. For example, people who went through 10 channels are somehow different from those that went through only 2, because most of those who went through two channels will not get to 10.
Moreover, for those who have passed 10 channels, marketing programs most likely do not work anymore. They have already seen all possible advertising. For those who have only two channels, advertising may be working. Thus, the entire marketing strategy should be focused specifically on the group (2). People who have passed more than two channels, but have not yet passed, for example, 10.
Our data study showed that for group (2) there is a significant negative correlation between the level of conversion and the total number of clicks on advertising for a certain period. Those. the more people from Central Asia, in principle, passed through some advertising channel, the less likely it is that a member of the group (2) of this channel will convert.
Fig. 5. Relationship between correlation and different chain lengths. Correlation is the Pearson correlation coefficient between the level of conversion and the total number of clicks on advertising channels.
This may be due to the fact that the growth of transitions is associated with an increase in hits. Intellectual algorithms of advertising sites try to show advertisements of the most effective part of Central Asia, but this part is limited. Thus, with an increase in the number of impressions, the algorithms are forced to start advertising for the less effective part of Central Asia. This part of Central Asia is less likely to convert.
It can be assumed that there is some optimal choice of the frequency of ad impressions on the channel, which would only affect the most effective part of Central Asia. The degree of adequacy of the choice of the current frequency can be estimated by considering the correlation between the total number of transitions for the period and the level of conversion. If this correlation is negative, the frequency of impressions should be reduced. If it is approximately 0, then the size is optimal. If it is positive, the size of the audience can be increased.
In our case, a change in the frequency of impressions, which led to a decrease in the number of conversions by 25%, led to an increase in the average conversion level of the group (2) from 3.5% to 4%.
Conclusions and limitations
The main proposed metrics are:
- Group size (2). It allows you to estimate how many people in the period under review actively reacted to advertisements.
- The probability of the conversion of a person who in general passed by chance and does not need anything from the organization. It is estimated by the level of conversion of “one-step” chains. In the case of the data reviewed here, this is 0.06%.
- Splitting the probability of conversion depending on the length of the chains into two and
 can be estimated:
- Integral assessment of the effectiveness of the organization. Those. The probability of buying a product, provided that with additional viewing of advertising, the person’s opinion about the product and company does not change at all. In our case, it is 55%.
- Integral assessment of the effectiveness of the marketing strategy in terms of the logistic regression, which can bring the existing dependence of the conversion level on the length of the chain. With each increase in the chain, the probability of a conversion increases by one, and it would at one point reach 100% if. The logistic regression index indicates the severity of this increase.
- Integral assessment of the effectiveness of the organization. Those. The probability of buying a product, provided that with additional viewing of advertising, the person’s opinion about the product and company does not change at all. In our case, it is 55%.
- The correlation between the level of conversion and the total number of transitions of the group (2) on the advertising channel for the period allows us to estimate the optimal frequency of ad impressions on the channel.
All of the above has a number of limitations in interpretation. And the main limitation imposes on us a finite time consideration. Obviously, sufficiently long chains may end up with conversion somewhere in the future (which we have not yet found) and some “real” level of chain conversion may be somewhat higher. It is reasonable to assume that Pfirm turns out to be somewhat underestimated and this assessment is an integral assessment of the effectiveness of the organization from below. To avoid these difficulties, we can consider a time interval in which all these effects of a finite time would be vanishingly small. For example, a whole year.
PS To keep up with the news of the Maxilect company and be the first to know about all publications, subscribe to our pages on VK , FB orTelegram channel .