libuniset2 - library for creating ACS. It’s better to see once ... Part 4 (Setup)
In the previous parts ( part 1 , part 2 , part 3 ), the creation of two processes was described: a simulator and a control process ... Now, the time has come to set up .
So, at the moment we have already implemented and are starting the following processes:
you can start setup ...
The time has come for a small explanatory picture to understand what is happening here ...

Actually, of course, everything is a little more complicated, but the figure is designed to help understand how we have “information flows” arranged .
So..
Since all interaction takes place through sensors, the setup, in general, is “setting sensors” and “monitoring the current state of sensors”. For these purposes, several utilities are included in libuniset2-utils :
All these utilities are actively used in commissioning, but they are tools for tracking the "external" life of processes. And there are two additional mechanisms that allow you to observe the "life of processes" from the inside:
Of course, you could start the setup by running two processes at once, and see what happens there. But it is more correct, if possible, to carry out the adjustment of processes separately. Let's start with a simulator.
Check that the objects are available. Go to src / Services / Administrator / and run ./exist. You
should see the following
Now we return to the beginning and remember what the simulator should do.
The simulator should, upon arrival of the cmdLoad_C = 1 command, begin to simulate the filling of the tank (growth of the Level_AS sensor ), and upon the arrival of the cmdUnload_C = 1 command, it should simulate the emptying of the tank (reduce the Level_AS sensor ).
So we have to
Let's see generally the current state of the sensors. We will use the uniset2-smviewer utility .
We enter the src / Services / SMViewer directory and run ./start_fg.sh
We see this ...
As you can see, everything is zero… Of course, in a real project there will be VERY many sensors, and therefore you can ( and should) use uniset2-smviewer with grep if you want to somehow filter the output ...
The second utility that we need is uniset2-smonit to see how the level sensor will change. Let's run it. Go to src / Services / SMonit / and ...
For this utility, you need to specify which sensors we want to monitor, so it has the --sid key
(for simplicity, it is entered immediately in start_fg.sh ). You can specify the identifier as the --sid parameter , or you can specify the name of the sensor. We will indicate the name Level_AS.
smonit starts up and hangs waiting for changes. At the same time, the current state of the sensor is displayed at the beginning. From the output you can see the name , time of the last change (including microseconds), the identifier of the process that saved this sensor in SM (in this case, Imitator1), and the current value (and in the form of a float - fvalue ).
Everything seems to be ready, set the cmdLoad_C = 1 sensor and see how the Level_AS sensor ran to change.
We will just use admin to set it.
and switching to the console where smonit is running, we look at how the sensor ran (from 0 to 100).
So the increase works. The reduction is checked in the same way ... first you need to remember to reset the previous command, and we will do it in one fell swoop
smonit ran the other way (from 100 to 0)
Now I will describe a mechanism that allows you to view the internal variables of an object. In general, everything is very simple. Knowing the identifier or name of the object, you can simply request information from it.
So, everything is up and running. Let's see what the Imitator1 object shows us.
We go into src / Services / Administrator and run the command ./oinfo Imitator1
As you can see from the output, the oinfo command allows you to see
I’ll say a little more about user information ...
Each object (more precisely, the class skeleton) has a special function
redefining which, you can display your information in the form of text (string). In this case, the simulator, for example, writes “Current Operating Mode: Fill” (or “empty”) . You can write something more complicated.
Of course, when you write your management process, most likely you will have, in addition to the variables declared in the xml file, some other class fields of your own. And of course you will want to follow (display information) about the current state and your variables as well. There is nothing easier . Suppose we add two command counters to the simulator.
Then, if you want to see them in the output of oinfo , just make two magic calls in the constructor :
Those. just wrapped their variables in vmonit (xxx) . Macro magic , of course, could not be avoided here , but this is probably not very annoying ...
As a result, we will already see our variables on the screen ( cluttered among others ).
IMPORTANT: so far only standard simple types are supported: bool, int, long, etc., for everything else there is a universal function getMonitInfo ()
As you know, no matter how many debugging mechanisms exist, your favorite cout (or not your favorite printf ) will still be used. Well, libuniset also provides this method. In fact, the topic is very extensive, if you disclose all the features and details, then this is a topic for a separate article. Therefore, I will show the application and tell a few details ...
In the generated skeleton of the class, there is a special object for logs - log . It essentially has an interface like cout, only it is shared_ptr , so you need to use it as a pointer. for example
or
The log has 15 levels, you can enable them “in parallel” (ie, for example info, warn, crit), you can specify the file where to write the logs, you can enable or disable the output of the date and time at the beginning of each line, etc. . In general, a lot of standard features. For each object, you can enable or disable logs by simply specifying a command line argument at startup
But all this would not be so interesting if it were not for the presence of such a mechanism as LogServer . At each site there is a built LogServer, which is not run by default, it does not consume resources, respectively, and generally can not be seen in any way. But a simple command line argument
we can activate it. By default, it runs on localhost , and uses the object identifier as the port. But you can also force the host and port to start.
After the object is running LogServer, we can read its logs, and remotely . Just connecting to the specified host and port. There is a special utility uniset2-log for reading logs . Using it, in addition to reading the logs, you can also control the level of log output, writing to a file, etc., i.e. exercise full control over the logs of the object. This is a very convenient mechanism, as Allows you to enable and disable the logs without restarting the program ( and you often cannot stop the process, but you really need to see what is going on inside).
... let's just show you ...
So, everything is started, and we added a line to the start_fg.sh simulator
By the way, in the output of ./oinfo , if someone has not noticed, information is displayed on whether LogServer is running. But let me show you again ( go to the src / Services / Administator / directory and run the ./oinfo Imitator1 command ).
So logserver is running on localhost and port 20001 . But by default (unless, of course, the developer forcibly turns them on) , the logs are disabled. Accordingly, we will not just connect, but immediately also turn on all (any) logs in order to immediately begin to see them . Let's connect (add -v switch to see debug information about who we are connecting to)
I added a log (level 3) to the timer function, for output, to demonstrate operation.
Then we connect (as indicated above) and in another console ( go to src / Services / Administrator ) we set the command
And here is what we will see in the logs ( remotely readable )
Taking the opportunity to read the logs remotely, it is important not to forget that if you turned them on , it would be nice to turn them off too, because the logs should not work in a real system, input / output is an expensive pleasure. And yet, I’ll show you a little opportunity that I didn’t reveal before.
In a real application, LogServer of course runs one on all objects (within a single executable file), which at the same time are arranged in a hierarchy using LogAgregator and can be flexibly managed.
Talking about some mechanisms every time, I try to strike a balance between a bunch of details of internal functioning and ease of external use. Those. " Here are the ready-made teams, take and use - they work out of the box ." Therefore, I didn’t tell much, and maybe something remained not obvious ... I will try to answer your questions.
In general, if you do not assume that normal testing is much more than any “tests” (boundary cases, setting max, min, issuing commands at the same time, etc.), then we are done with setting up the simulator. The main thing was to demonstrate the debugging tools included with libuniset2:
The work of our management process can be adjusted in approximately the same way, but I’ll better show the adjustment of the control algorithm, using the more advanced way of setting up an example — writing functional tests using uniset2-testsuite . About this in the next part ...
Well, in the end, as usual, references:
So, at the moment we have already implemented and are starting the following processes:
you can start setup ...
Adjustment Introductory part.
The time has come for a small explanatory picture to understand what is happening here ...
Actually, of course, everything is a little more complicated, but the figure is designed to help understand how we have “information flows” arranged .
So..
- All interaction goes through SharedMemory.
- The control process receives saves to the SM command, and from the SM receives notifications of changes in the level sensor (Level_s)
- The control simulator receives notification of changes in commands from the SM, and in the SM saves the simulated level status
- All interaction goes through sensors
Since all interaction takes place through sensors, the setup, in general, is “setting sensors” and “monitoring the current state of sensors”. For these purposes, several utilities are included in libuniset2-utils :
- uniset2-admin is a multifunctional utility, but in this case it also allows you to set ( setValue ) and view the current state of sensors ( getValue )
- uniset2-smviewer - a utility that allows you to immediately see the status of all sensors registered in SM
- uniset2-smonit - a utility that “monitors” (monitoring) changes in the specified sensors
All these utilities are actively used in commissioning, but they are tools for tracking the "external" life of processes. And there are two additional mechanisms that allow you to observe the "life of processes" from the inside:
- vmonit - monitor internal variables of an object
- LogServer - remote reading of process logs
Of course, you could start the setup by running two processes at once, and see what happens there. But it is more correct, if possible, to carry out the adjustment of processes separately. Let's start with a simulator.
Simulator Debugging
- Start SM - Go to the src / Services / SharedMemory / directory . Run the start_fg.sh script
- Run the simulator - Go to the src / Algorithms / Imitator / directory . Run the start_fg.sh script
Check that the objects are available. Go to src / Services / Administrator / and run ./exist. You
should see the following
Screen output
[pv@pvbook Administrator]$ ./exist
||=======********  UNISET-EXAMPLE/Services  ********=========||
пусто!!!!!!
||=======********  UNISET-EXAMPLE/Controllers  ********=========||
(22000 )SharedMemory1                                             <--- exist ok
||=======********  UNISET-EXAMPLE/Objects  ********=========||
(20001 )Imitator1                                                 <--- exist ok
[pv@pvbook Administrator]$
Now we return to the beginning and remember what the simulator should do.
The simulator should, upon arrival of the cmdLoad_C = 1 command, begin to simulate the filling of the tank (growth of the Level_AS sensor ), and upon the arrival of the cmdUnload_C = 1 command, it should simulate the emptying of the tank (reduce the Level_AS sensor ).
So we have to
- set the sensor cmdLoad_C = 1 and see the rise of Level_AS
- set the sensor cmdUnload_C = 1 and see a decrease in Level_AS
Let's see generally the current state of the sensors. We will use the uniset2-smviewer utility .
We enter the src / Services / SMViewer directory and run ./start_fg.sh
We see this ...
Screen output
[pv@pvbook SMViewer]$ ./start_fg.sh
======================================================
SharedMemory1    Датчики
------------------------------------------------------
(  101) | AI |                                                     Level_AS   |     0
(  100) | DI |                                                  OnControl_S   |     0
------------------------------------------------------
======================================================
SharedMemory1    Выходы
------------------------------------------------------
(  103) | DO |                                                  CmdUnload_C   |     0
(  102) | DO |                                                    CmdLoad_C   |     0
------------------------------------------------------
======================================================
SharedMemory1    Пороговые датчики
------------------------------------------------------
As you can see, everything is zero… Of course, in a real project there will be VERY many sensors, and therefore you can ( and should) use uniset2-smviewer with grep if you want to somehow filter the output ...
The second utility that we need is uniset2-smonit to see how the level sensor will change. Let's run it. Go to src / Services / SMonit / and ...
Slight subtlety when using smonit
Т.к. uniset2-smonit запускается и отслеживает изменение указанных датчиков, он должен иметь «обратный адрес». Для uniset-системы, таким адресом является идентификатор. По умолчанию, uniset2-smonit пытается запускаться с именем TestProc. Т.е. подразумевается, что в configure.xml в секции objects объявлен объект с name=«TestProc». Но если по каким-то причинам в вашем проекте не хочется иметь такой объект, то uniset2-smonit можно запустить с параметром --name XXX и указать любое имя из существующих в проекте объектов (не задействованных в текущий момент).
For this utility, you need to specify which sensors we want to monitor, so it has the --sid key
(for simplicity, it is entered immediately in start_fg.sh ). You can specify the identifier as the --sid parameter , or you can specify the name of the sensor. We will indicate the name Level_AS.
./start_fg.sh Level_AS
Team output
smonit starts up and hangs waiting for changes. At the same time, the current state of the sensor is displayed at the beginning. From the output you can see the name , time of the last change (including microseconds), the identifier of the process that saved this sensor in SM (in this case, Imitator1), and the current value (and in the form of a float - fvalue ).
Everything seems to be ready, set the cmdLoad_C = 1 sensor and see how the Level_AS sensor ran to change.
We will just use admin to set it.
[pv@pvbook Administrator]$ ./setValue CmdLoad_C=1
and switching to the console where smonit is running, we look at how the sensor ran (from 0 to 100).
Smonit screen output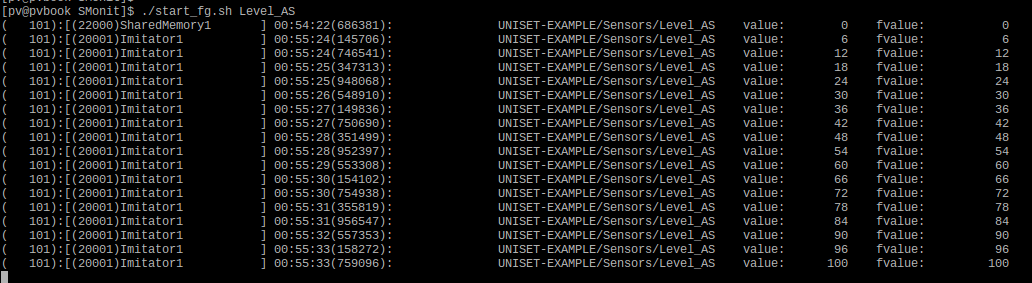
So the increase works. The reduction is checked in the same way ... first you need to remember to reset the previous command, and we will do it in one fell swoop
[pv@pvbook Administrator]$ ./setValue CmdLoad_C=0,CmdUnload_C=1
smonit ran the other way (from 100 to 0)
Screen output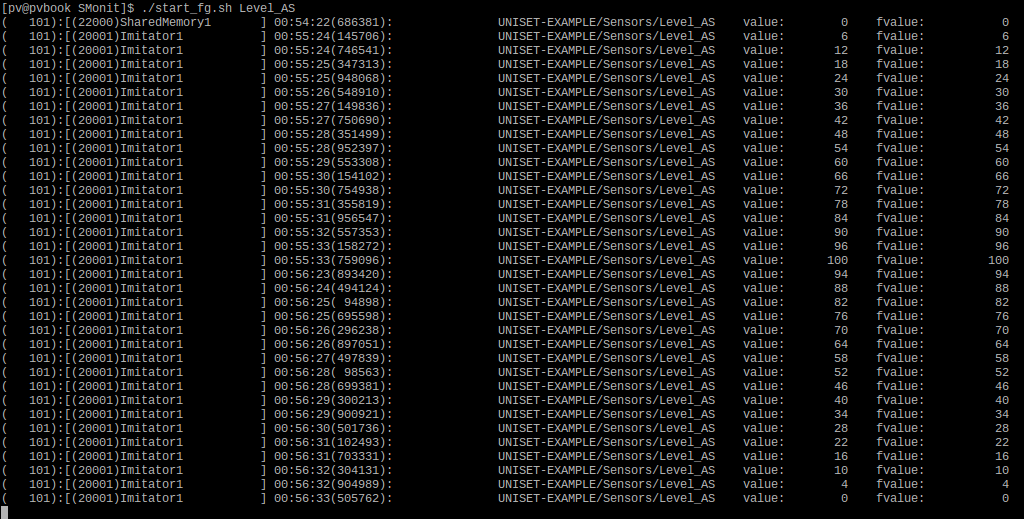
Monitoring object internal variables (vmonit)
Now I will describe a mechanism that allows you to view the internal variables of an object. In general, everything is very simple. Knowing the identifier or name of the object, you can simply request information from it.
So, everything is up and running. Let's see what the Imitator1 object shows us.
We go into src / Services / Administrator and run the command ./oinfo Imitator1
Screen output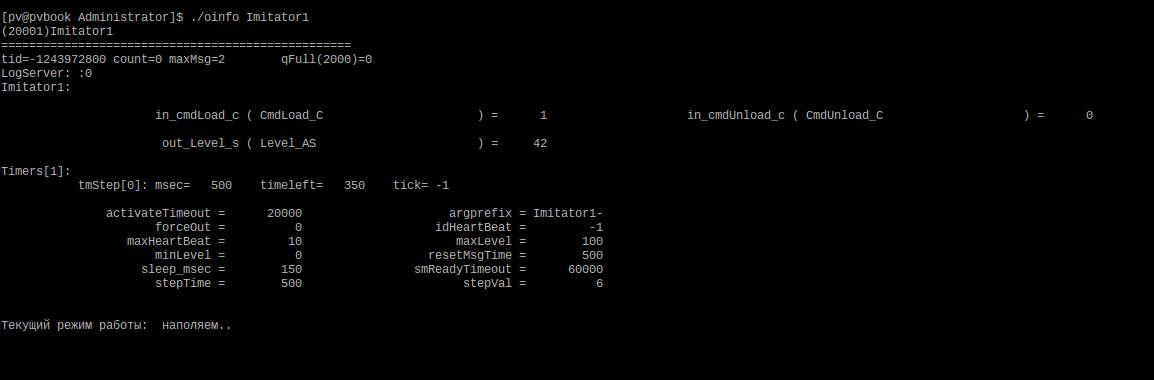
As you can see from the output, the oinfo command allows you to see
- The state of all inputs and outputs of the object with bindings to sensors ( internal in_, out_ variables)
- The current list of working timers, with the remaining operating time, etc.
- Values of all variables with which the process is started ( declared in src.xml )
- Internal information on the object (message queue size, what was the maximum, were there any overflows)
- As well as user information
I’ll say a little more about user information ...
Each object (more precisely, the class skeleton) has a special function
virtualstd::stringgetMonitInfo() override;
redefining which, you can display your information in the form of text (string). In this case, the simulator, for example, writes “Current Operating Mode: Fill” (or “empty”) . You can write something more complicated.
An example implementation of a function in a simulator
string Imitator::getMonitInfo()
{
	ostringstream s;
	s << "Текущий режим работы: " ;
	if( in_cmdLoad_c )
		s << " наполяем.." << endl;
	elseif( in_cmdUnload_c )
		s << " опустошаем.." << endl;
	returnstd::move(s.str());
}
Adding your variables to the information output
Of course, when you write your management process, most likely you will have, in addition to the variables declared in the xml file, some other class fields of your own. And of course you will want to follow (display information) about the current state and your variables as well. There is nothing easier . Suppose we add two command counters to the simulator.
Adding to Imitator.h
      ...
	private:
		unsignedint numCmdLoad = { 0 };
		unsignedint numCmdUnload = { 0 };
Then, if you want to see them in the output of oinfo , just make two magic calls in the constructor :
Adding to Imitator.cc
Imitator::Imitator( UniSetTypes::ObjectId id, xmlNode* cnode, conststring& prefix ):
	Imitator_SK(id, cnode, prefix)
{
	...
	vmonit(numCmdLoad);
	vmonit(numCmdUnload);
}
Those. just wrapped their variables in vmonit (xxx) . Macro magic , of course, could not be avoided here , but this is probably not very annoying ...
As a result, we will already see our variables on the screen ( cluttered among others ).
Display Screen (Recall ./oinfo)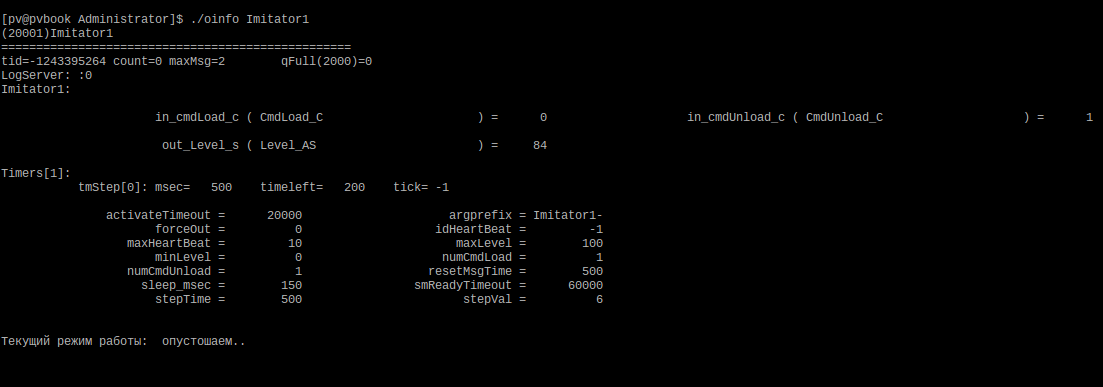
IMPORTANT: so far only standard simple types are supported: bool, int, long, etc., for everything else there is a universal function getMonitInfo ()
Remote reading of logs (built-in LogServer)
As you know, no matter how many debugging mechanisms exist, your favorite cout (
In the generated skeleton of the class, there is a special object for logs - log . It essentially has an interface like cout, only it is shared_ptr , so you need to use it as a pointer. for example
log->info() << "......information.." << endl;
or
log->crit() << "......critical" << endl;
The log has 15 levels, you can enable them “in parallel” (ie, for example info, warn, crit), you can specify the file where to write the logs, you can enable or disable the output of the date and time at the beginning of each line, etc. . In general, a lot of standard features. For each object, you can enable or disable logs by simply specifying a command line argument at startup
Log management through command line arguments
--ObjectName-log-add-levels info,warn,crit,level1,... - это добавление логов (к уже включённым)
--ObjectName-log-del-levels info,warn,crit,level1,...  - это удаление  логов (из включённых)
--ObjectName-log-set-levels info,warn,crit,level1,...  - это установка логов (взамен текущих)
But all this would not be so interesting if it were not for the presence of such a mechanism as LogServer . At each site there is a built LogServer, which is not run by default, it does not consume resources, respectively, and generally can not be seen in any way. But a simple command line argument
--ObjectName-run-logserver
we can activate it. By default, it runs on localhost , and uses the object identifier as the port. But you can also force the host and port to start.
Commands to override host and port
--ObjectName-logserver-host  xxx
--ObjectName-logserver-port  zzz
After the object is running LogServer, we can read its logs, and remotely . Just connecting to the specified host and port. There is a special utility uniset2-log for reading logs . Using it, in addition to reading the logs, you can also control the level of log output, writing to a file, etc., i.e. exercise full control over the logs of the object. This is a very convenient mechanism, as Allows you to enable and disable the logs without restarting the program ( and you often cannot stop the process, but you really need to see what is going on inside).
... let's just show you ...
So, everything is started, and we added a line to the start_fg.sh simulator
--Imitator1-run-logserverBy the way, in the output of ./oinfo , if someone has not noticed, information is displayed on whether LogServer is running. But let me show you again ( go to the src / Services / Administator / directory and run the ./oinfo Imitator1 command ).
Display object information (pay attention to LogServer)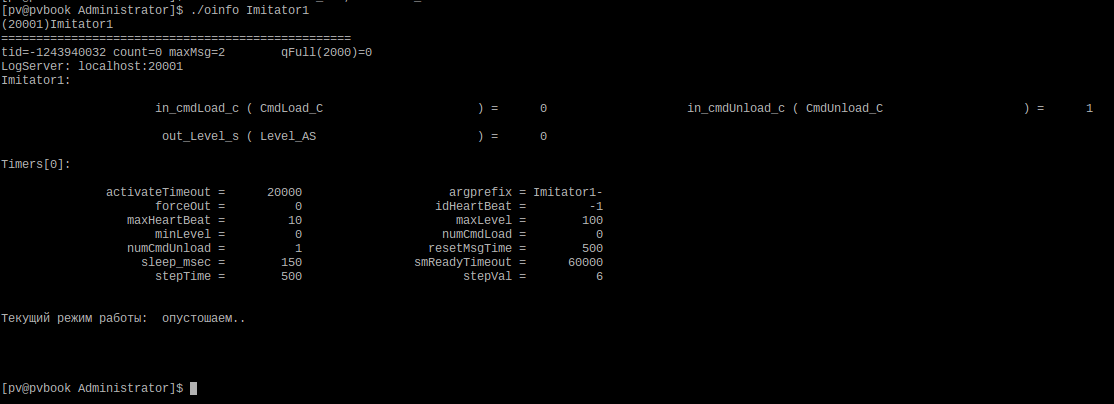
So logserver is running on localhost and port 20001 . But by default (unless, of course, the developer forcibly turns them on) , the logs are disabled. Accordingly, we will not just connect, but immediately also turn on all (any) logs in order to immediately begin to see them . Let's connect (add -v switch to see debug information about who we are connecting to)
uniset2-log -i localhost -p 20001 -v -a any
I added a log (level 3) to the timer function, for output, to demonstrate operation.
Additive in Imitator.cc (mylog3)
void Imitator::timerInfo( const UniSetTypes::TimerMessage* tm )
{
	if( tm->id == tmStep )
	{
		if( in_cmdLoad_c ) // значит наполняем..
		{
			mylog3 << myname << "(timerInfo): таймер(" << tmStep << ").. наполняем" << endl;
			out_Level_s += stepVal;
			if( out_Level_s >= maxLevel )
			{
				out_Level_s = maxLevel;
				askTimer(tmStep,0); // останавливаем таймер (и работу)
			}
			return;
		}
		if( in_cmdUnload_c ) // значит опустошаем
		{
			mylog3 << myname << "(timerInfo): таймер(" << tmStep << ")... опустошаем" << endl;
			out_Level_s -= stepVal;
			if( out_Level_s <= minLevel )
			{
				out_Level_s = minLevel;
				askTimer(tmStep,0); // останавливаем таймер (и работу)
			}
			return;
		}
	}
}
Then we connect (as indicated above) and in another console ( go to src / Services / Administrator ) we set the command
./setValue CmdLoad_C=1,CmdUnload_C=0
./setValue CmdLoad_C=0,CmdUnload_C=1
And here is what we will see in the logs ( remotely readable )
Reading logs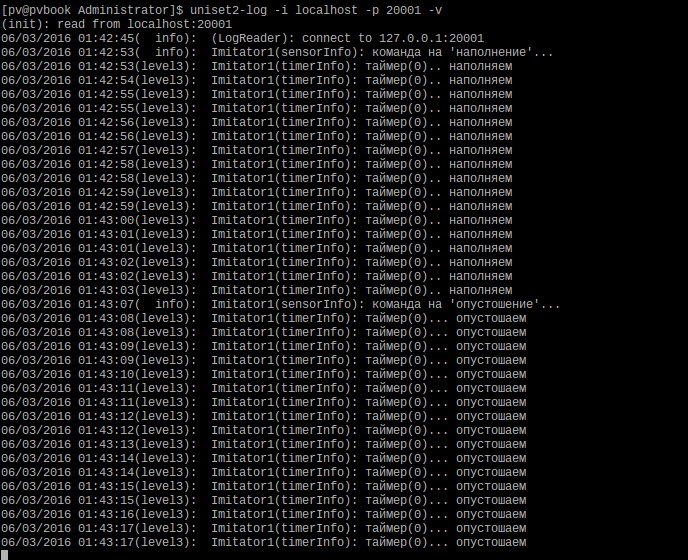
Taking the opportunity to read the logs remotely, it is important not to forget that if you turned them on , it would be nice to turn them off too, because the logs should not work in a real system, input / output is an expensive pleasure. And yet, I’ll show you a little opportunity that I didn’t reveal before.
- LogAgregator - an object that allows you to aggregate logs from several objects and manage them "centrally"
- LogAgregatore support for regular expressions (C ++ 11), which allow more flexibility in choosing which logs ( from which objects ) we want to read
- The ability to specify several commands in uniset2-log at once to enable some logs, disable others and, for example, read third ones. All this with one team.
In a real application, LogServer of course runs one on all objects (within a single executable file), which at the same time are arranged in a hierarchy using LogAgregator and can be flexibly managed.
A small summary
Talking about some mechanisms every time, I try to strike a balance between a bunch of details of internal functioning and ease of external use. Those. " Here are the ready-made teams, take and use - they work out of the box ." Therefore, I didn’t tell much, and maybe something remained not obvious ... I will try to answer your questions.
In general, if you do not assume that normal testing is much more than any “tests” (boundary cases, setting max, min, issuing commands at the same time, etc.), then we are done with setting up the simulator. The main thing was to demonstrate the debugging tools included with libuniset2:
- utilities for working with sensors and monitoring their status
- mechanism for remotely viewing the state of internal variables of an object
- remote reading and logging control mechanism (for each object)
The work of our management process can be adjusted in approximately the same way, but I’ll better show the adjustment of the control algorithm, using the more advanced way of setting up an example — writing functional tests using uniset2-testsuite . About this in the next part ...
Well, in the end, as usual, references: