The benefits of big data technology in everyday life
Among many researchers and developers, there is an opinion that the tools for processing big data in the field of machine learning are often redundant - you can always make a sample, drive it into memory and use your favorite R, Python and Matlab. But in practice, there are problems when it’s difficult to process in this style even a relatively small amount of data, a couple of gigabytes in size, and that is where the very “big data” technologies can help.
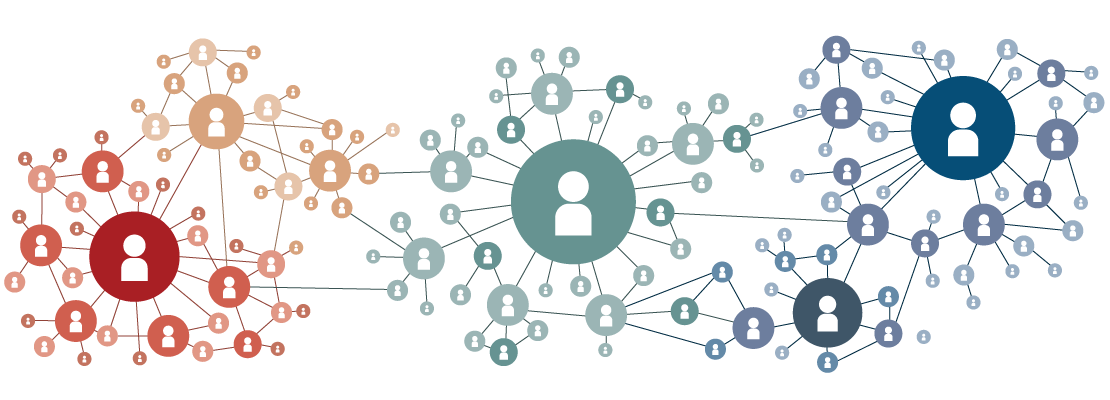
A good illustrative example of such a task is the task of our SNA Hakathon 2016 contest : given a social graph of one million users and their demographics. The task is to find hidden connections in this column.. The size of the provided graph is only two gigabytes in GZip and, it would seem, the use of big data technologies is not justified here, but this is only at first glance.
One of the most important “features” in the task of finding hidden connections in a social graph is the number of common friends. And in terms of calculation, this is a very difficult “feature” - the number of nodes between which there are paths of length 2 is several orders of magnitude greater than the number of direct links in the graph. As a result, during the calculation, the graph “explodes” and turns from a sparse matrix into two gigabytes into a dense terabyte matrix .
It would seem that in order to solve this problem it’s just right to raise a small cluster, but you should not hurry: having adopted the principles of processing big data and the corresponding technologies, the problem can be solved on an ordinary laptop. From the principles we take "divide and conquer" and "chop tail immediately", and as a tool - Apache Spark .
What is the problem?
The graph open for analysis is presented in the form of an adjacency list (a list of neighbors is given for each vertex) and asymmetric (not all outgoing vertices know outgoing arcs). The obvious way to calculate the number of mutual friends between the vertices in this graph is as follows:

- We translate the graph into a list of pairs;
- Join them a list of couples for themselves by a “common friend”;
- Summarize the number of occurrences of each pair.
The advantages of this approach, of course, include simplicity - at Spark this solution will take 5 lines. But he has much more minuses. Already at the second step, when implementing join-a, a shuffle (transfer of data between different stages of processing) occurs , which very quickly exhausts the resources of the local storage. And if all of a sudden your laptop still has enough space for it, then it will definitely not be enough for shuffle in the third stage.
To cope with the task, you need to break it into pieces (“divide and conquer”) and filter the results with a small number of common friends (“chop tail immediately”). But to fulfill both conditions is immediately problematic - when calculating the number of mutual friends only on a part of the graph, we get an incomplete picture and cannot adequately apply the filter ...
Where is the solution?
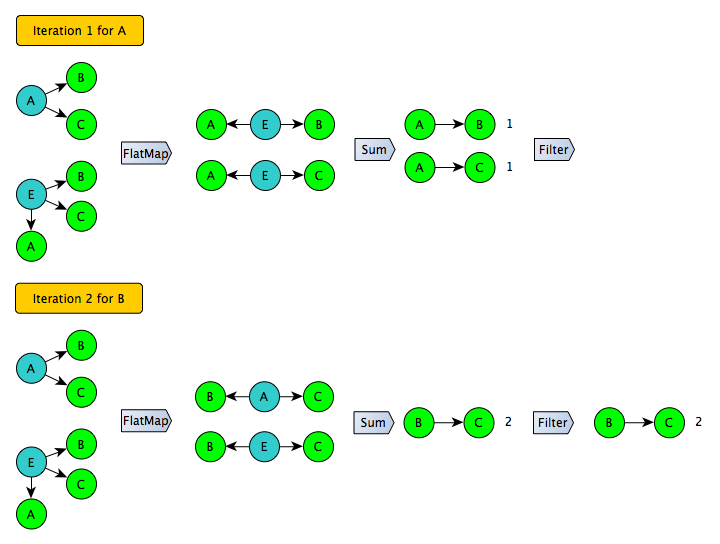
Let's try to look at the problem from the other side. The most troubles are the join of a list of pairs in the second stage: the format of the list of pairs itself is inefficient in terms of size, moreover, one of the join-a sides cannot be filtered without distorting the result. Is it possible to do without converting to a list of pairs and join-a? Yes, if you use the principle of "I am a common friend to my two friends." In this case, we iterate over the adjacency list for each of the friends list and generate all the pairs, and then count how many times each of the pairs appeared in the whole system - as a result, the problem is solved using one shuffle :)
Developing this idea, it is not difficult to take the next step: instead of generating all possible pairs, you only need to generate pairs for a certain subset of users on the left side (for example, with even identifiers). Further, this procedure can be repeated several times and get full coverage. At the same time, at each iteration, you can safely apply a filter to cut off the “long tail” - for users in this subset, the numbers are obtained exactly.
This approach works well for a symmetric graph, but the graph presented at SNA Hakathon 2016 is asymmetric - for some users, only incoming arcs are known. To use this trick, the graph must first be expanded:

The conversion result can already be saved and used as an input for an iterative algorithm:
Is the game worth the candle?
It was on this graph that counting the number of common friends “head on” took 1 hour on a cluster of 100 servers. The optimized iterative option worked for 4 and a half hours on one dual-core laptop. These figures allow us to conclude that the “forehead” option is acceptable only for large enough companies and / or research teams, while an optimized option can be launched by almost anyone. In addition, all the necessary code and instructions are publicly available on GitHub .
Are those “big data technologies” really necessary in this scheme? Can the same thing be repeated in R or Python? Theoretically, nothing is impossible. But in practice, the implementation will have to solve a large number of problems and get acquainted with many very specific packages and functions. The resulting code will be larger and clearly more expensive to develop and maintain.
In fact, even if we ignore this example, the use of Apache Spark in many cases may be preferable to R and Python: parallel processing of data is natural for Spark, which provides higher speed, the code can be transferred to the cluster in Google Cloud with virtually no changes ( case study) and applied to a significantly larger amount of data. Well, the collection of supported machine learning algorithms, although still inferior to the "grandparents," is already quite impressive and constantly updated ( MLLib ).
Time to learn Scala :)