Architecture and technological approaches to BigData processing using the example of “1C-Bitrix BigData: Personalization”
In September this year, a conference dedicated to big data was held in Kiev - BigData Conference . According to the old tradition, we publish on our blog some materials presented at the conference. And we start with a report by Alexander Demidov .
Now, many online stores have realized that one of the main tasks for them is to increase their own effectiveness. Let's take two stores, each of which attracted 10 thousand visitors, but one made 100 sales and the other 200. It seems that the audience is the same, but the second store works twice as efficiently.
The topic of data processing, processing models of store visitors is relevant and important. How do traditional models work in which all connections are manually established? We make the correspondence of goods in the catalog, make bundles with accessories, and so on. But, as the common joke says:

It is impossible to provide for such a connection and sell to the buyer something completely unrelated to the desired one. But then, to the next woman who is looking for a green coat, we can recommend the same red bag based on a similar model of behavior of the previous visitor.
This approach illustrates very clearly the case of the Target retail chain. Once an angry visitor came to them and called for a manager. It turned out that the online store in its mailing to the minor daughter of this same visitor sent an offer for pregnant women. Father was extremely indignant at this fact: “What are you doing? She is a minor, how pregnant is she? ” He had a fight and left. After a couple of weeks, it turned out that the girl was actually pregnant. Moreover, the online store learned about this earlier than herself, based on an analysis of her preferences: the products she ordered were compared with models of other visitors who acted in approximately the same scenarios.
The result of the work of analytical algorithms for many looks like magic. Naturally, many projects want to implement such analytics. But there are few players on the market with a large enough audience so that you can really count and predict something. Basically, these are search engines, social networks, large portals and online stores.
When we thought about introducing Big Data Analysis into our products, we asked ourselves three key questions:
There are very few large online stores with millions of audiences, including on our platform. However, the total number of stores using "1C-Bitrix: Site Management" is very large, and together they cover an impressive audience in various market segments.
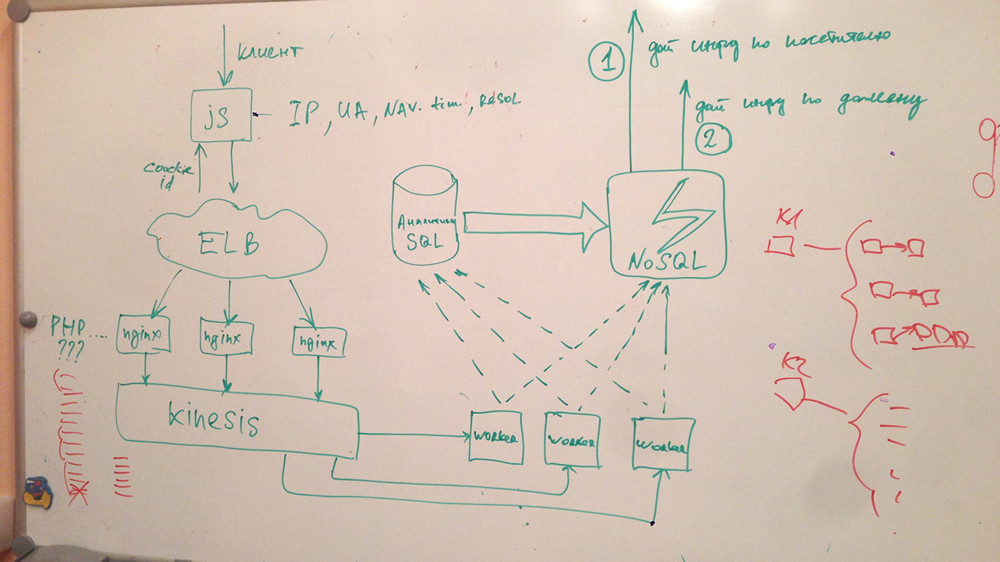
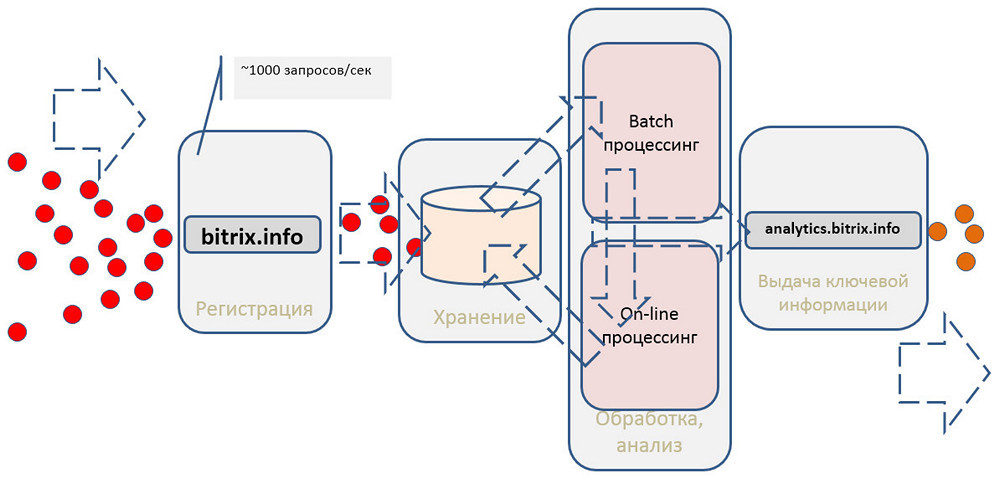
As a result, we organized an internal startup within the framework of the project. Since we did not know from which end to take, we decided to start by solving a small problem: how to collect and store data. This small prototype was drawn in 30-40 minutes:
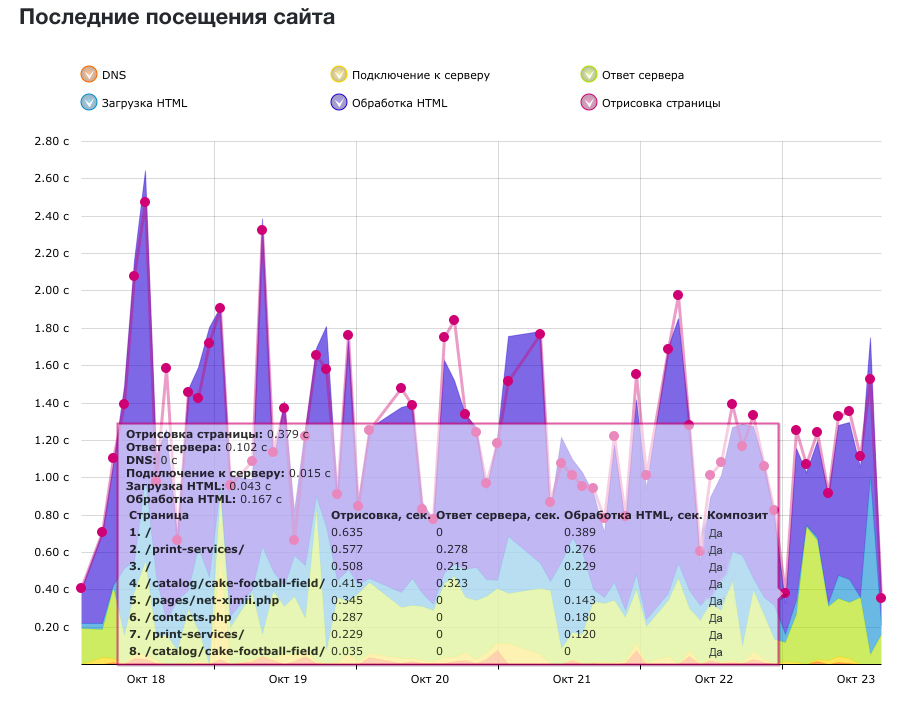
There is the term MVP - minimum viable product, a product with minimal functionality. We decided to start collecting technical metrics, page loading speed from visitors, and provide users with analytics on the speed of their project. This had nothing to do with either personalization or BigData, but it allowed us to learn how to handle the entire audience of all visitors.
In JavaScript, there is a tool called the Navigation Timing API, which allows you to collect client-side data on page speed, DNS resolve duration, network data transfer, work on the backend, and page rendering. All this can be broken down into the most different metrics and then to give out analytics.

We figured how many stores are working on our platform, how much data we will need to collect. Potentially, these are tens of thousands of sites, tens of millions of hits per day, 1000-1500 requests to write data per second. There is a lot of information, where to save it, then to work with it? And how to provide the user with the maximum speed of the analytical service? That is, our JS counter is not only obliged to give an answer very quickly, but also should not slow down the page loading speed.
Our products are mainly built on PHP and MySQL. The first desire was to simply save all statistics in MySQL or in any other relational database. But even without tests and experiments, we realized that this was a dead end. At some point, we simply do not have enough performance either when recording or when fetching data. And any failure on the side of this base will lead to the fact that either the service will work extremely slowly, or will generally be inoperative.

We looked at various NoSQL solutions. Since we have a large infrastructure deployed at Amazon, we first drew attention to DynamoDB. This product has a number of advantages and disadvantages compared to relational databases. When recording and scaling DynamoDB works better and faster, but it will be much more difficult to make some complex selections. There are also issues with data consistency. Yes, it is provided, but when you need to constantly select some data, it is not a fact that you will always choose the most relevant.
As a result, we began to use DynamoDB for aggregation and subsequent delivery of information to users, but not as a storage for raw data.
We considered columnar databases that no longer work with rows, but with columns. But due to poor performance during recording, I had to reject them.
Choosing the right solution, we discussed a variety of approaches, starting with writing a text log :) and ending with the queue services ZeroMQ, Rabbit MQ, etc. However, in the end, they chose a completely different option.
It so happened that by that time Amazon had developed the Kinesis service, which was the best suited for the initial data collection. It is a kind of large high-performance buffer where you can write anything you want. He very quickly receives data and reports on a successful recording. Then, in the background, you can safely work with information: make selections, filter, aggregate, etc.
Judging by the data provided by Amazon, Kinesis should have been able to easily cope with our workload. But a number of questions remained. For example, the end user — a site visitor — could not write data directly to Kinesis; To use the service, you must “sign” requests using the relatively sophisticated authorization mechanism in Amazon Web Services v. 4. Therefore, it was necessary to decide how to make Frontend send data to Kinesis.
Considered the following options:
As a result, we decided to bet on Lua.
The language is very flexible, it allows you to process both the request and the response. It can be integrated into all phases of request processing in nginx at the rewrite, logging level. Any subqueries, non-blocking, can be written on it using some methods. There are a bunch of additional modules for working with MySQL, with cryptographic libraries, and so on.
In two or three days, we studied the functions of Lua, found the necessary libraries, and wrote a prototype.
On the first stress test, of course ... everything fell. I had to configure Linux for heavy loads - to optimize the network stack. This procedure is described in many documents, but for some reason is not done by default. The main problem was the lack of ports for outgoing connections with Kinesis.
We have expanded the range, set timeouts. If you use a built-in firewall, such as Iptables, then you need to increase the size of the tables for it, otherwise they will overflow very quickly with so many requests. At the same time, you need to adjust the size of any backlogs for the network interface and for the TCP stack in the system itself.
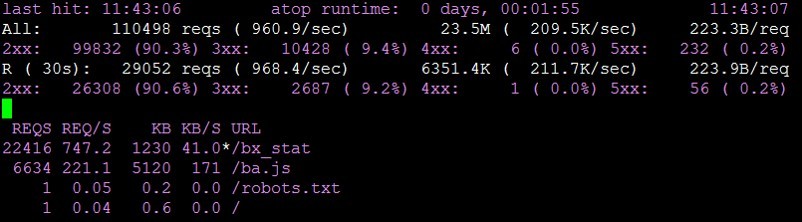
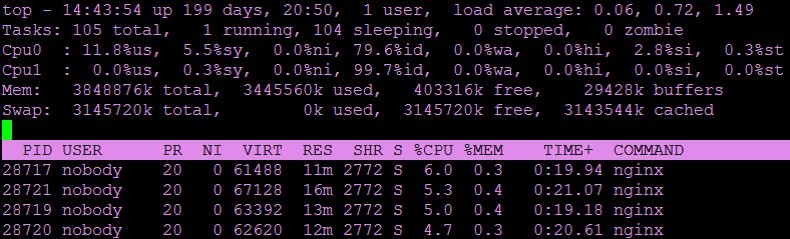
After that, everything worked successfully. The system began to process 1000 requests per second, and for this we needed one virtual machine.
At some point, we still hit the ceiling and began to receive errors “
It was possible to solve the problem by setting up keepalive connections in nginx.
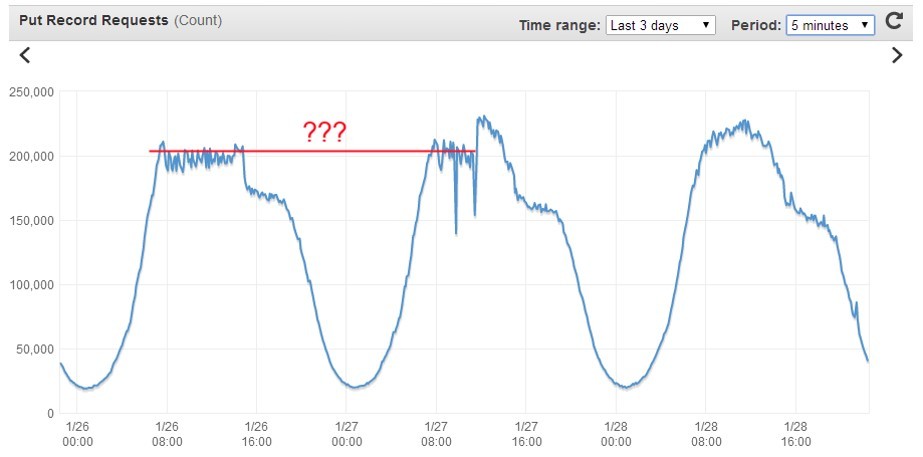
A machine with two virtual cores and four gigabytes of memory easily processes 1000 requests per second. If we need more, then we either add resources to this machine, or scale it horizontally and put 2, 3, 5 of such machines behind any balancer. The solution is simple and cheap. But the main thing is that we can collect and save any data and in any quantity.
It took about a week to create a prototype that collects up to 70 million hits per day. The ready-made service “Site Speed” for all clients of “1C-Bitrix: Site Management” was created in one month by the efforts of three people. The system does not affect the speed of displaying sites, has internal administration. The cost of Kinesis services is $ 250 per month. If we did everything on our own hardware, completely wrote our decision on any storage, it would have turned out to be much more expensive in terms of maintenance and administration. And much less reliable.

The general scheme of the system can be represented as follows:
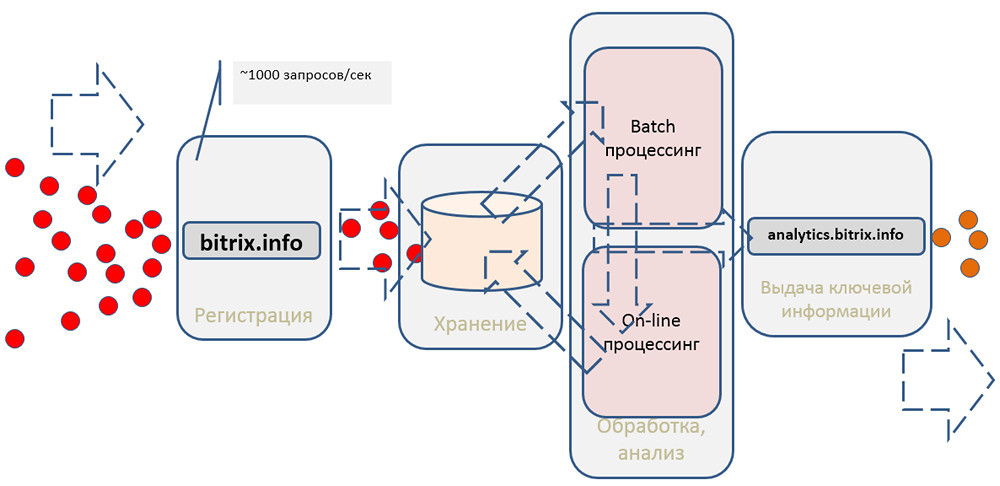
It should register events, save, perform some processing and give something to clients.
We created a prototype, now we need to move from technical metrics to the assessment of business processes. In fact, it doesn’t matter to us what we collect. You can transfer anything:
etc.
Hits can be classified by event type. What are we interested in terms of the store?

We can collect and link all technical metrics to business metrics and the subsequent analytics that we need. But what to do with this data, how to process it?
A few words about how recommendation systems work.
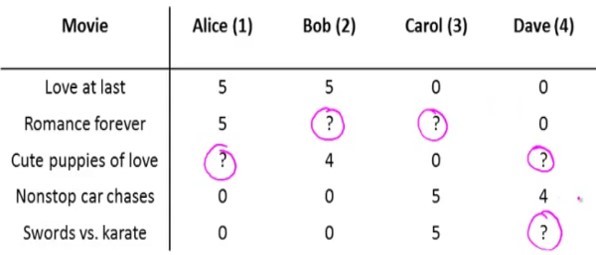
The key mechanism that allows visitors to recommend certain products is the collaborative filtering mechanism. There are several algorithms. The simplest is user-user matching. We compare the profiles of two users, and based on the actions of the first one, we can predict for another user who performs similar actions that at the next moment he will need the same product that the first user ordered. This is the simplest and most logical model. But she has some cons.
Amazon for its online store has come up with another algorithm - item-item: the correspondence is established not for users, but for specific products, including those that are purchased with the "main" ones. This is most relevant for increasing sales of accessories: you can recommend a cover, charging, something else to the person who bought the phone. This model is much more robust because product matching rarely changes. The algorithm itself is much faster.
There is another approach - content based recommendations. The sections and products that the user was interested in and his search queries are analyzed, after which the user’s vector is built. And as hints, those products are offered whose vectors are closest to the user's vector.

You can not choose any one algorithm, but use them all, combining with each other. What tools are there for this:
In our project, we opted for Spark.
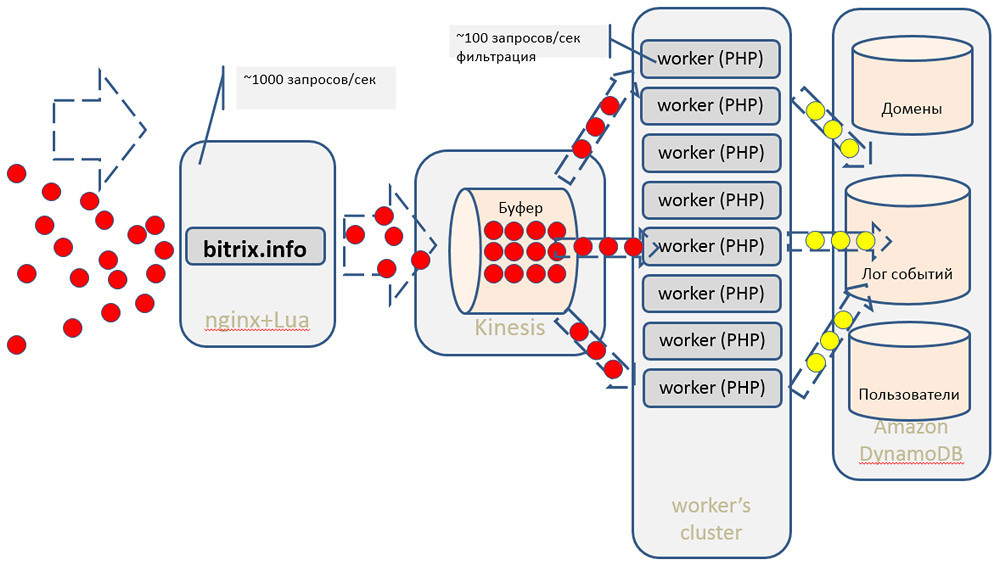
We read data from Kinesis with simple workers written in PHP. Why PHP? Just because it is more familiar to us, and it is more convenient for us. Although Amazon has an SDK to work with their services for almost all popular languages. Then we do the initial filtering of hits: we remove numerous hits of search bots, etc. Next, we send the statistics that we can immediately give online, in Dynamo DB.
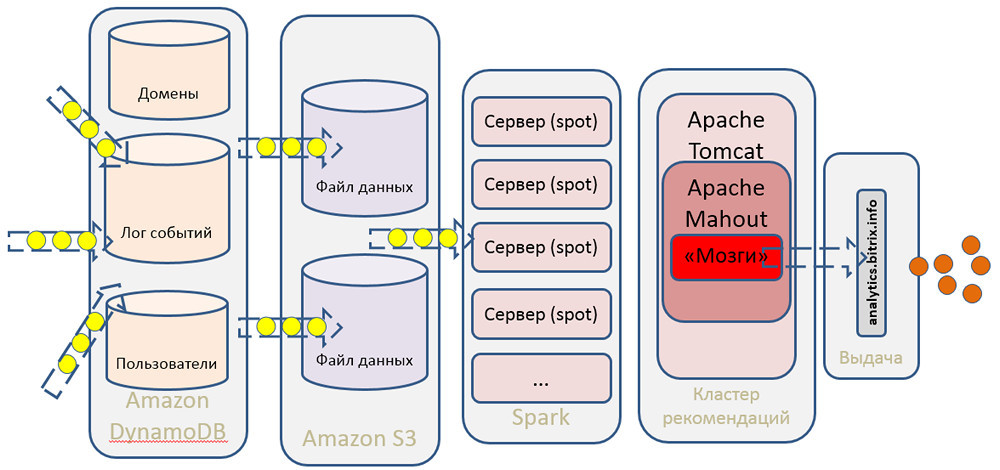
The main data array for subsequent processing, for building models in Spark, etc. we save in S3 (instead of traditional HDFS we use Amazon storage). Subsequent mathematics, collaborative filtering and machine learning algorithms are handled by our cluster of recommendations, built on the basis of Apache Mahout.
Using Amazon AWS cloud infrastructure and off-the-shelf services saves us a ton of effort, resources and time. We do not need a large staff of admins to service this system, we do not need a large development team. Using all of the above components allows you to manage a very small number of specialists.
In addition, the entire system is much cheaper. All of our terabytes of data is more profitable to put in S3 than to lift separate servers with disk storage, take care of backup, etc. It is much easier and cheaper to raise Kinesis as a ready-made service, start using it literally in minutes or hours, than to configure the infrastructure, administer it, and solve some low-level maintenance tasks.
For the developer of an online store that works on our platform, all this looks like a certain service. To work with this service, a set of APIs is used, with which you can get useful statistics and personalized recommendations for each visitor.
We can help recommend similar products, which is convenient for selling accessories and some additional components:
Another useful mechanism is the top product by sales volume. You can argue that all this can be done without fussing with big data. In the store itself - yes, you can. But the use of our statistics allows you to remove a considerable proportion of the load from the base of the store.
The client can use all of these tools in any combination. The cloud service of personal recommendations is fully integrated with the 1C-Bitrix: Site Management platform itself, the store developer can very flexibly manage the block of issued recommendations: “mix” the necessary items of goods that always need to be shown; use sorting by price or by some other criteria, etc.
When building a user’s model, all statistics of his views are taken into account, and not just the current session. Moreover, all models are depersonalized, that is, each visitor exists in the system only in the form of a faceless ID. This allows you to maintain confidentiality.
We do not divide visitors according to the stores they visit. We have a single database, and each visitor is assigned a single identifier, no matter what stores he goes to. This is one of the main advantages of our service, because small shops do not have sufficiently large statistics that can reliably predict user behavior. And thanks to our single database, even a store with 10 visits per day has the opportunity with high probability of success to recommend products that will be of interest to this particular visitor.
Data can be outdated, so when building a user model, we will not take into account statistics a year ago, for example. Only data for the last month is taken into account.
What do our tools look like on the site?
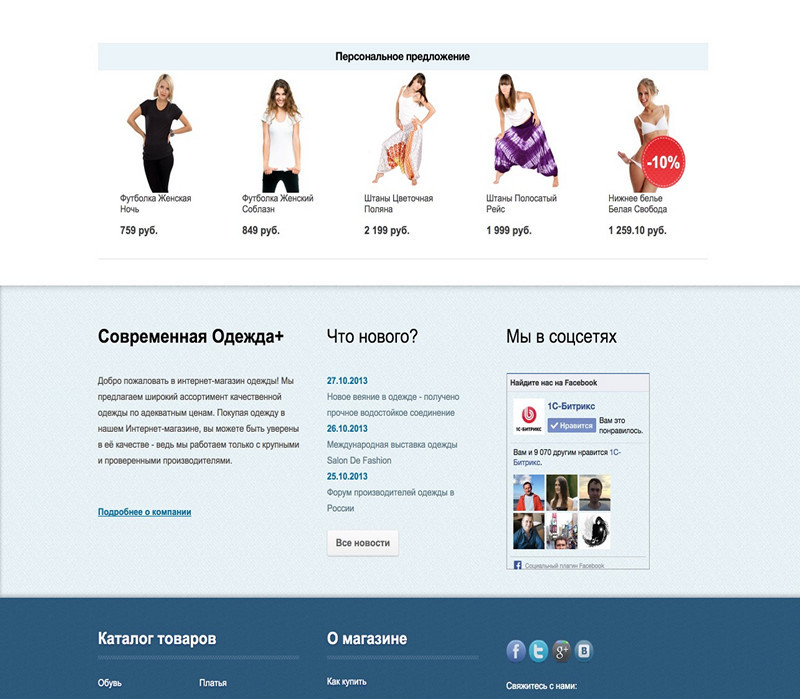
A block of personal recommendations, which can be on the main page. It is individual for each visitor to the site.
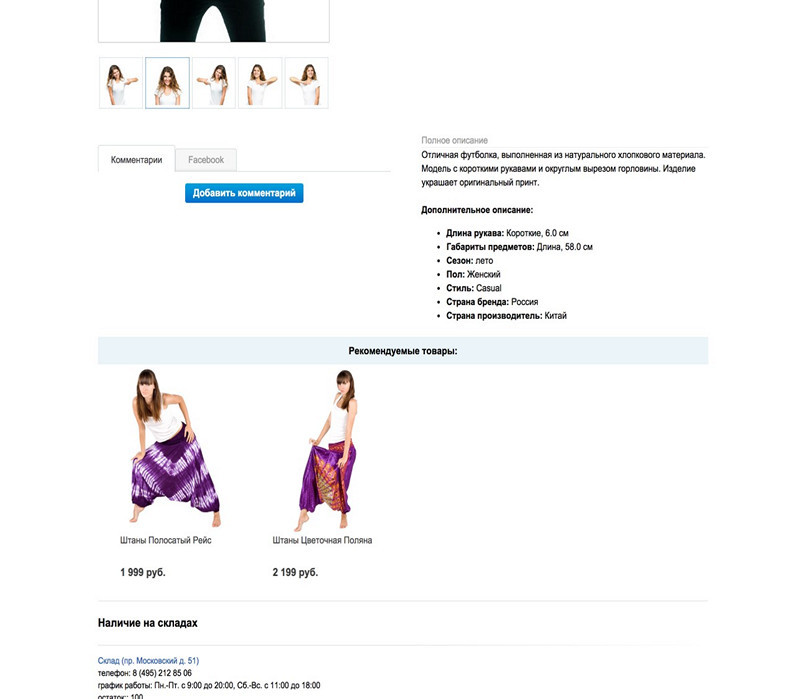
It can also be displayed in the card for a specific product:

Example of a block of recommended products:
Blocks can be combined, looking for the most efficient combination.
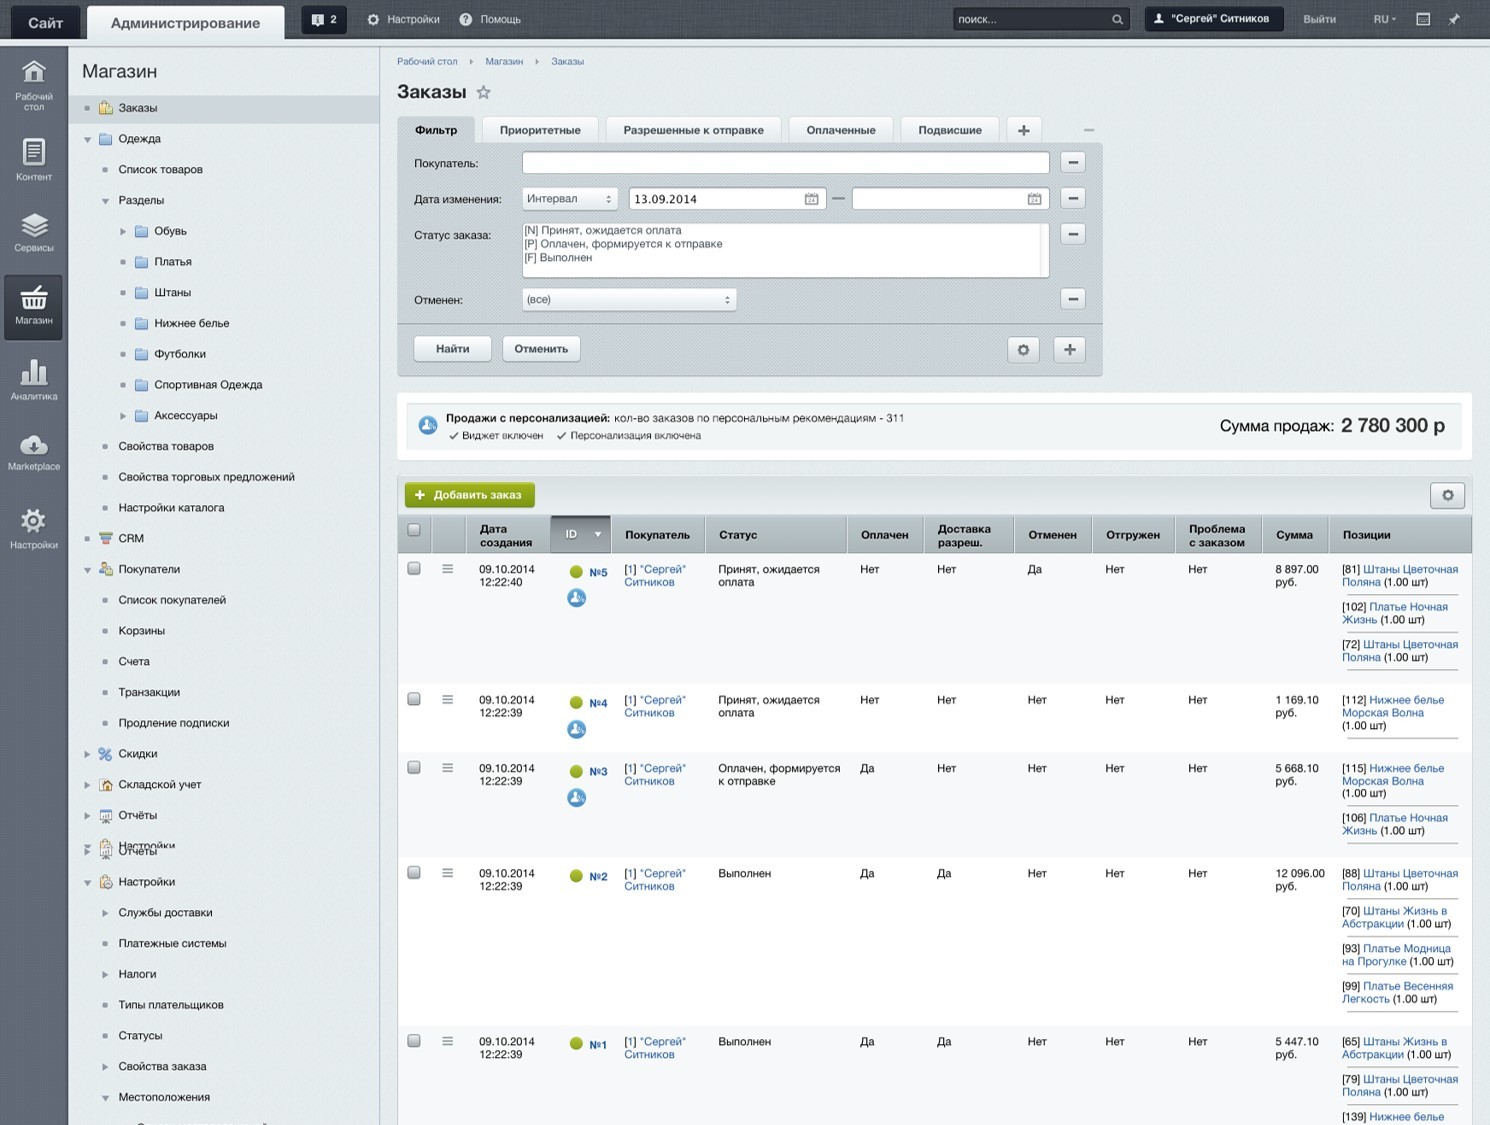
Orders sold on a personal recommendation are noted in the admin panel.
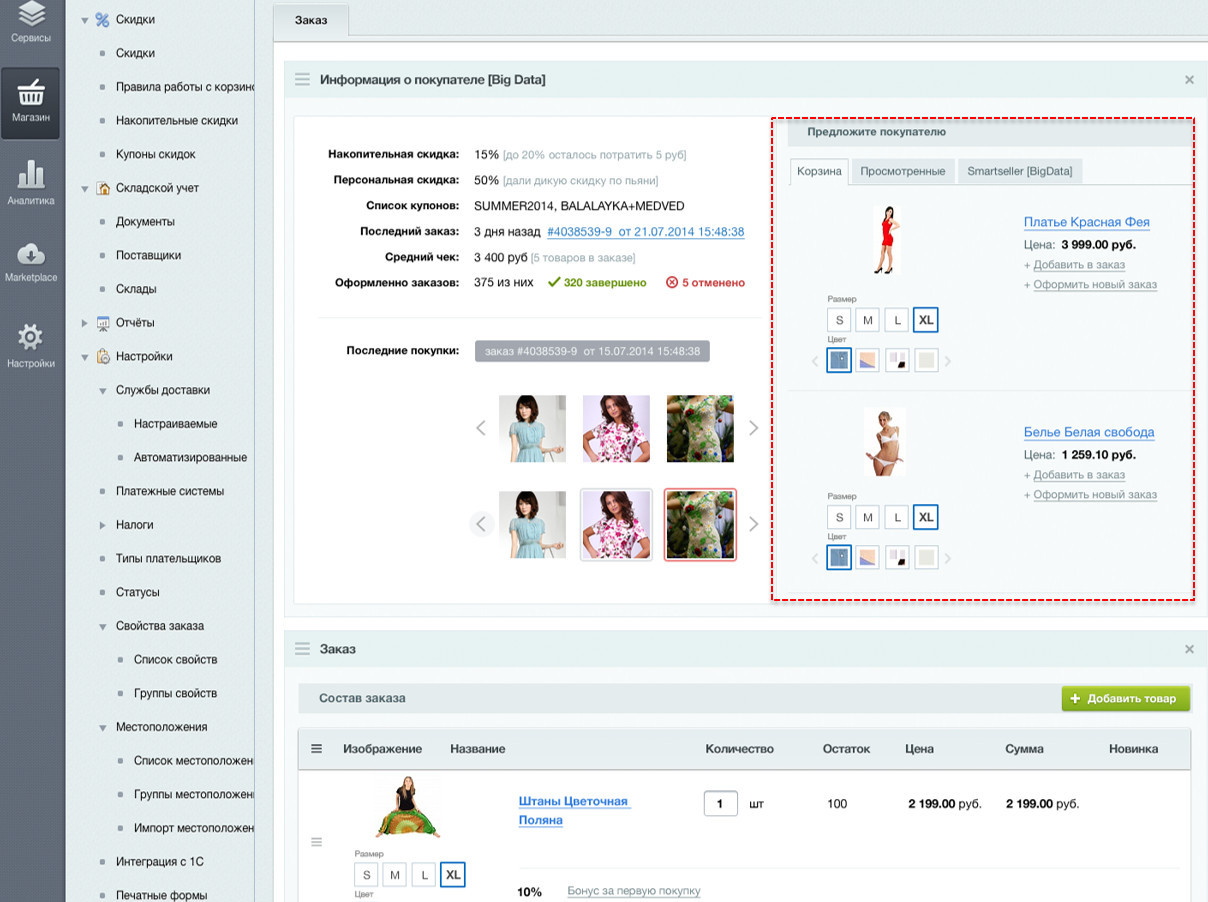
The employee processing the orders can immediately display in the admin panel a list of goods that can be recommended to the buyer at checkout.
Unlike our tools, third-party recommendation services have an important drawback - a fairly small audience. To use these services, you need to insert a counter and a widget to display recommendations. While our toolkit is very closely integrated with the platform, and allows you to refine the recommendations issued to visitors. For example, a store owner might sort recommendations by price or availability; mix in the issuance of other goods.
The main question arises: how effectively does all of the above work? How do you measure performance?
Using A / B tests to work with personalized recommendations in the near future will be available to owners of online stores, it will be possible to select and configure the necessary metrics right in the admin panel, collect data for some time and estimate the difference by comparing conversions of different audiences.
According to our data, our conversion growth is from 10 to 35%. Even 10% is a huge indicator for an online store in terms of investing. Instead of pushing more money into advertising and engagement, users work more effectively with their audience.
But why is there such a wide variation in conversion growth? It depends on the:
In a catalog with few items and few accessories, growth will be less. In stores offering many additional positions, growth will be higher.
Where else can you use such tools, in addition to online stores? In almost any Internet project that wants to increase its audience. After all, a commodity unit can be not only something tangible. A product can be an article, any textual material, a digital product, a service, whatever.
Using the same models, you can evaluate the audience and its willingness to switch, for example, from free to paid tariffs, and vice versa. Or you can assess the likelihood of users leaving to competitors. This can be prevented by some additional discount, marketing campaign. Or if the client is about to buy a product or service, then you can make some interesting offer, thereby increasing audience loyalty. Naturally, all this can be used with trigger links as flexibly as possible. For example, a user who viewed a product, put it in a basket, but did not place an order, can make a personal offer.
Currently, 17 thousand stores operate on our platform, the system calculates about 440 million events per month. The total product catalog contains about 18 million items. The proportion of orders on the recommendation of the total number of orders: 9–37%.
As you can see, there is a lot of data, and they do not lie dead weight, but work and bring benefits. For stores operating on our platform, this service is now free. We have an open API, which can be modified on the side of Backend'a and give more flexible recommendations to specific visitors.
Now, many online stores have realized that one of the main tasks for them is to increase their own effectiveness. Let's take two stores, each of which attracted 10 thousand visitors, but one made 100 sales and the other 200. It seems that the audience is the same, but the second store works twice as efficiently.
The topic of data processing, processing models of store visitors is relevant and important. How do traditional models work in which all connections are manually established? We make the correspondence of goods in the catalog, make bundles with accessories, and so on. But, as the common joke says:
It is impossible to provide for such a connection and sell to the buyer something completely unrelated to the desired one. But then, to the next woman who is looking for a green coat, we can recommend the same red bag based on a similar model of behavior of the previous visitor.
This approach illustrates very clearly the case of the Target retail chain. Once an angry visitor came to them and called for a manager. It turned out that the online store in its mailing to the minor daughter of this same visitor sent an offer for pregnant women. Father was extremely indignant at this fact: “What are you doing? She is a minor, how pregnant is she? ” He had a fight and left. After a couple of weeks, it turned out that the girl was actually pregnant. Moreover, the online store learned about this earlier than herself, based on an analysis of her preferences: the products she ordered were compared with models of other visitors who acted in approximately the same scenarios.
The result of the work of analytical algorithms for many looks like magic. Naturally, many projects want to implement such analytics. But there are few players on the market with a large enough audience so that you can really count and predict something. Basically, these are search engines, social networks, large portals and online stores.
Our first steps in using big data
When we thought about introducing Big Data Analysis into our products, we asked ourselves three key questions:
- Will we have enough data?
- How will we process them? We do not have mathematicians on staff, we do not have sufficient competence to work with "big data."
- How to incorporate all this into existing products?
There are very few large online stores with millions of audiences, including on our platform. However, the total number of stores using "1C-Bitrix: Site Management" is very large, and together they cover an impressive audience in various market segments.
As a result, we organized an internal startup within the framework of the project. Since we did not know from which end to take, we decided to start by solving a small problem: how to collect and store data. This small prototype was drawn in 30-40 minutes:
There is the term MVP - minimum viable product, a product with minimal functionality. We decided to start collecting technical metrics, page loading speed from visitors, and provide users with analytics on the speed of their project. This had nothing to do with either personalization or BigData, but it allowed us to learn how to handle the entire audience of all visitors.
In JavaScript, there is a tool called the Navigation Timing API, which allows you to collect client-side data on page speed, DNS resolve duration, network data transfer, work on the backend, and page rendering. All this can be broken down into the most different metrics and then to give out analytics.
We figured how many stores are working on our platform, how much data we will need to collect. Potentially, these are tens of thousands of sites, tens of millions of hits per day, 1000-1500 requests to write data per second. There is a lot of information, where to save it, then to work with it? And how to provide the user with the maximum speed of the analytical service? That is, our JS counter is not only obliged to give an answer very quickly, but also should not slow down the page loading speed.
Recording and storing data
Our products are mainly built on PHP and MySQL. The first desire was to simply save all statistics in MySQL or in any other relational database. But even without tests and experiments, we realized that this was a dead end. At some point, we simply do not have enough performance either when recording or when fetching data. And any failure on the side of this base will lead to the fact that either the service will work extremely slowly, or will generally be inoperative.
We looked at various NoSQL solutions. Since we have a large infrastructure deployed at Amazon, we first drew attention to DynamoDB. This product has a number of advantages and disadvantages compared to relational databases. When recording and scaling DynamoDB works better and faster, but it will be much more difficult to make some complex selections. There are also issues with data consistency. Yes, it is provided, but when you need to constantly select some data, it is not a fact that you will always choose the most relevant.
As a result, we began to use DynamoDB for aggregation and subsequent delivery of information to users, but not as a storage for raw data.
We considered columnar databases that no longer work with rows, but with columns. But due to poor performance during recording, I had to reject them.
Choosing the right solution, we discussed a variety of approaches, starting with writing a text log :) and ending with the queue services ZeroMQ, Rabbit MQ, etc. However, in the end, they chose a completely different option.
Kinesis
It so happened that by that time Amazon had developed the Kinesis service, which was the best suited for the initial data collection. It is a kind of large high-performance buffer where you can write anything you want. He very quickly receives data and reports on a successful recording. Then, in the background, you can safely work with information: make selections, filter, aggregate, etc.
Judging by the data provided by Amazon, Kinesis should have been able to easily cope with our workload. But a number of questions remained. For example, the end user — a site visitor — could not write data directly to Kinesis; To use the service, you must “sign” requests using the relatively sophisticated authorization mechanism in Amazon Web Services v. 4. Therefore, it was necessary to decide how to make Frontend send data to Kinesis.
Considered the following options:
- Write a pure configuration on nginx that will be proxied to Kinesis. It didn’t work, the logic is too complicated.
- Nginx as Frontend + PHP-Backend. It turned out to be difficult and expensive in terms of resources, because with so many requests any Backend will sooner or later stop coping, it will have to be scaled horizontally. And we do not yet know whether the project will take off.
- Nginx + its module in C / C ++. Long and difficult in terms of development.
- Nginx + ngx_http_perl_module. Variant with a module that blocks requests. That is, the request that came in this thread blocks the processing of other requests. There are the same drawbacks as with the use of any Backend. In addition, the documentation for nginx directly stated: "The module is experimental, so anything is possible."
- Nginx + ngx_lua. At that time, we had not yet encountered Lua, but this module seemed curious. The piece of code you need is written directly to the nginx config in a language somewhat similar to JavaScript, or it is taken out in a separate file. Thus, you can implement the strangest, extraordinary logic that you need.
As a result, we decided to bet on Lua.
Lua
The language is very flexible, it allows you to process both the request and the response. It can be integrated into all phases of request processing in nginx at the rewrite, logging level. Any subqueries, non-blocking, can be written on it using some methods. There are a bunch of additional modules for working with MySQL, with cryptographic libraries, and so on.
In two or three days, we studied the functions of Lua, found the necessary libraries, and wrote a prototype.
On the first stress test, of course ... everything fell. I had to configure Linux for heavy loads - to optimize the network stack. This procedure is described in many documents, but for some reason is not done by default. The main problem was the lack of ports for outgoing connections with Kinesis.
/etc/sysctl.conf  (man sysctl)
# диапазон портов исходящих коннектов
net.ipv4.ip_local_port_range=1024 65535
# повторное использование TIME_WAIT сокетов
net.ipv4.tcp_tw_reuse=1
# время пребывания сокета в FIN_WAIT_2
net.ipv4.tcp_fin_timeout=15
# размер таблиц файрволла
net.netfilter.nf_conntrack_max=1048576
# длина очереди входящих пакетов на интерфейсе
net.core.netdev_max_backlog=50000
# количество возможных подключений к сокету
net.core.somaxconn=81920
# не посылать syncookies на SYN запросы
net.ipv4.tcp_syncookies=0
We have expanded the range, set timeouts. If you use a built-in firewall, such as Iptables, then you need to increase the size of the tables for it, otherwise they will overflow very quickly with so many requests. At the same time, you need to adjust the size of any backlogs for the network interface and for the TCP stack in the system itself.
After that, everything worked successfully. The system began to process 1000 requests per second, and for this we needed one virtual machine.
At some point, we still hit the ceiling and began to receive errors “
connect() to [...] failed (99: Cannot assign requested address) while connecting to upstream”, although the resources of the system have not yet been exhausted. According to LA, the load was close to zero, there was enough memory, the processor is far from overload, but they ran into something. It was possible to solve the problem by setting up keepalive connections in nginx.
upstream kinesis {
    server kinesis.eu-west-1.amazonaws.com:443;
    keepalive 1024;
}
    proxy_pass https://kinesis/;
    proxy_http_version 1.1;
    proxy_set_header Connection "";
A machine with two virtual cores and four gigabytes of memory easily processes 1000 requests per second. If we need more, then we either add resources to this machine, or scale it horizontally and put 2, 3, 5 of such machines behind any balancer. The solution is simple and cheap. But the main thing is that we can collect and save any data and in any quantity.
It took about a week to create a prototype that collects up to 70 million hits per day. The ready-made service “Site Speed” for all clients of “1C-Bitrix: Site Management” was created in one month by the efforts of three people. The system does not affect the speed of displaying sites, has internal administration. The cost of Kinesis services is $ 250 per month. If we did everything on our own hardware, completely wrote our decision on any storage, it would have turned out to be much more expensive in terms of maintenance and administration. And much less reliable.
Recommendations and personalization
The general scheme of the system can be represented as follows:
It should register events, save, perform some processing and give something to clients.
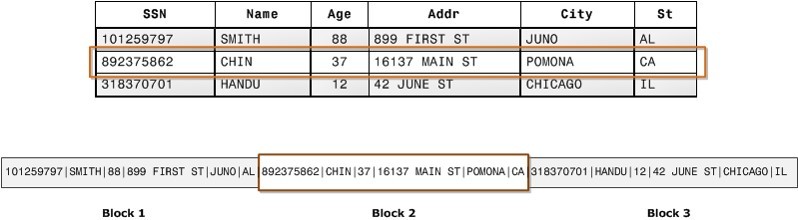
We created a prototype, now we need to move from technical metrics to the assessment of business processes. In fact, it doesn’t matter to us what we collect. You can transfer anything:
- Cookie
- Hash Licenses
- Domain
- Category, ID and product name
- Recommendation ID
etc.
Hits can be classified by event type. What are we interested in terms of the store?
We can collect and link all technical metrics to business metrics and the subsequent analytics that we need. But what to do with this data, how to process it?
A few words about how recommendation systems work.
The key mechanism that allows visitors to recommend certain products is the collaborative filtering mechanism. There are several algorithms. The simplest is user-user matching. We compare the profiles of two users, and based on the actions of the first one, we can predict for another user who performs similar actions that at the next moment he will need the same product that the first user ordered. This is the simplest and most logical model. But she has some cons.
- Firstly, there are very few users with the same profiles.
- Secondly, the model is not very stable. Users look at a variety of products, matching matrices are constantly changing.
- If we cover the entire audience of our online stores, then these are tens of millions of visitors. And in order to find matches for all users, we need to multiply this matrix by itself. And the multiplication of such millionth matrices is a non-trivial task in terms of the algorithms and tools that we will use.
Amazon for its online store has come up with another algorithm - item-item: the correspondence is established not for users, but for specific products, including those that are purchased with the "main" ones. This is most relevant for increasing sales of accessories: you can recommend a cover, charging, something else to the person who bought the phone. This model is much more robust because product matching rarely changes. The algorithm itself is much faster.
There is another approach - content based recommendations. The sections and products that the user was interested in and his search queries are analyzed, after which the user’s vector is built. And as hints, those products are offered whose vectors are closest to the user's vector.
You can not choose any one algorithm, but use them all, combining with each other. What tools are there for this:
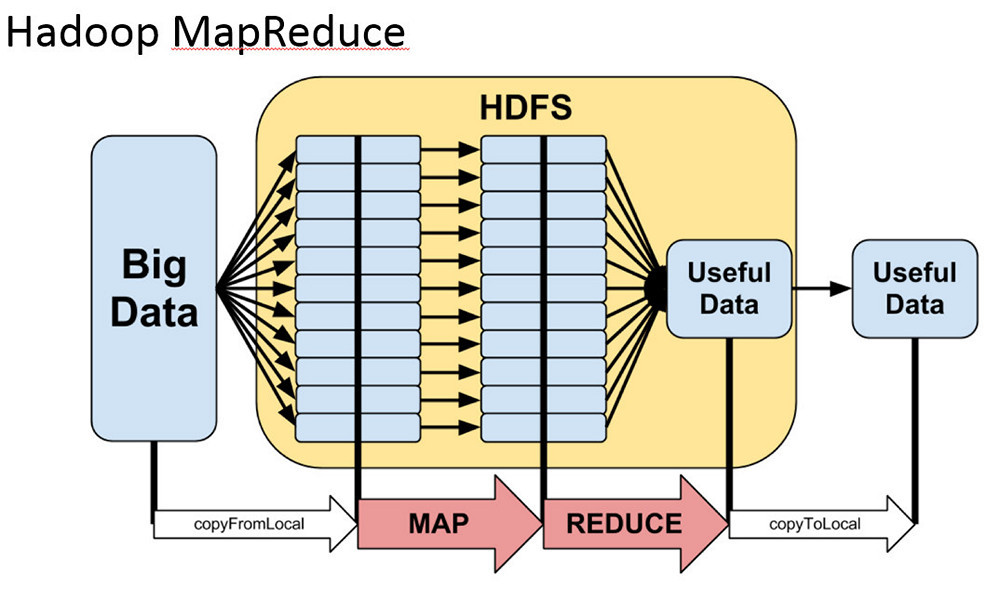
- • MapReduce. If you fully understand it, then the use will not cause difficulties. But if you "swim" in theory, then the difficulties are guaranteed.

- • Spark. It works much faster compared to traditional MapReduce, because it stores all the structures in memory, and can reuse them. It is also much more flexible, it is more convenient to make complex samples and aggregations in it.

If you program in Java, then working with Spark will not cause much difficulty. It uses relational algebra, distributed collections, processing chains.
In our project, we opted for Spark.
The architecture of our project
We read data from Kinesis with simple workers written in PHP. Why PHP? Just because it is more familiar to us, and it is more convenient for us. Although Amazon has an SDK to work with their services for almost all popular languages. Then we do the initial filtering of hits: we remove numerous hits of search bots, etc. Next, we send the statistics that we can immediately give online, in Dynamo DB.
The main data array for subsequent processing, for building models in Spark, etc. we save in S3 (instead of traditional HDFS we use Amazon storage). Subsequent mathematics, collaborative filtering and machine learning algorithms are handled by our cluster of recommendations, built on the basis of Apache Mahout.
- For data processing we use Apache Hadoop / MapReduce, Apache Spark, Dynamo DB (NoSQL).
- Apache Mahout is used for mathematical calculations, and large-scale processing of matrix multiplication is done using the MapReduce paradigm.
- Data is processed on dynamic computing clusters in the Amazon cloud.
- Storage is done in Amazon S3 Objective and partially in NoSQL DynamoDB.
Using Amazon AWS cloud infrastructure and off-the-shelf services saves us a ton of effort, resources and time. We do not need a large staff of admins to service this system, we do not need a large development team. Using all of the above components allows you to manage a very small number of specialists.
In addition, the entire system is much cheaper. All of our terabytes of data is more profitable to put in S3 than to lift separate servers with disk storage, take care of backup, etc. It is much easier and cheaper to raise Kinesis as a ready-made service, start using it literally in minutes or hours, than to configure the infrastructure, administer it, and solve some low-level maintenance tasks.
For the developer of an online store that works on our platform, all this looks like a certain service. To work with this service, a set of APIs is used, with which you can get useful statistics and personalized recommendations for each visitor.
analytics.bitrix.info/crecoms/v1_0/recoms.php?op=recommend&uid=#кука#&count=3&aid=#хэш_лицензии#- uid is the user's cookie.
- aid - license hash.
- count - the number of recommendations.
{
"id":"24aace52dc0284950bcff7b7f1b7a7f0de66aca9",
"items":["1651384","1652041","1651556"]
}
We can help recommend similar products, which is convenient for selling accessories and some additional components:
analytics.bitrix.info/crecoms/v1_0/recoms.php?op=simitems&aid=#хэш_лицензии#&eid=#id_товара#&count=3&type=combined&uid=#кука#- uid is the user's cookie.
- aid - license hash.
- eid - Product ID
- type - view | order | combined
- count - the size of the issue.
Another useful mechanism is the top product by sales volume. You can argue that all this can be done without fussing with big data. In the store itself - yes, you can. But the use of our statistics allows you to remove a considerable proportion of the load from the base of the store.
analytics.bitrix.info/crecoms/v1_0/recoms.php?op=sim_domain_items&aid=#хэш_лицензии#&domain=#домен#&count=50&type=combined&uid=#кука#- uid is the user's cookie.
- aid - license hash.
- domain - the domain of the site.
- type - view | order | combined
- count - the size of the issue.
The client can use all of these tools in any combination. The cloud service of personal recommendations is fully integrated with the 1C-Bitrix: Site Management platform itself, the store developer can very flexibly manage the block of issued recommendations: “mix” the necessary items of goods that always need to be shown; use sorting by price or by some other criteria, etc.
When building a user’s model, all statistics of his views are taken into account, and not just the current session. Moreover, all models are depersonalized, that is, each visitor exists in the system only in the form of a faceless ID. This allows you to maintain confidentiality.
We do not divide visitors according to the stores they visit. We have a single database, and each visitor is assigned a single identifier, no matter what stores he goes to. This is one of the main advantages of our service, because small shops do not have sufficiently large statistics that can reliably predict user behavior. And thanks to our single database, even a store with 10 visits per day has the opportunity with high probability of success to recommend products that will be of interest to this particular visitor.
Data can be outdated, so when building a user model, we will not take into account statistics a year ago, for example. Only data for the last month is taken into account.
Practical examples
What do our tools look like on the site?
A block of personal recommendations, which can be on the main page. It is individual for each visitor to the site.
It can also be displayed in the card for a specific product:
Example of a block of recommended products:
Blocks can be combined, looking for the most efficient combination.
Orders sold on a personal recommendation are noted in the admin panel.
The employee processing the orders can immediately display in the admin panel a list of goods that can be recommended to the buyer at checkout.
Unlike our tools, third-party recommendation services have an important drawback - a fairly small audience. To use these services, you need to insert a counter and a widget to display recommendations. While our toolkit is very closely integrated with the platform, and allows you to refine the recommendations issued to visitors. For example, a store owner might sort recommendations by price or availability; mix in the issuance of other goods.
Quality metrics
The main question arises: how effectively does all of the above work? How do you measure performance?
- We calculate the ratio of views by recommendations to the total number of views.
- We also measure the number of orders made on the recommendation and the total number of orders.
- Проводим измерения по state-машинам пользователей. У нас есть матрица с моделями поведения за период в три недели, мы даем по ним какие-то рекомендации. Затем оцениваем состояние, например, через неделю, и сравниваем размещенные заказы с теми рекомендациями, которые мы могли бы дать в будущем. Если они совпадают, то мы рекомендуем правильно. Если не совпадают, надо подкручивать или совсем менять алгоритмы.
- А/В тесты. Можно просто разделить посетителей интернет-магазина на группы: одной показать товары без персональных рекомендаций, другой — с рекомендациями, и оценить разницу в продажах.
Using A / B tests to work with personalized recommendations in the near future will be available to owners of online stores, it will be possible to select and configure the necessary metrics right in the admin panel, collect data for some time and estimate the difference by comparing conversions of different audiences.
According to our data, our conversion growth is from 10 to 35%. Even 10% is a huge indicator for an online store in terms of investing. Instead of pushing more money into advertising and engagement, users work more effectively with their audience.
But why is there such a wide variation in conversion growth? It depends on the:
- variety of assortment,
- topics
- the total number of products on the site,
- audience specifics
- bundles of goods.
In a catalog with few items and few accessories, growth will be less. In stores offering many additional positions, growth will be higher.
Other applications
Where else can you use such tools, in addition to online stores? In almost any Internet project that wants to increase its audience. After all, a commodity unit can be not only something tangible. A product can be an article, any textual material, a digital product, a service, whatever.
- Mobile operators, service providers: identifying customers who are ready to leave.
- Banking sector: sale of additional services.
- Content projects.
- CRM
- Trigger mailings.
Using the same models, you can evaluate the audience and its willingness to switch, for example, from free to paid tariffs, and vice versa. Or you can assess the likelihood of users leaving to competitors. This can be prevented by some additional discount, marketing campaign. Or if the client is about to buy a product or service, then you can make some interesting offer, thereby increasing audience loyalty. Naturally, all this can be used with trigger links as flexibly as possible. For example, a user who viewed a product, put it in a basket, but did not place an order, can make a personal offer.
BigData Project Statistics: Personalization
Currently, 17 thousand stores operate on our platform, the system calculates about 440 million events per month. The total product catalog contains about 18 million items. The proportion of orders on the recommendation of the total number of orders: 9–37%.
As you can see, there is a lot of data, and they do not lie dead weight, but work and bring benefits. For stores operating on our platform, this service is now free. We have an open API, which can be modified on the side of Backend'a and give more flexible recommendations to specific visitors.