Machine learning @ booking.com
Machine learning allows you to make the service much more convenient for users. It’s not so difficult to start implementing recommendations, you can get the first results, even without a well-established infrastructure, the main thing is to start. And only then build a large-scale system. That was how it all began on Booking.com. And what is the result, what approaches are being used now, how are the models being introduced into production, how to monitor them, said Viktor Bilyk on HighLoad ++ Siberia. Possible errors and problems were not left out of the report, it will help someone to get around the shoals, and will push someone to new ideas.
About speaker: Viktor Bilyk introduces machine learning products into commercial operation on Booking.com.
First, let's see where Booking.com uses machine learning, in which products.
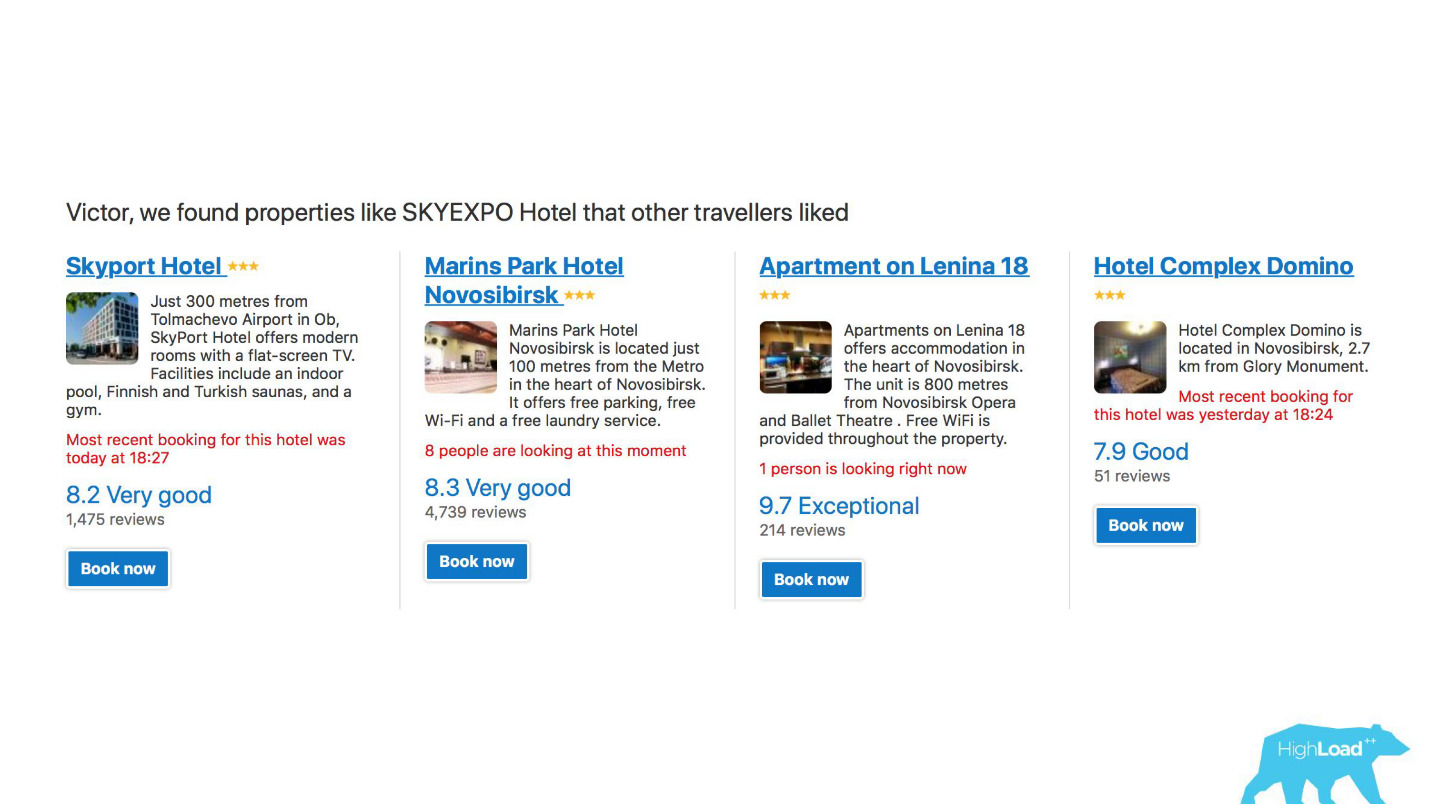
First, it is a large number of recommendation systems for hotels, directions, dates, and in different points of the sales funnel and in different contexts. For example, we are trying to guess where you will go when you have not entered anything into the search line at all.

This is a screenshot in my account, and I will definitely visit two of these areas this year.
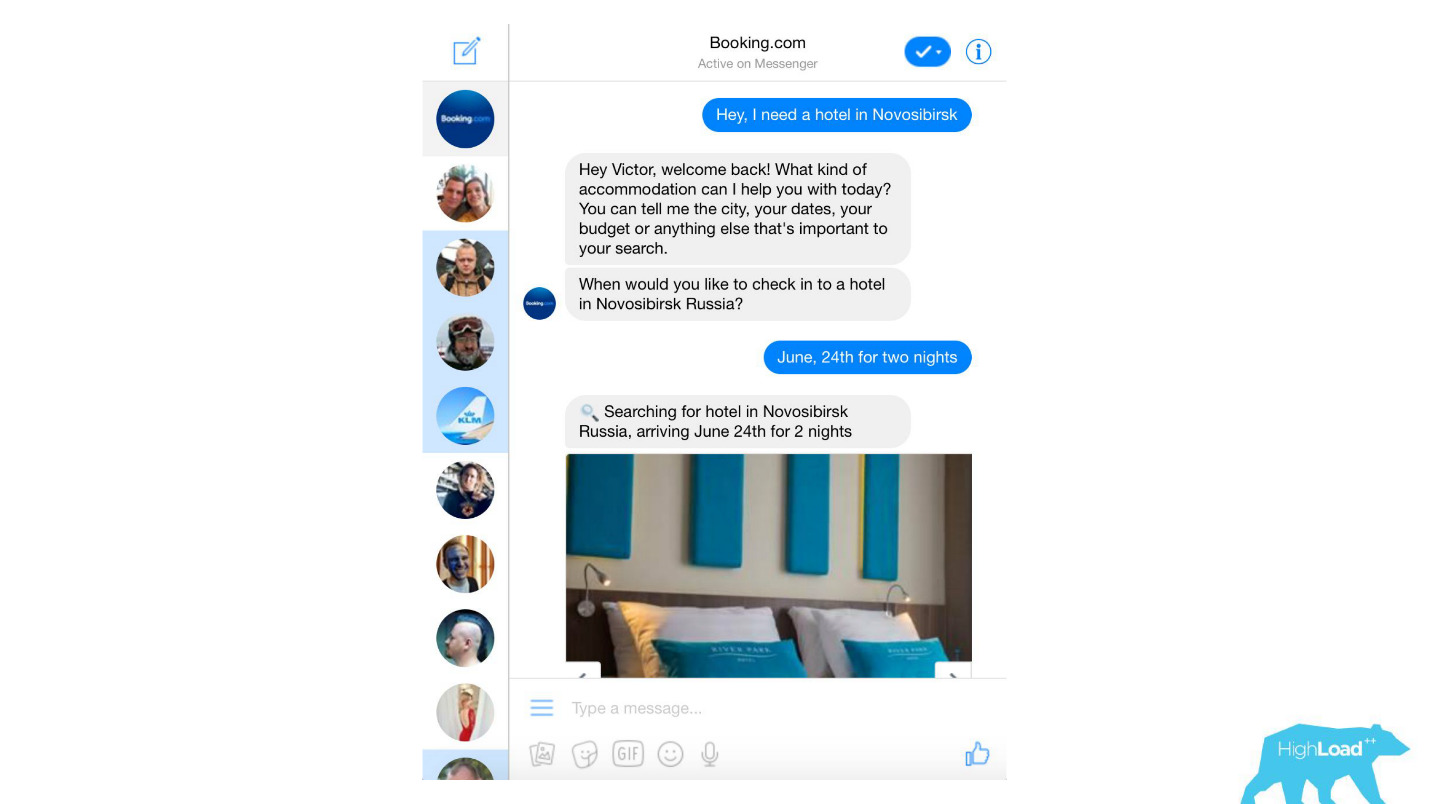
We process almost any text messages from clients, starting with banal spam filters, ending with such complex products as Assistant and ChatToBook, where models are used to define intentions and recognize entities. In addition, there are models that are not so noticeable, for example, Fraud Detection.
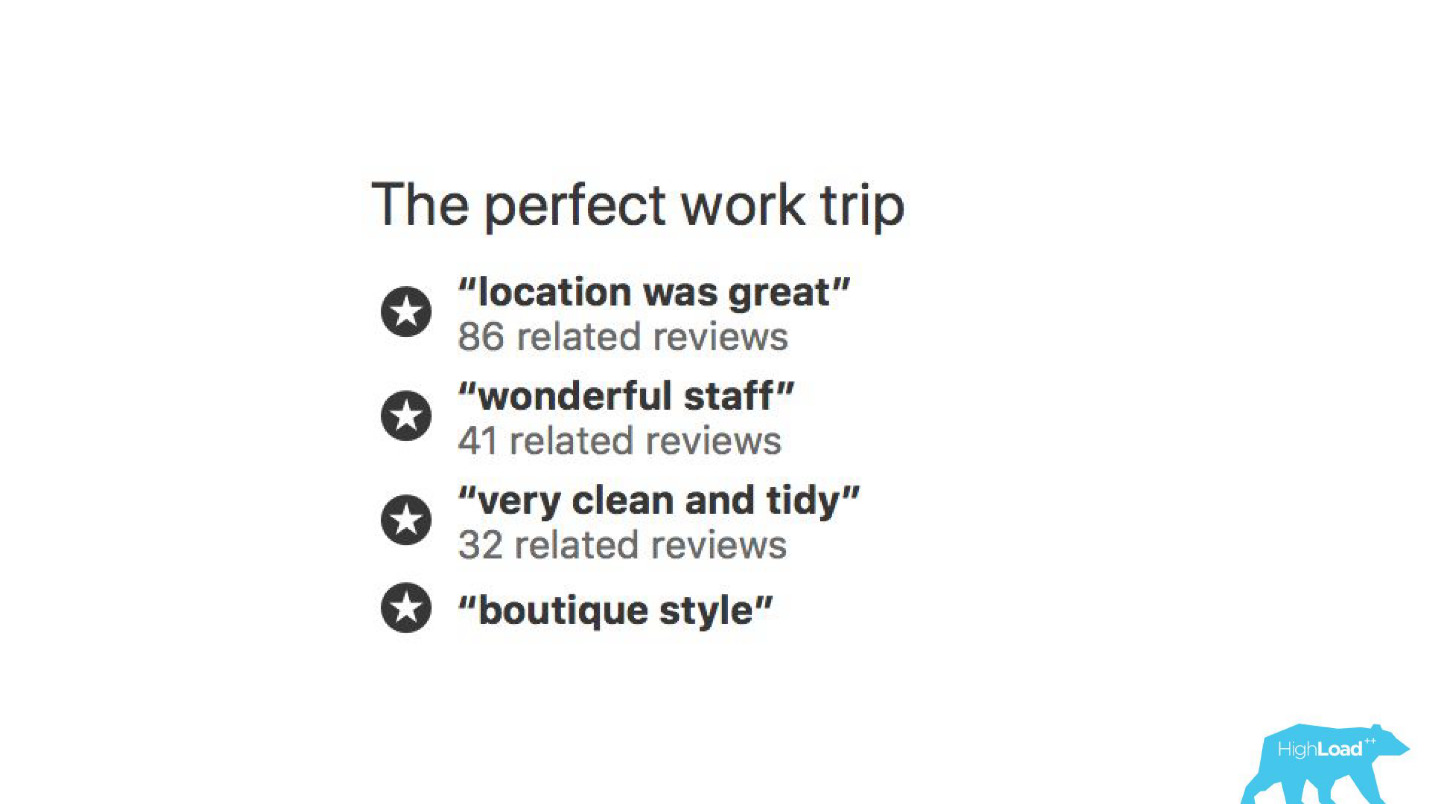
We analyze reviews. Models tell us why people go to, say, Berlin.

With the help of machine learning models it is analyzed, for which they praise the hotel, so that you do not have to read thousands of reviews by yourself.
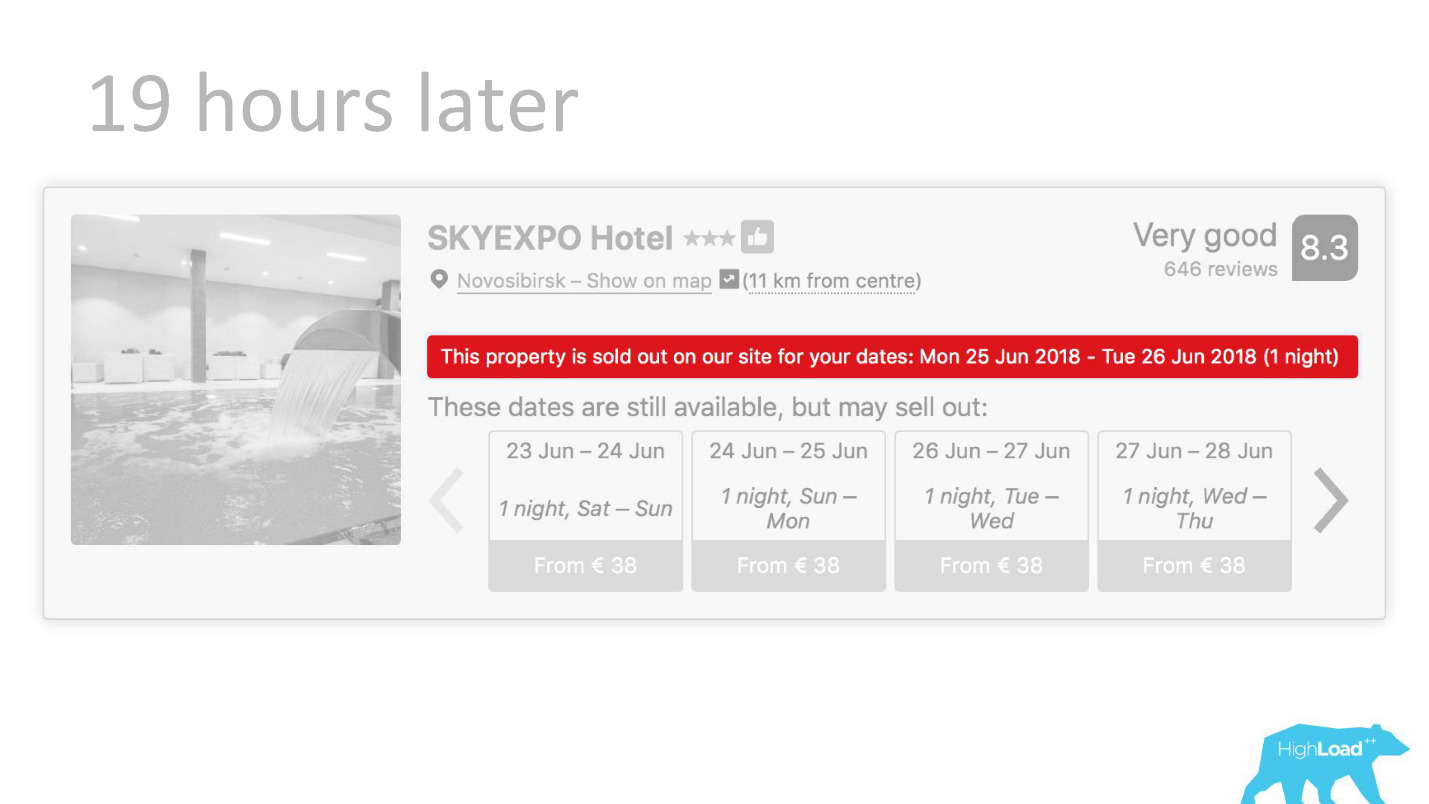
In some places of our interface, almost every piece is tied to the predictions of some models. For example, here we are trying to predict when the hotel will be sold out.
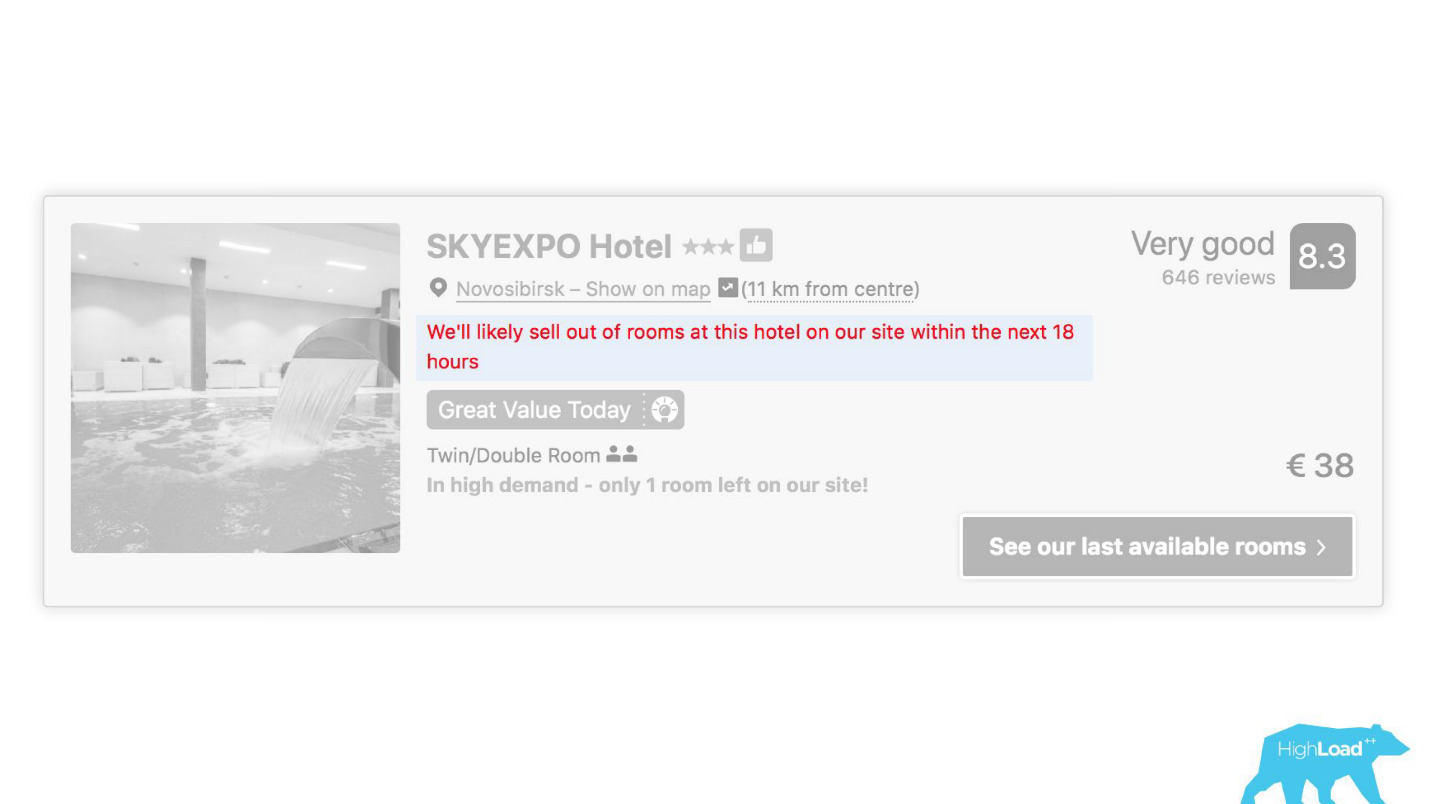
Often we are right - after 19 hours the last room is already booked.
Or, for example, - badge "Favorable offer". Here we are trying to formalize the subjective: what is a good offer in general? How to understand that the prices offered by the hotel for these dates are good? After all, this, apart from the price, depends on many factors, such as additional services, and often, in general, from external causes, if, for example, a football world championship or a large technical conference is taking place in this city.
Begin implementation
Let's wind off a few years ago, in 2015. Some of the products I have mentioned already exist. In this system, which I will talk about today, yet. How did the introduction happen at that time? Things were, frankly, not very. The fact is that we had a huge problem, part of which was technical, and part was organizational.
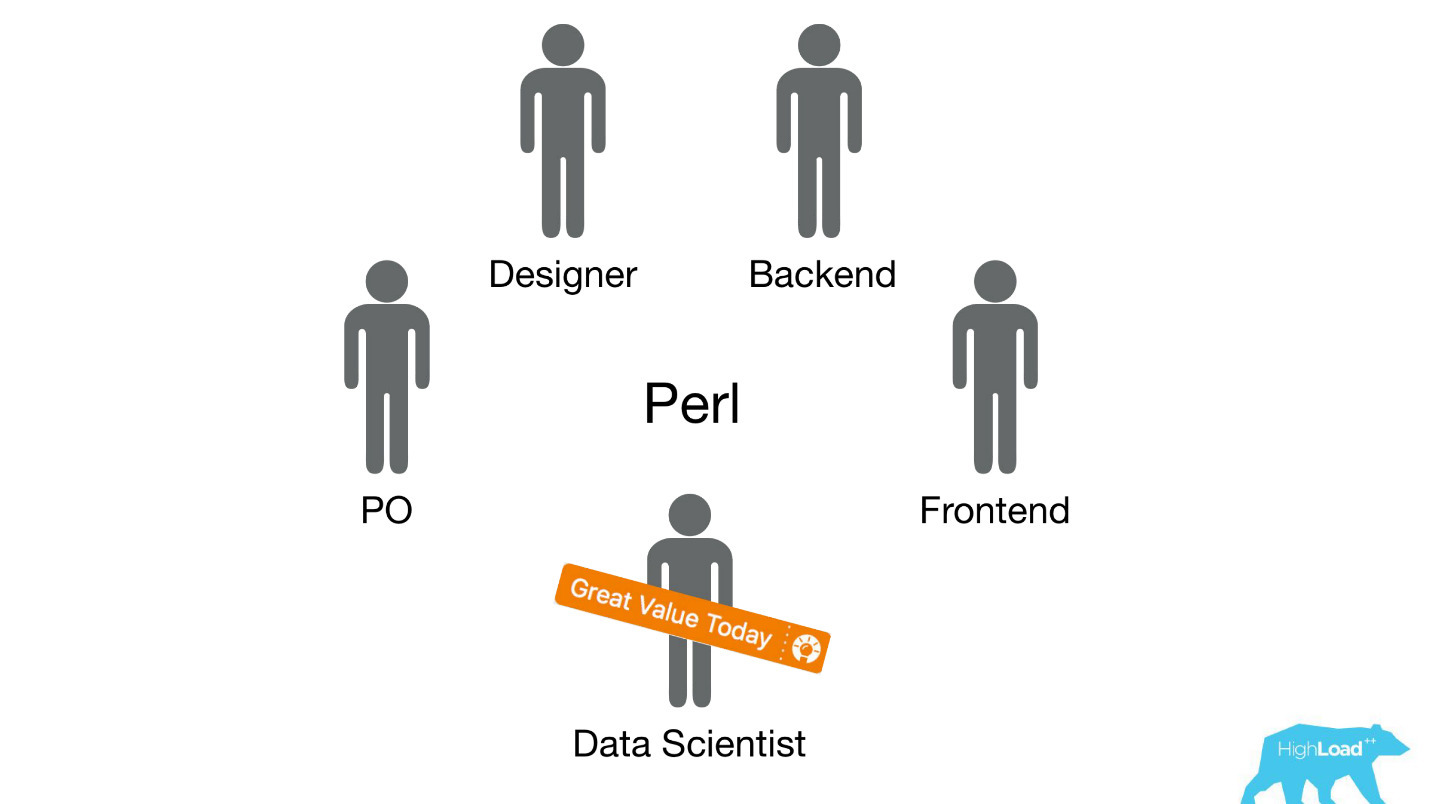
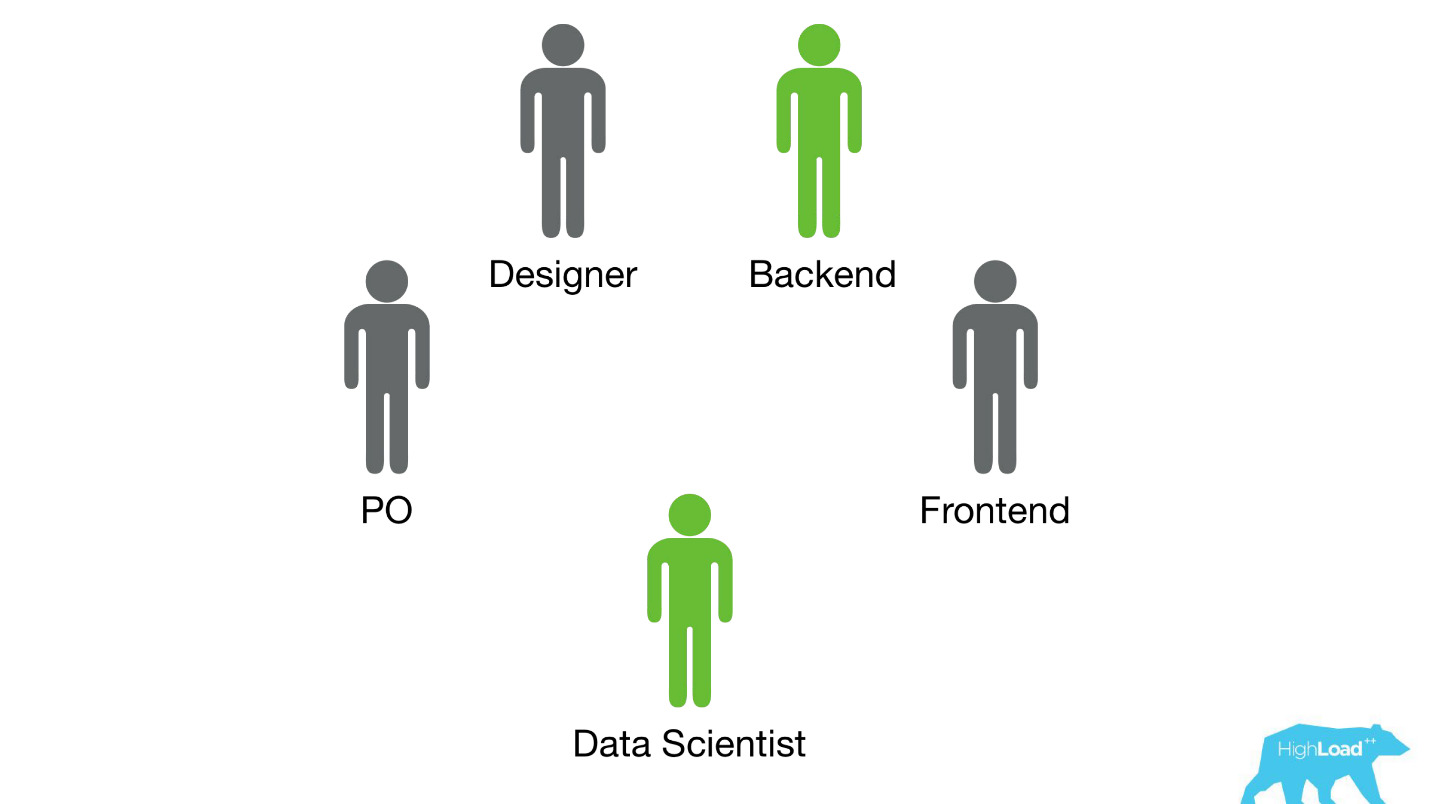
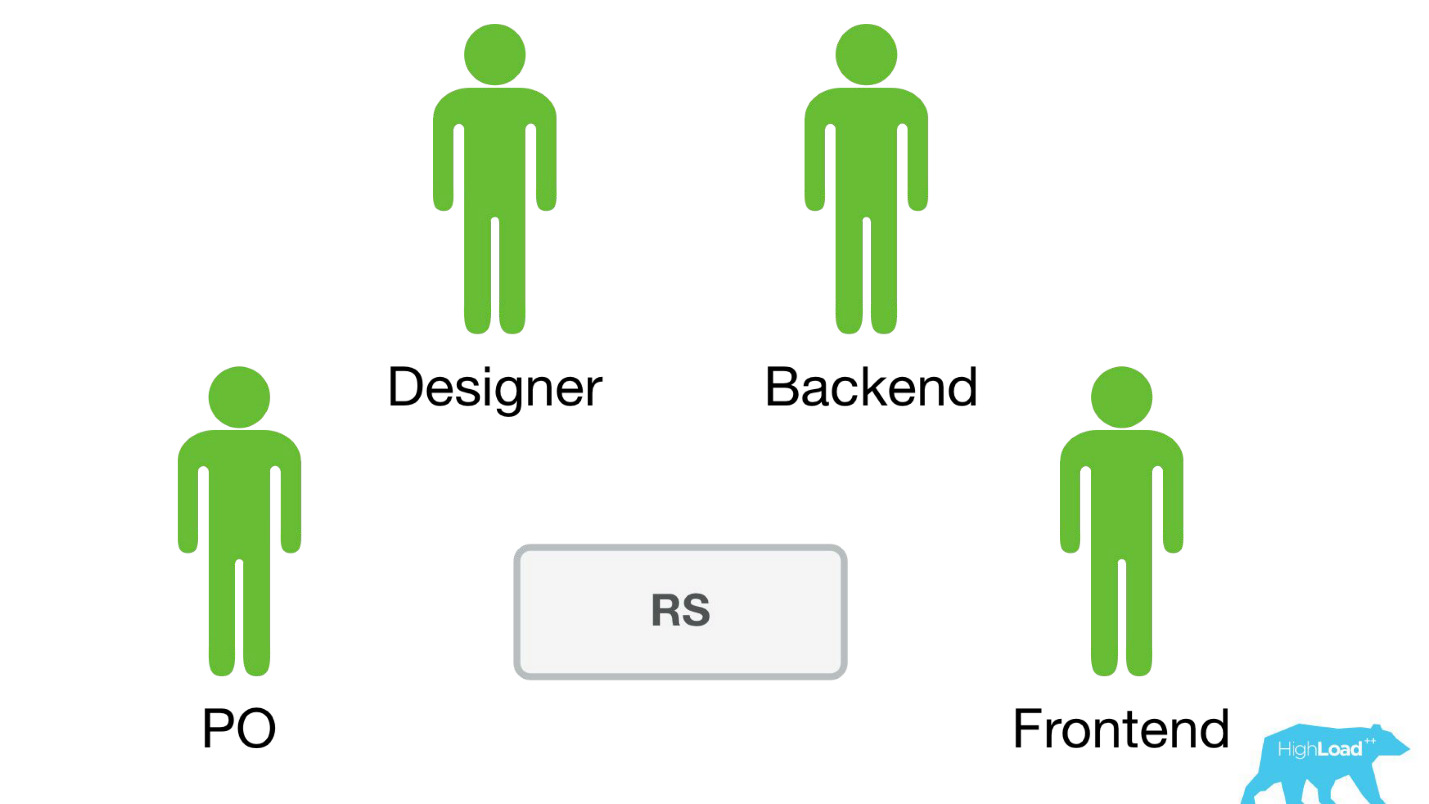
We sent deytasayentistov in already existing cross-functional teams that are working on a specific user problem, and expected that they would somehow improve the product.
Most often, these pieces of product were built on a Perl stack. There is a very obvious problem with Perl - it is not designed for intensive calculations, and our backend is already loaded with other things. At the same time, the development of serious systems that would solve this problem would not have been possible to prioritize within the team, because the team’s focus is on solving a user problem, and not on solving a user problem using machine learning. Therefore, the Product Owner (PO) would be quite against it.
Let's see how it happened then.
There were only two options - I know for sure, because at that time I was working on such a team and helped the data scientists to bring their first models into battle.
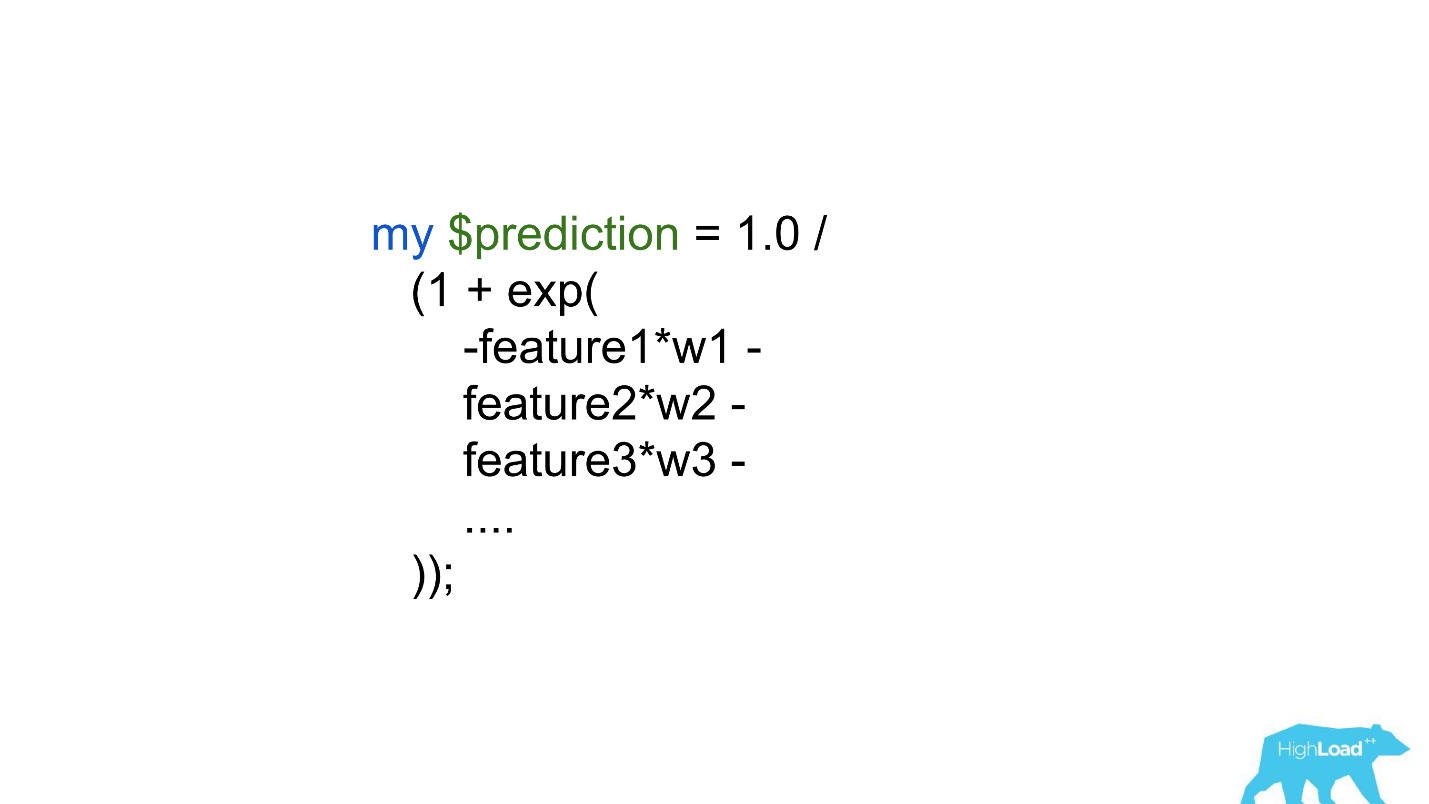
The first option was the materialization of the predictions.. Suppose there is a very simple model with only two features:
We need to predict the likelihood of some event. We just blow up all the input vectors: let's say 100,000 cities, 200 countries - a total of 20 million lines in MySQL. Sounds like a completely workable option for outputting some small ranking systems or other simple models to production.

Another option is to embed predictions directly into the backend code . There are big limitations - hundreds, maybe thousands of coefficients - that's all we could afford.
Obviously, neither one nor the other way does not allow to bring any complex model into production. This limited the deytasayentists and the success they could achieve by improving products. Obviously, this problem had to be solved somehow.
Prediction Service
The first thing we did was a prediction service. Probably, even the simplest architecture ever shown on Habré and HighLoad ++.
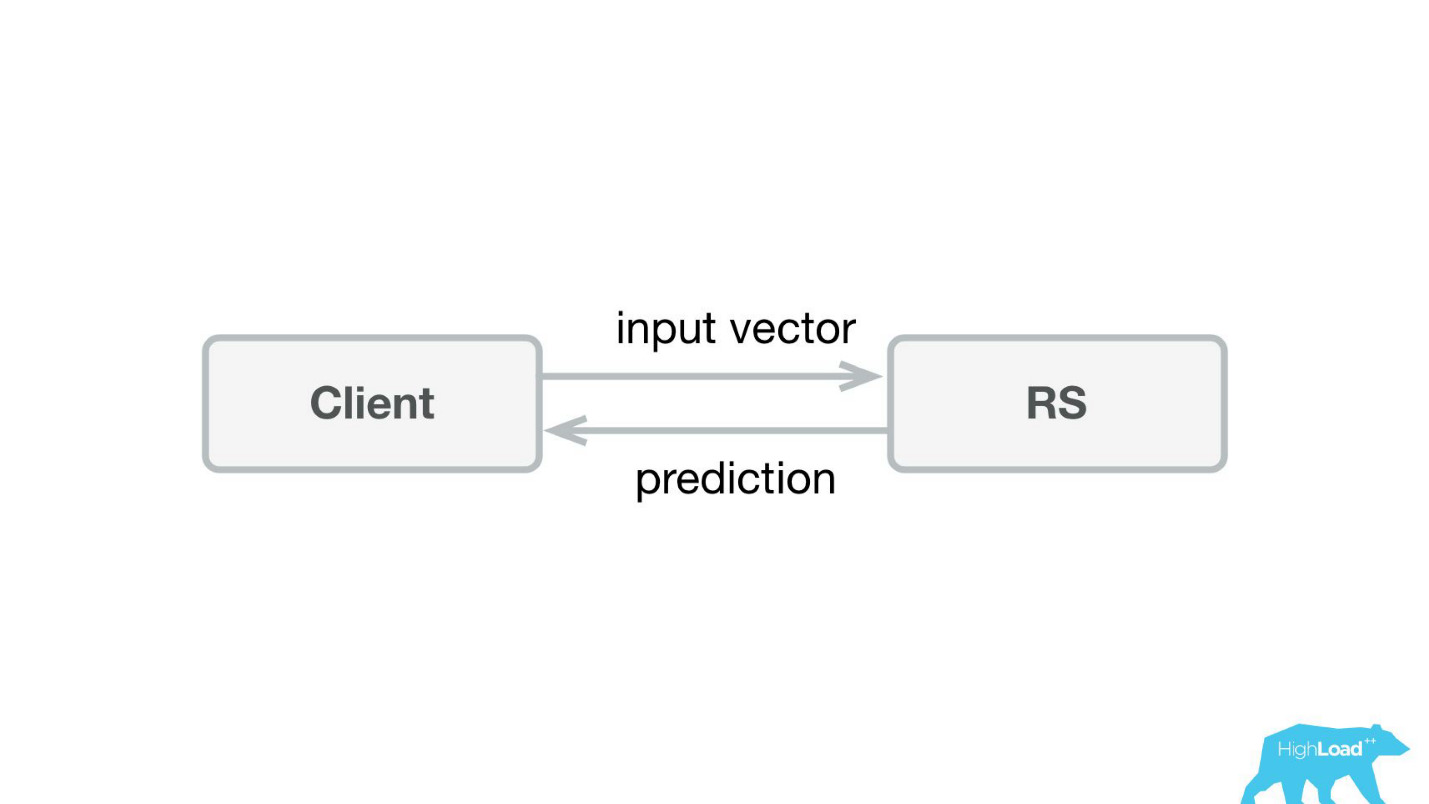
We wrote a small application on Scala + Akka + Spray, which simply received incoming vectors and gave the prediction back. Actually, I’m a little crafty - the system was a bit more complicated, because we needed to somehow monitor and roll it out. In reality, it all looked like this:
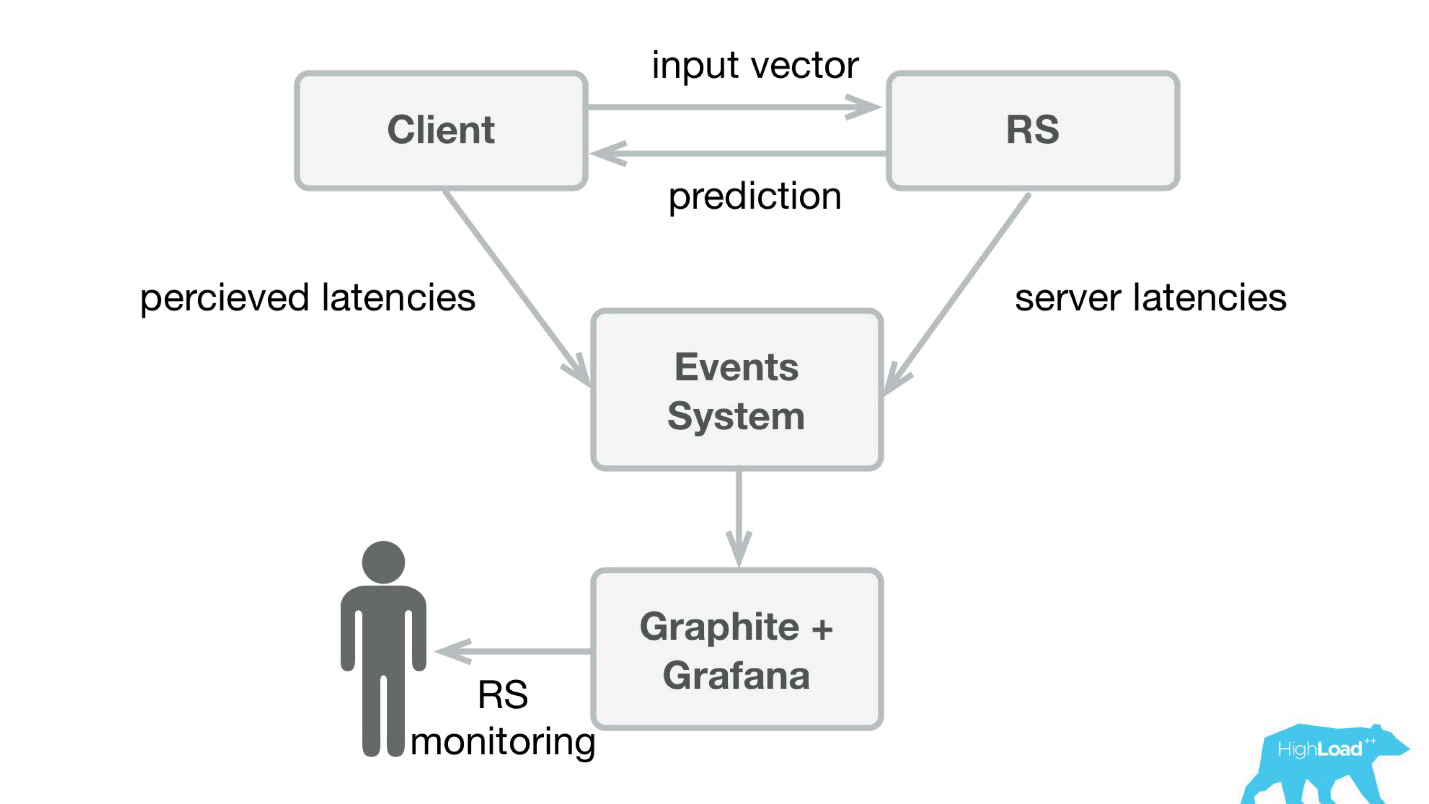
Booking.com has an event system - something like a magazine for all systems. There it is very easy to write, and this stream is very simple to redirect. At first, we needed to send client telemetry with perceived latencies and detailed information from the server side to Graphite and Grafana.
We made simple client libraries for Perl - we hid the whole RPC in a local call, put several models in there and the service started to take off. It was easy enough to sell such a product, because we were able to implement more complex models and spend much less time .
The data consultants began to work with much less restrictions, and the work of the back-tenders in some cases was reduced to one-liner.
Product predictions
But let's briefly go back to how we used these predictions in the product.
There is a model that makes prediction based on known facts. Based on this prediction, we somehow change the user interface. This, of course, is not the only scenario of using machine learning in our company, but rather common.
What is the problem of running such features? The thing is that these are two things in one bottle: the model and the change of the user interface. It is very difficult to separate the effects from one and the other.
Imagine launching the “Favorable Offer” badge as part of an AB-experiment. If it does not take off - there is no statistically significant change in the target metrics - it is not known what the problem is: an incomprehensible, small, imperceptible badge or a bad model.
In addition, models can degrade, and there can be a lot of reasons for this. What worked yesterday doesn't necessarily work today. In addition, we are constantly in the cold-start mode, constantly connecting new cities and hotels, people from new cities come to us. We need to somehow understand that the model still summarizes well in these pieces of incoming space.
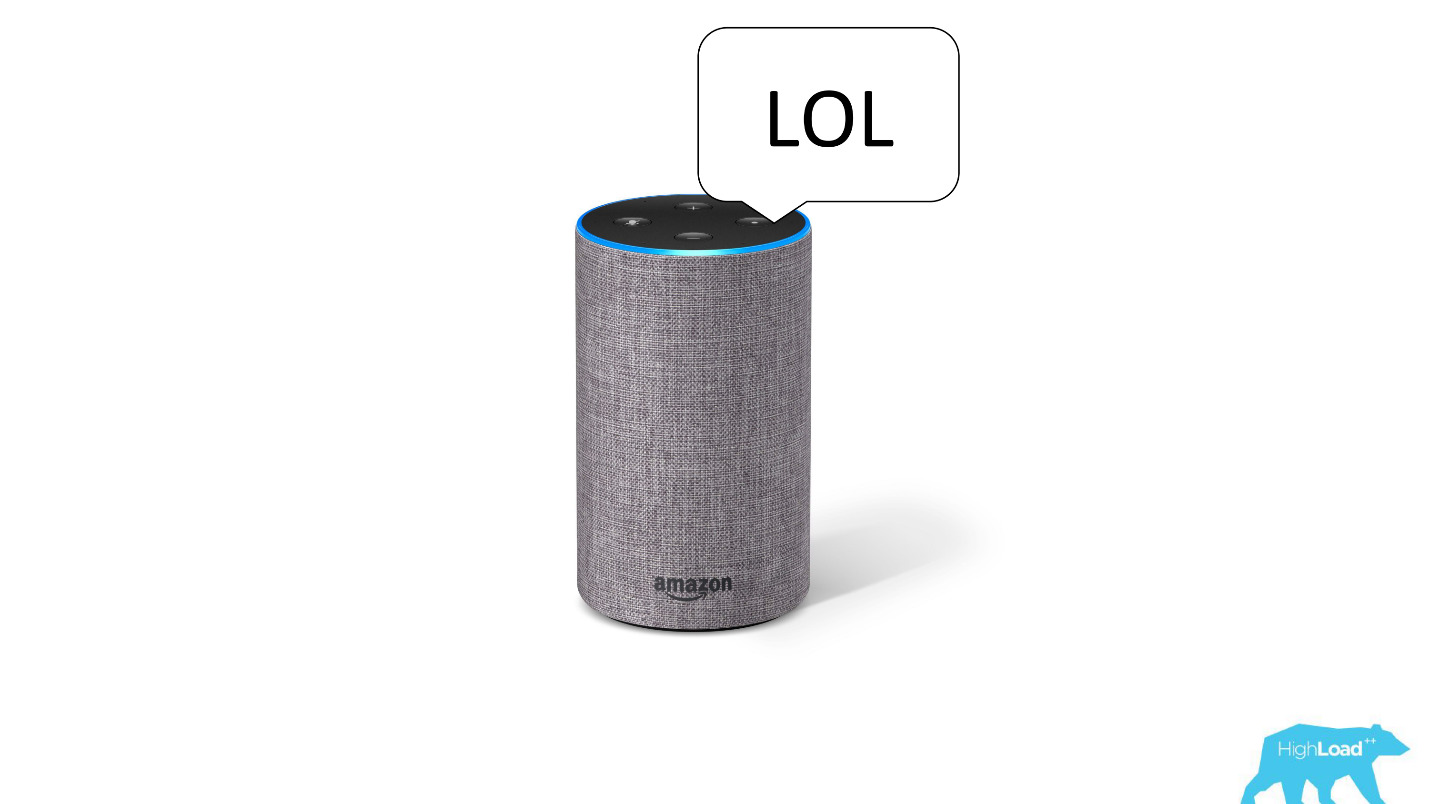
The most probably recently known case of degradation of the model was the story of Alexa. Most likely, as a result of the retraining, she began to understand random noises as a request to laugh, and began to laugh at night, frightening the owners.
Prediction Monitoring
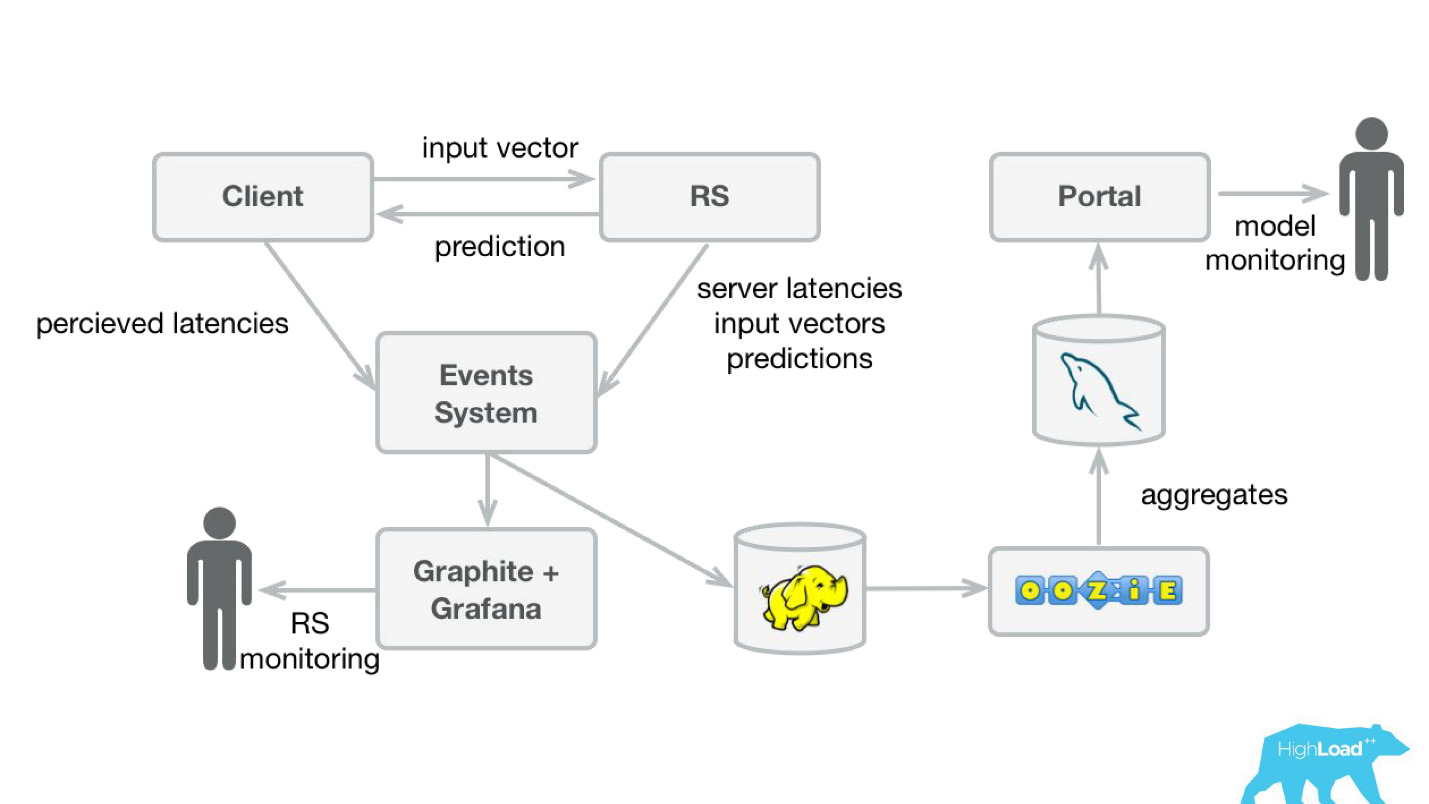
In order to monitor the predictions, we have slightly modified our system (the diagram below). Similarly, from the event-system, we redirected the stream to Hadoop and began to save, besides everything that we saved before, also all the input vectors, and all the predictions that our system made. Then, using Oozie, we aggregated them in MySQL and from there we showed a small web application to those who are interested in some of the qualitative characteristics of the models.
However, it is important to figure out what to show there. The thing is that it’s very difficult to calculate the usual metrics used in training models, in our case, because we often have a huge delay in labels.
Consider this by example. We want to predict whether the user is going on vacation alone or with his family. We need this prediction when a person chooses a hotel, but we can learn the truth only after a year. Only having already gone on vacation, the user will receive an invitation to leave a review, where, among other things, there will be a question whether he was there alone or with his family.
That is, you need somewhere to store all the predictions made in a year, and also so that you can quickly find matches with the incoming labels. It sounded like a very serious, maybe even a very heavy investment. Therefore, until we have coped with this problem, we decided to do something simpler.
This "simpler" was just a histogram of predictions made by the model.
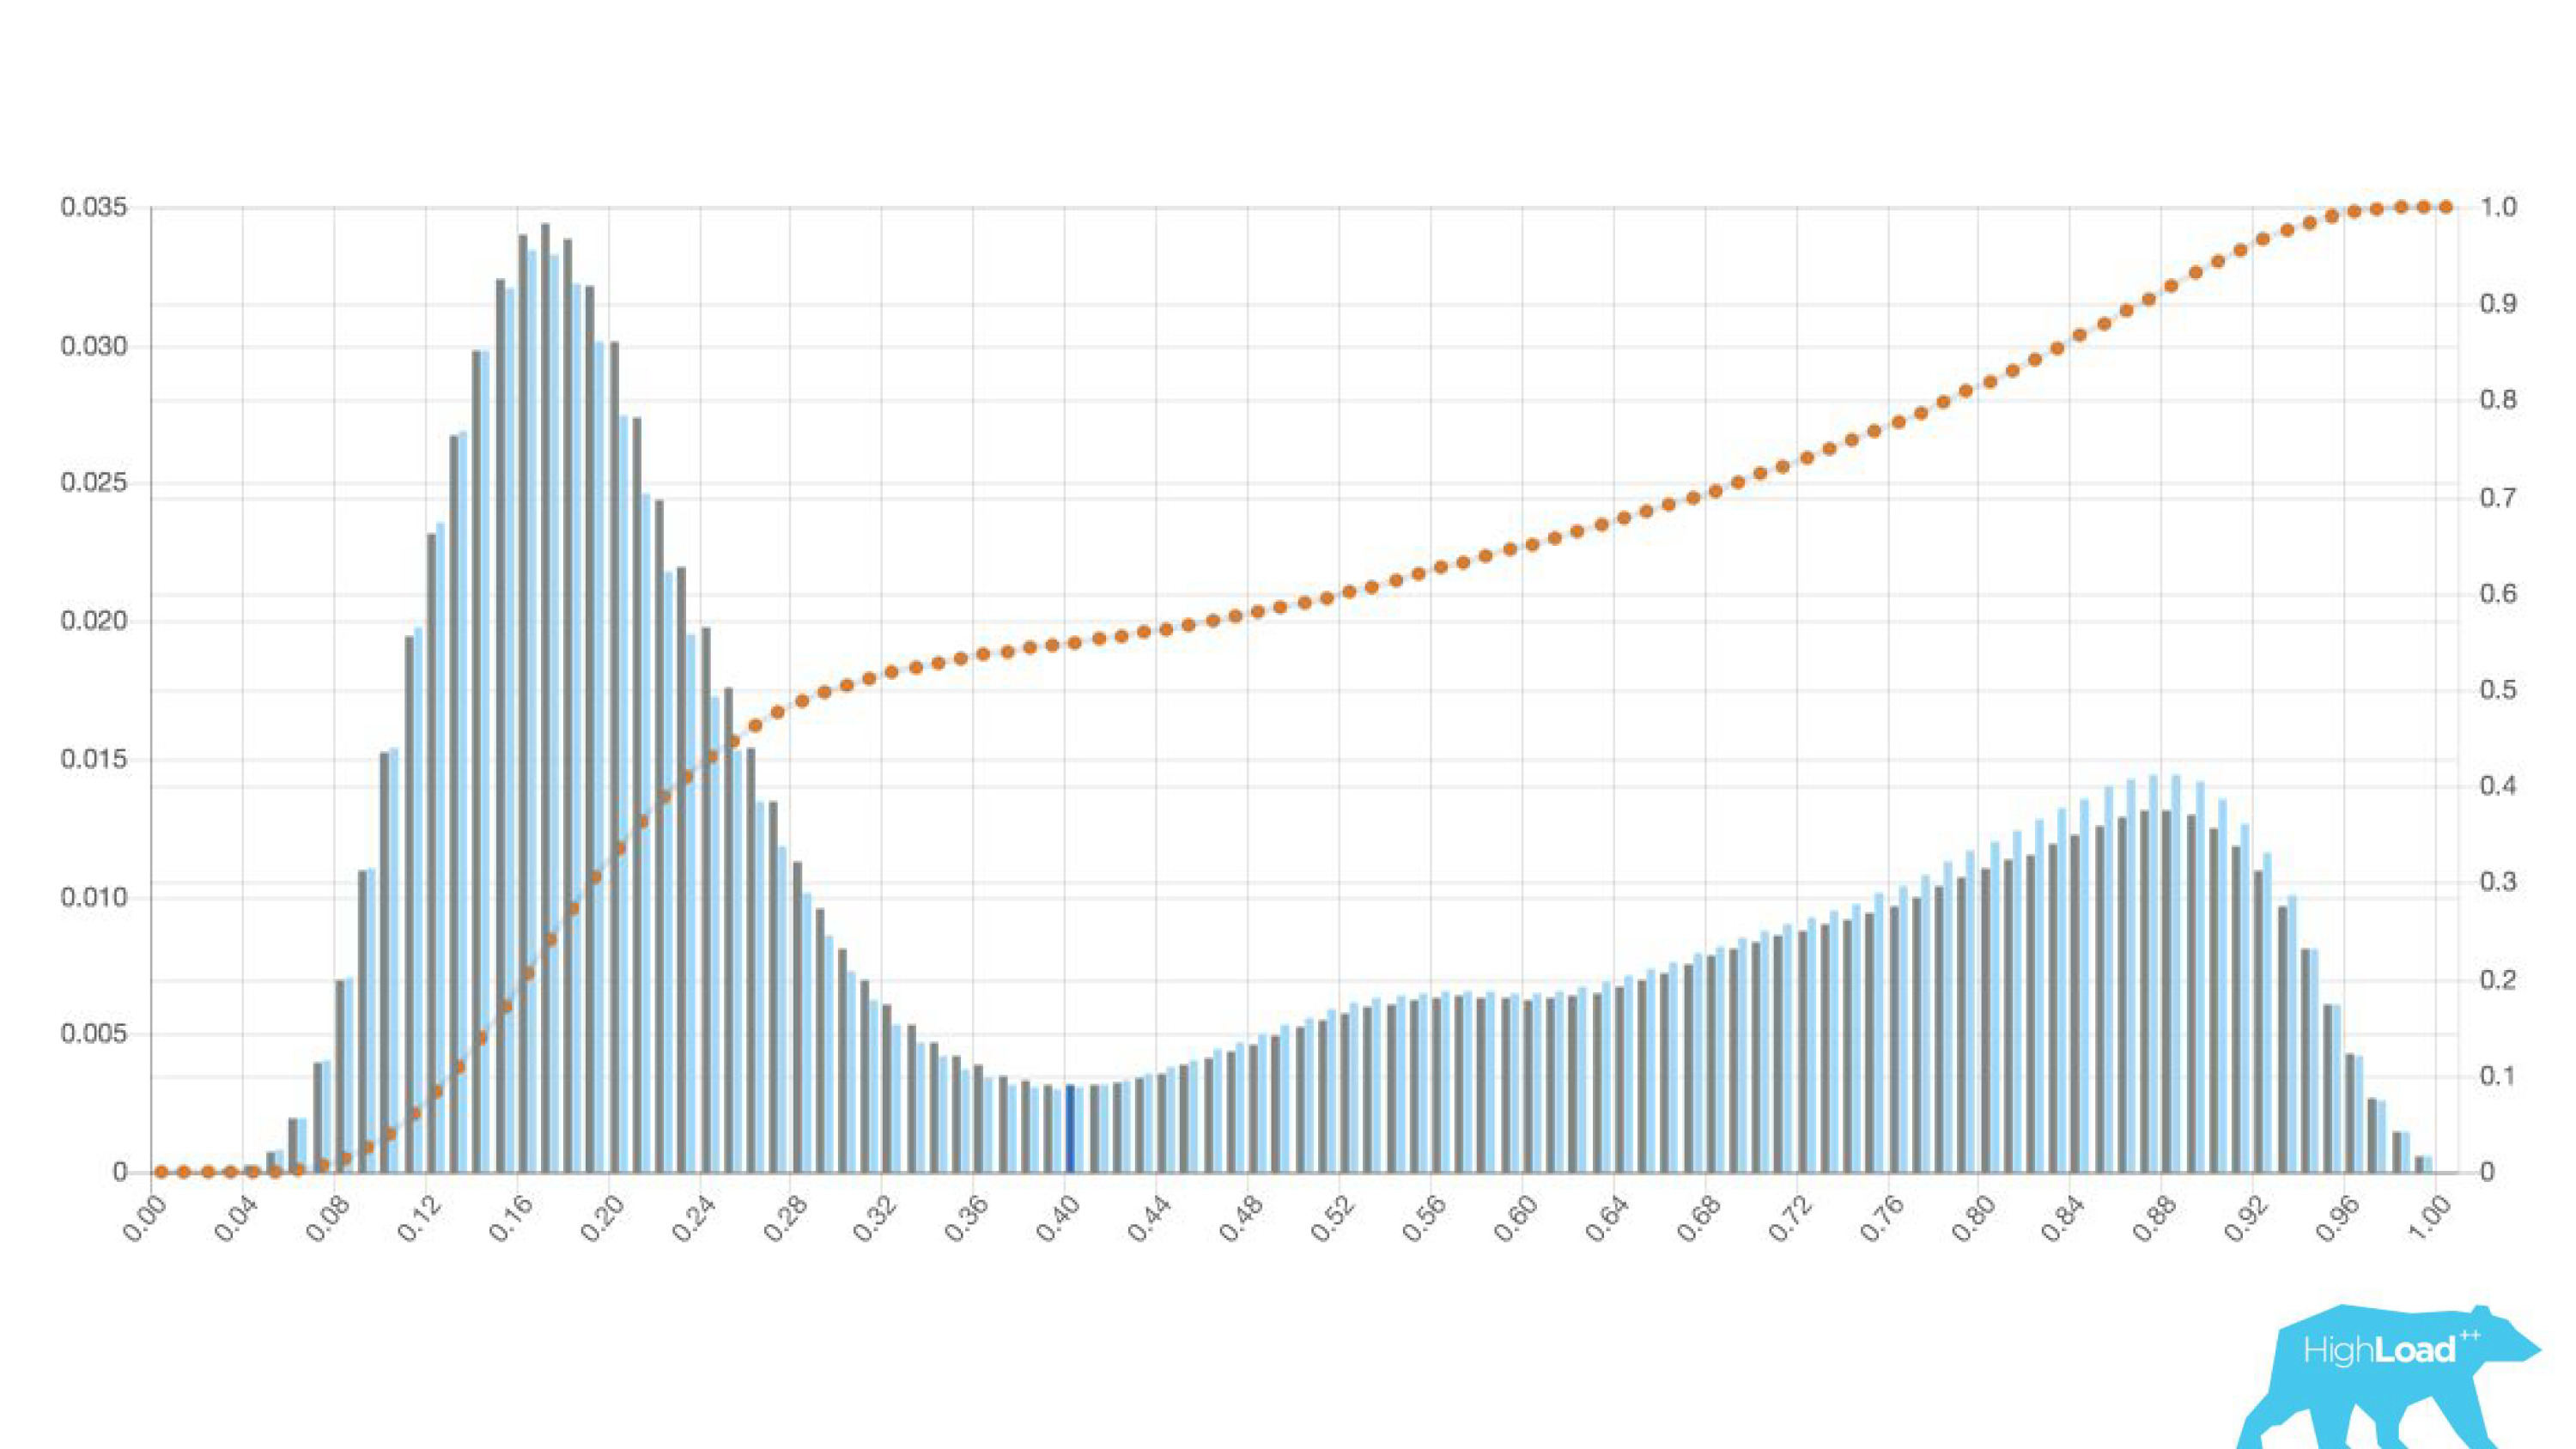
Above on the chart is a logistic regression that predicts whether the user will change the date of his trip or not. It can be seen that it divides users quite well into two classes: on the left, the hill are those who do not do it; on the right is the hill - those who will do it.
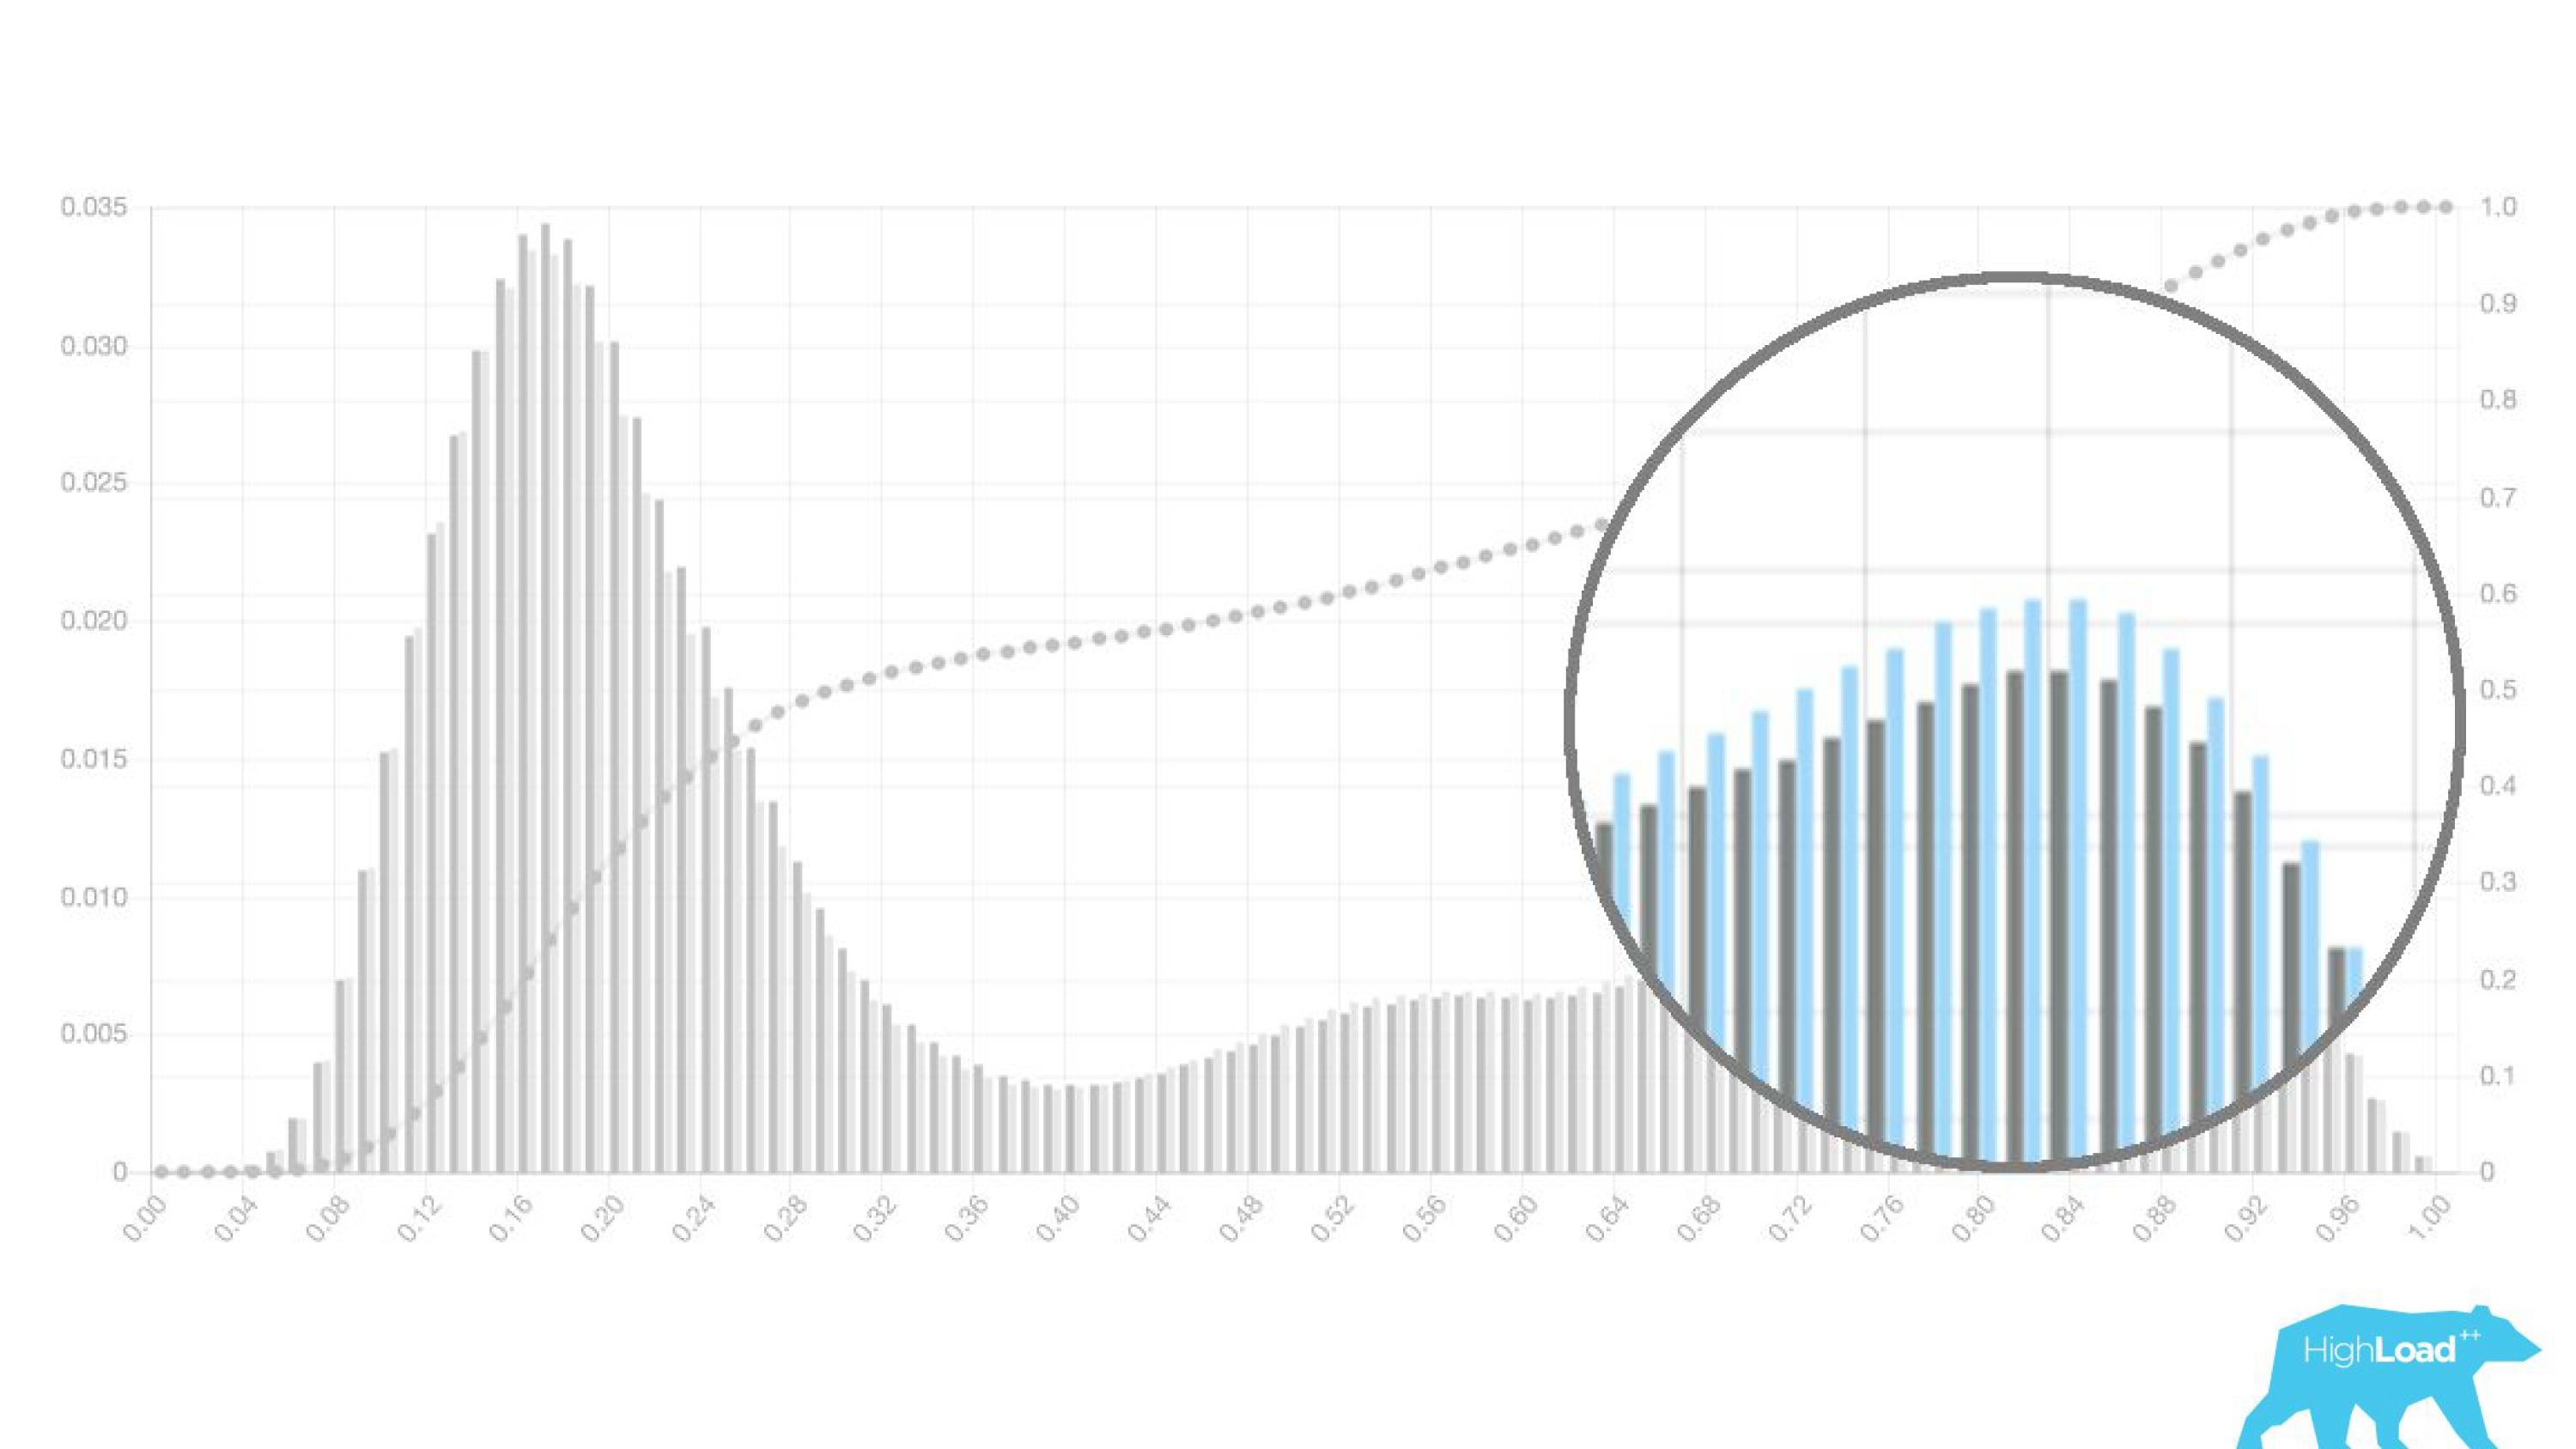
In fact, we even show two graphs: one for the current period and the other for the previous one. It is clearly seen that this week (this is a weekly chart), the model predicts a change in dates a little more often. It is difficult to say for sure whether this is seasonality or that degradation with time.
This led to a change in the workflow of deytasayentists, who stopped engaging other people and began to more quickly iterate their models. They sent models in production to dry-run along with backend engineers. That is, the vectors were collected, the model made a prediction, but these predictions were not used in any way.
In the case of a badge, we simply did not show anything, as before, but collected statistics. This allowed us not to waste time on pre-failure projects. We freed up the time for front-end designers and designers for other experiments. As long as the data scientist is not sure that the model works the way it wants, it simply does not involve others in this process.
It is interesting to see how the graphs change in different cuts.
On the left - the probability of changing dates on the desktop, on the right - on the tablets. It is clearly seen that on the plates the model predicts a more likely change of dates. This is most likely due to the fact that the tablet is often used for travel planning and less often for booking.
It is also interesting to see how these graphs change as users move along the sales funnel.
On the left, the probability of changing dates on the search page, on the right - on the first booking page. It can be seen that a much larger number of people who have already decided on their dates get to the booking page.
But these were good graphics. What do the bad look like? Very different. Sometimes it's just noise, sometimes a huge hill, which means that the model cannot effectively separate any two classes of predictions.

Sometimes these are huge peaks.
This is also a logistic regression, and until a certain moment it showed a beautiful picture with two hills, but one morning it became like this.
In order to understand what happened inside, you need to understand how the logistic regression is calculated.
Quick reference
This is the logistic function of the scalar product, where x n are some features. One of these features was the price of the night at the hotel (in euros).
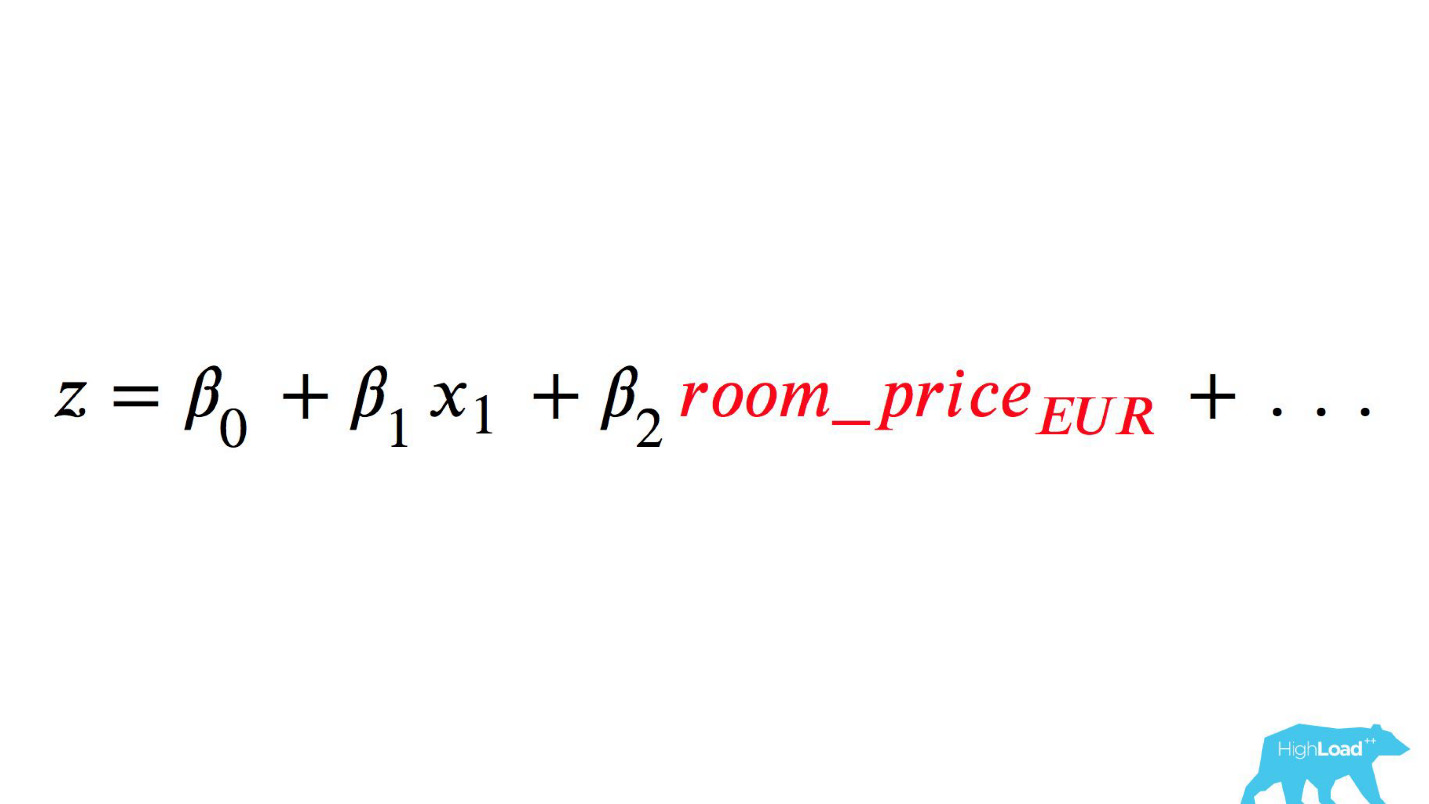
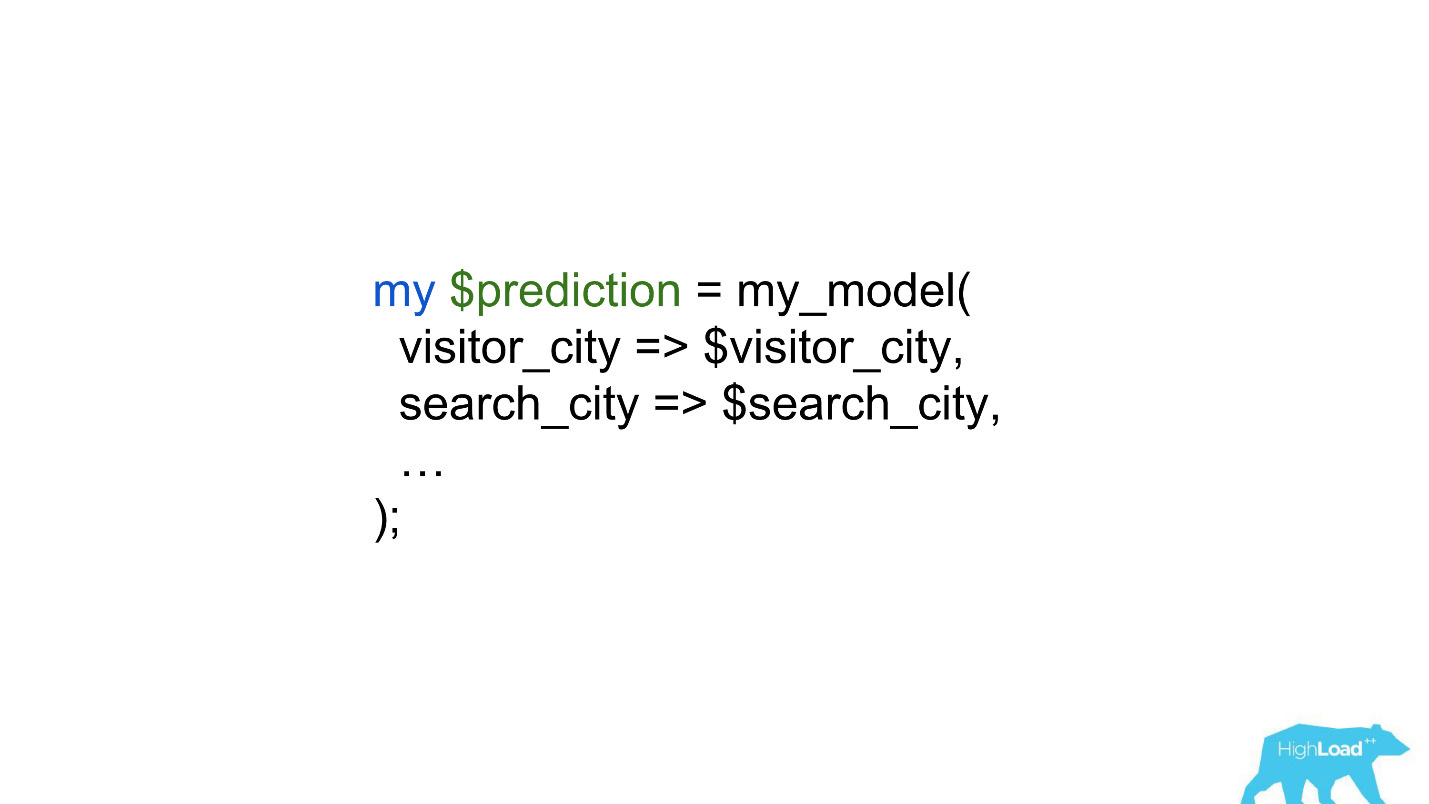
Calling this model would be worth something like this:
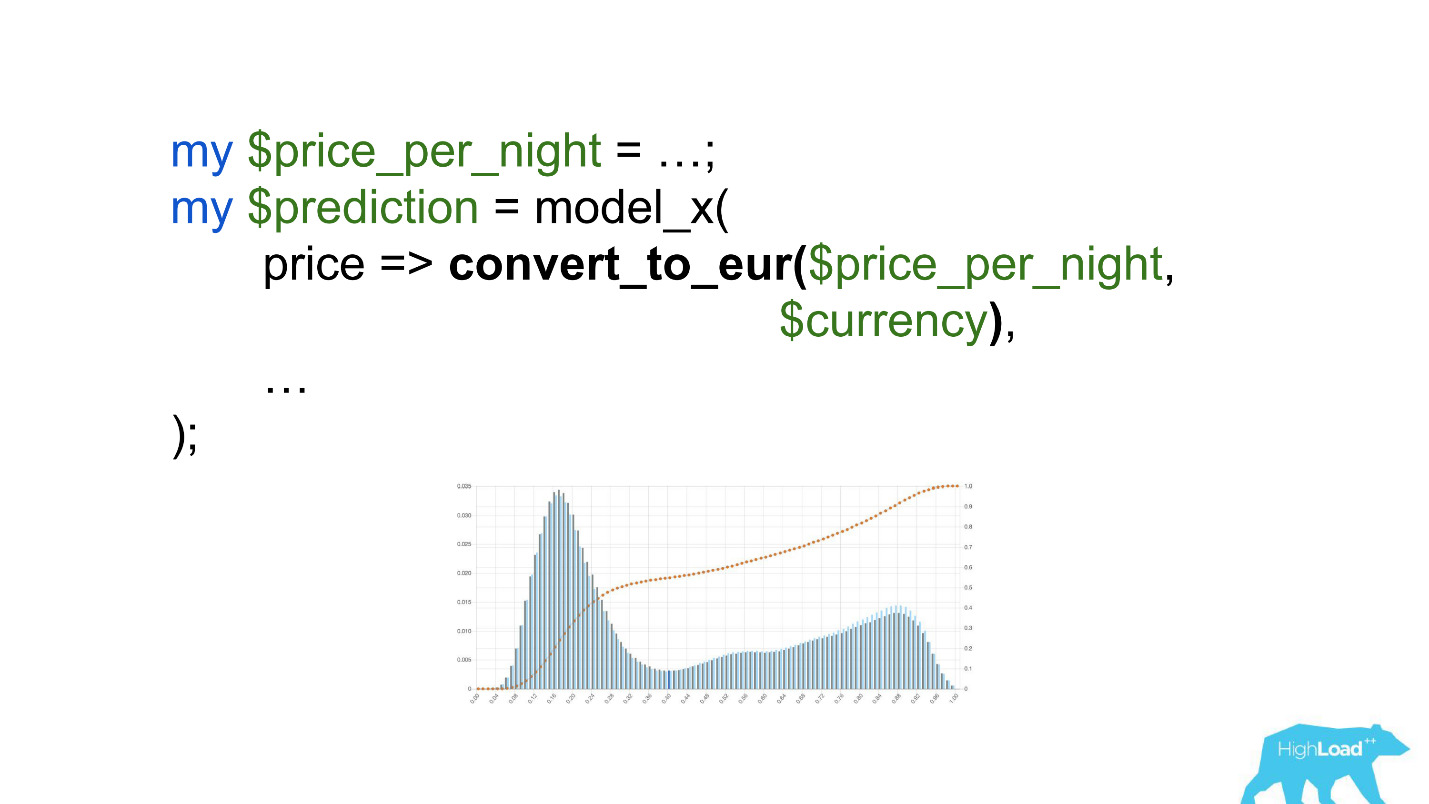
Pay attention to the selection. It was necessary to convert the price into euros, but the developer forgot to do it.
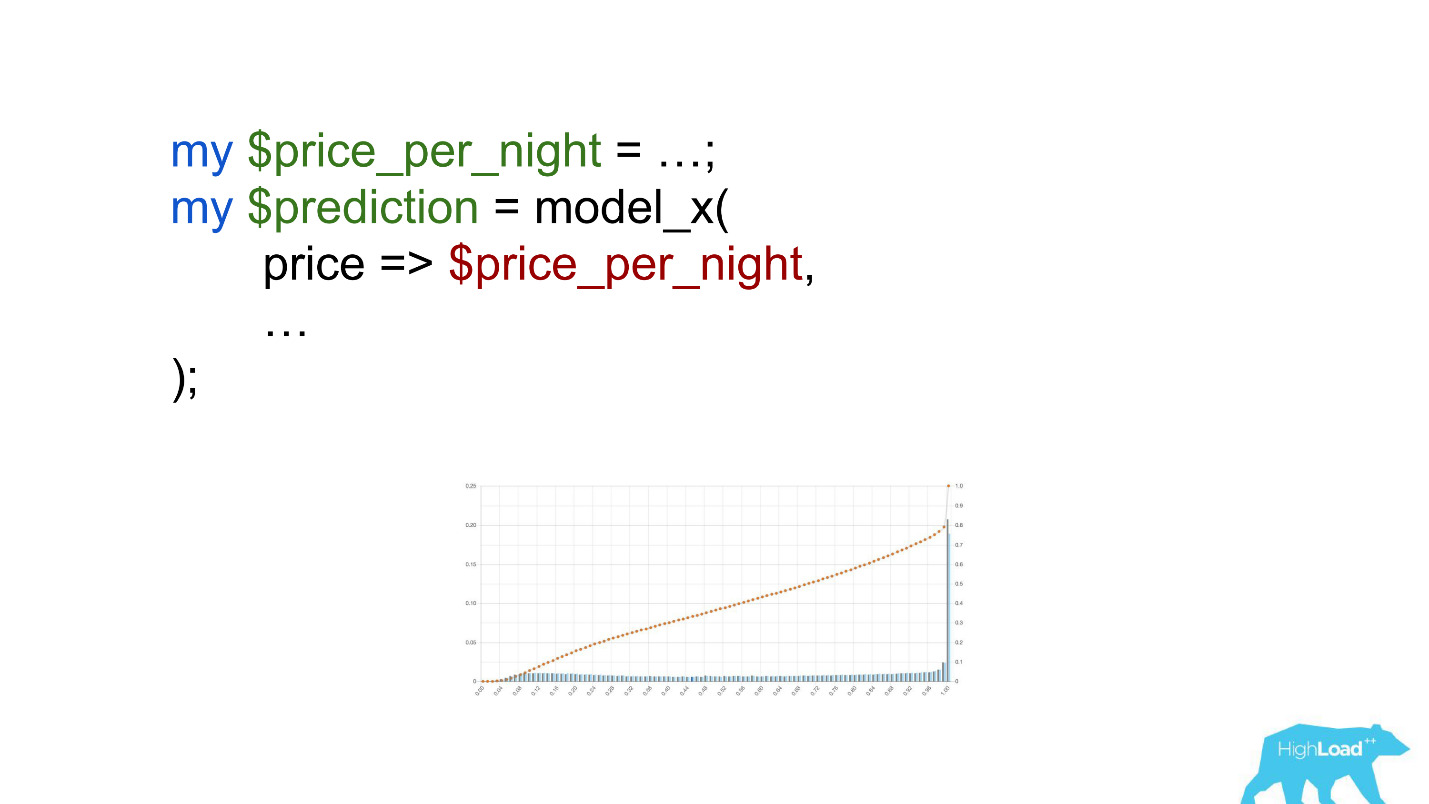
Currencies like rupees or rubles multiplied the scalar product many times, and, therefore, forced this model to give a value close to one, much more often, which we see on the graph.
Thresholds
Another useful feature of these histograms was the possibility of conscious and optimal selection of threshold values.
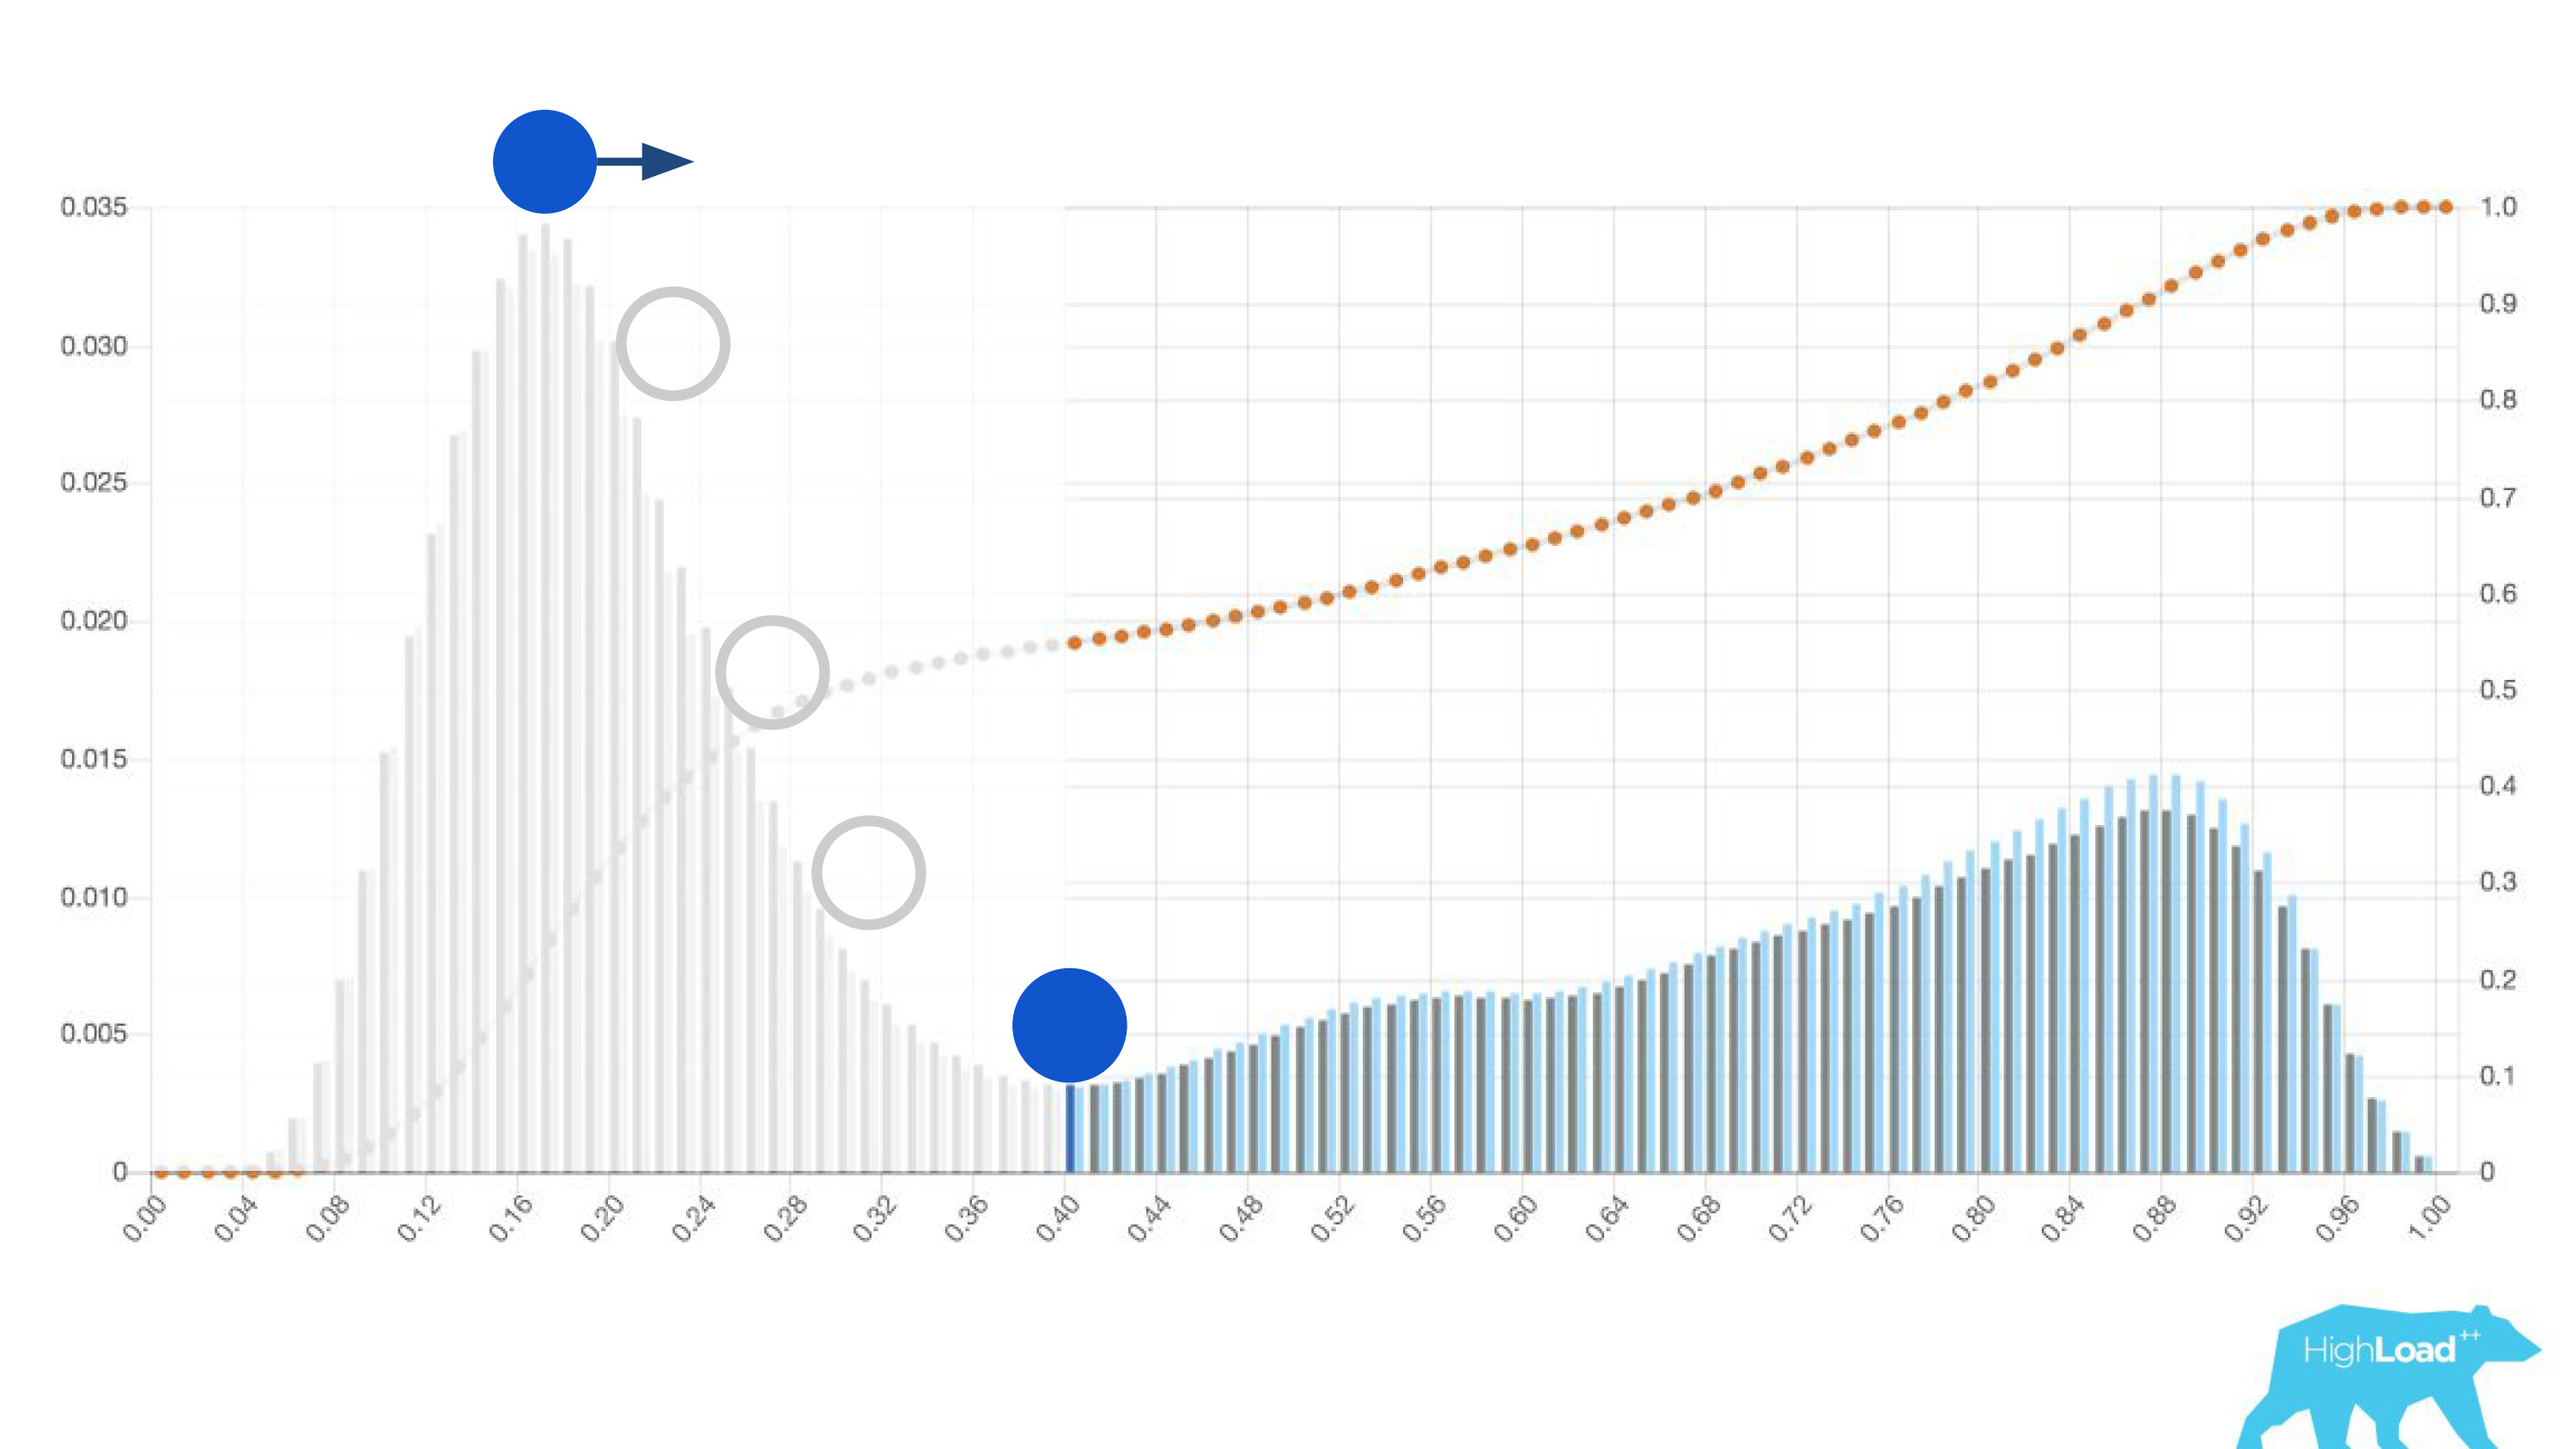
If you place the ball on the highest hill on this histogram, push it and imagine where it will stop, this will be the point that is optimal for class separation. Everything on the right is one class, everything on the left is another.
However, if you start moving this point, you can achieve very interesting effects. Suppose we want to run an experiment, which in case the model says “yes”, somehow changes the user interface. If you move this point to the right, the audience of our experiment is reduced. After all, the number of people who received this prediction is the area under the curve. However, in practice, the accuracy of predictions (precision) is much higher. Similarly, if you do not have enough static power, you can increase the audience of your experiment, but lowering the accuracy of the predictions.
In addition to the predictions themselves, we began to monitor the incoming values in the vectors.
One hot encoding
Most of the features in our simplest models are categorical. This means that these are not numbers, but certain categories: the city from which the user is, or the city in which he is looking for a hotel. We use One Hot Encoding and turn each of the possible values into a unit in a binary vector. Since at first we used only our own computational core, it was easy to determine situations where there is no place for an incoming category in the incoming vector, that is, the model did not see this data during training.
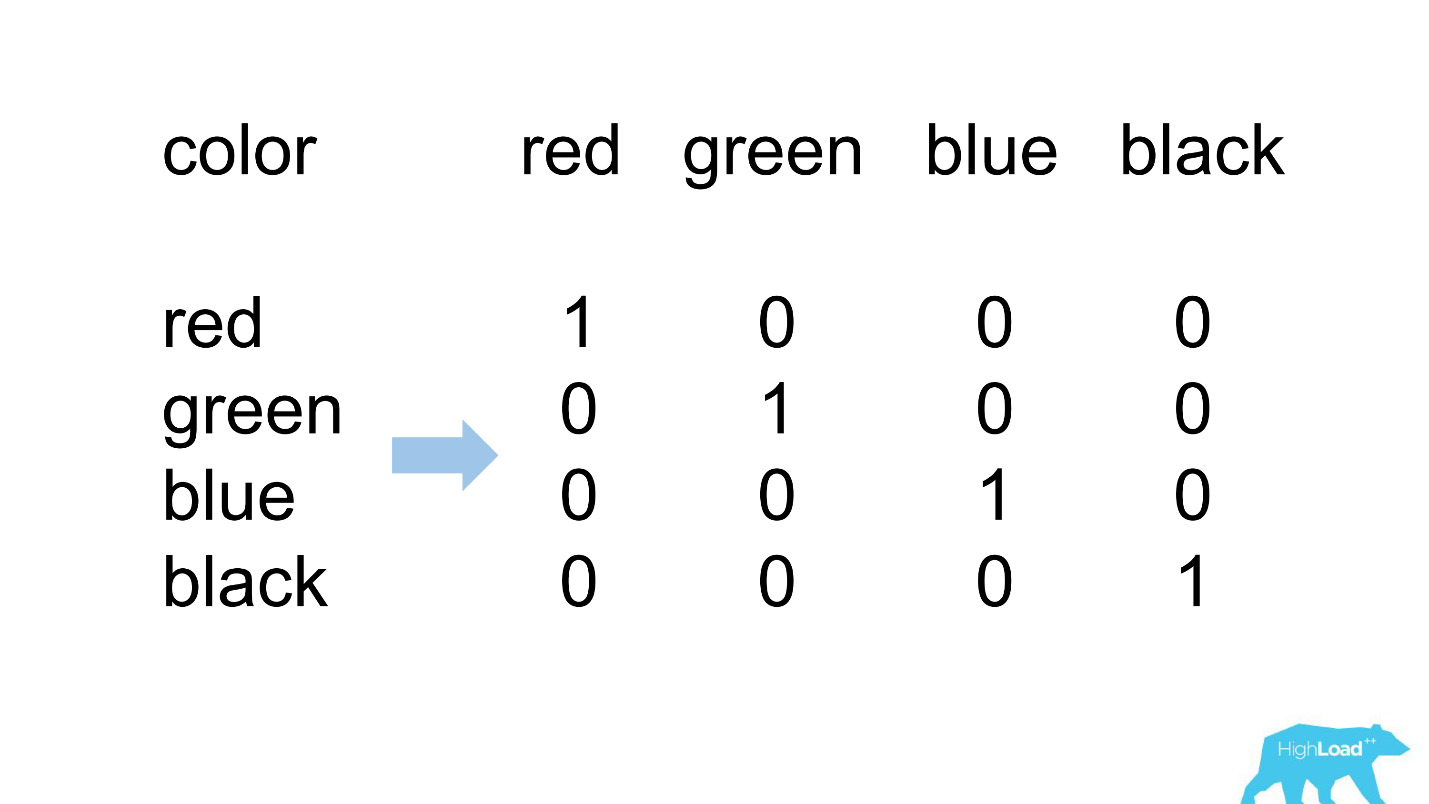
So it usually looks like.
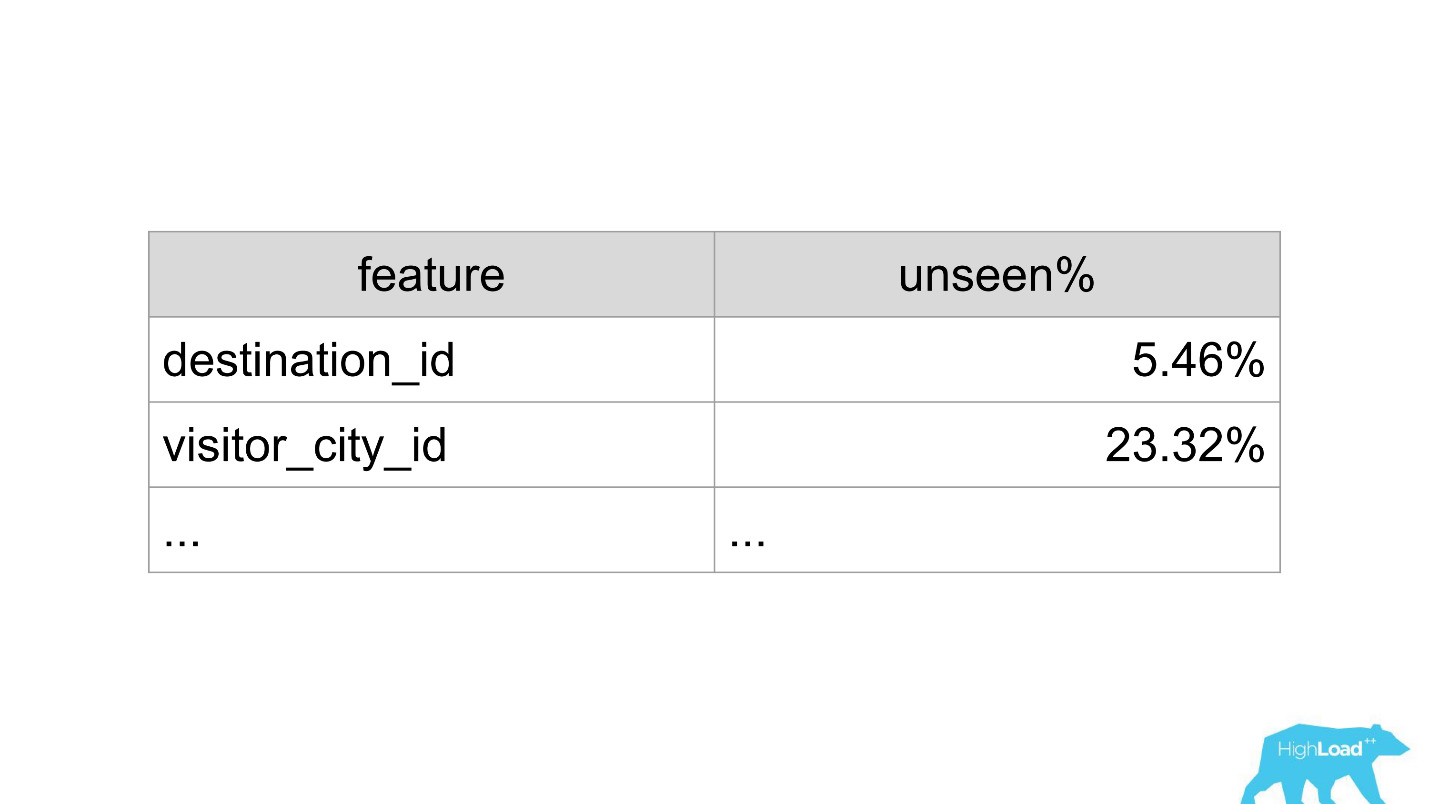
destination_id is the city in which the user is looking for a hotel. It is quite natural that the model did not see approximately 5% of the values, since we constantly connect new cities. visitor_cty_id = 23,32%, because data scientists sometimes deliberately omit rare cities.
In a bad case, it may look like this:

Immediately 3 properties, 100% of the values of which the model has never seen. Most often this occurs due to the use of formats other than those used in training, or simply trivial typos.
Now with the help of dashboards, we detect and correct such situations very quickly.
Machine Learning Showcase
Let's talk about other issues that we solved. After we did client libraries and monitoring, the service began to gain momentum very quickly. We were literally flooded with bids from different parts of the company: “Let's connect this model again! Let's update the old one! ”We just stitched, in fact, any new development stopped.
We have gotten out of the situation by making a self-service kiosk for these data scientists . Now you can just go to our portal, the one that we used at first only for monitoring, and literally pressing the button to load the model into production. In a few minutes it will work and give predictions.
There was one more problem.
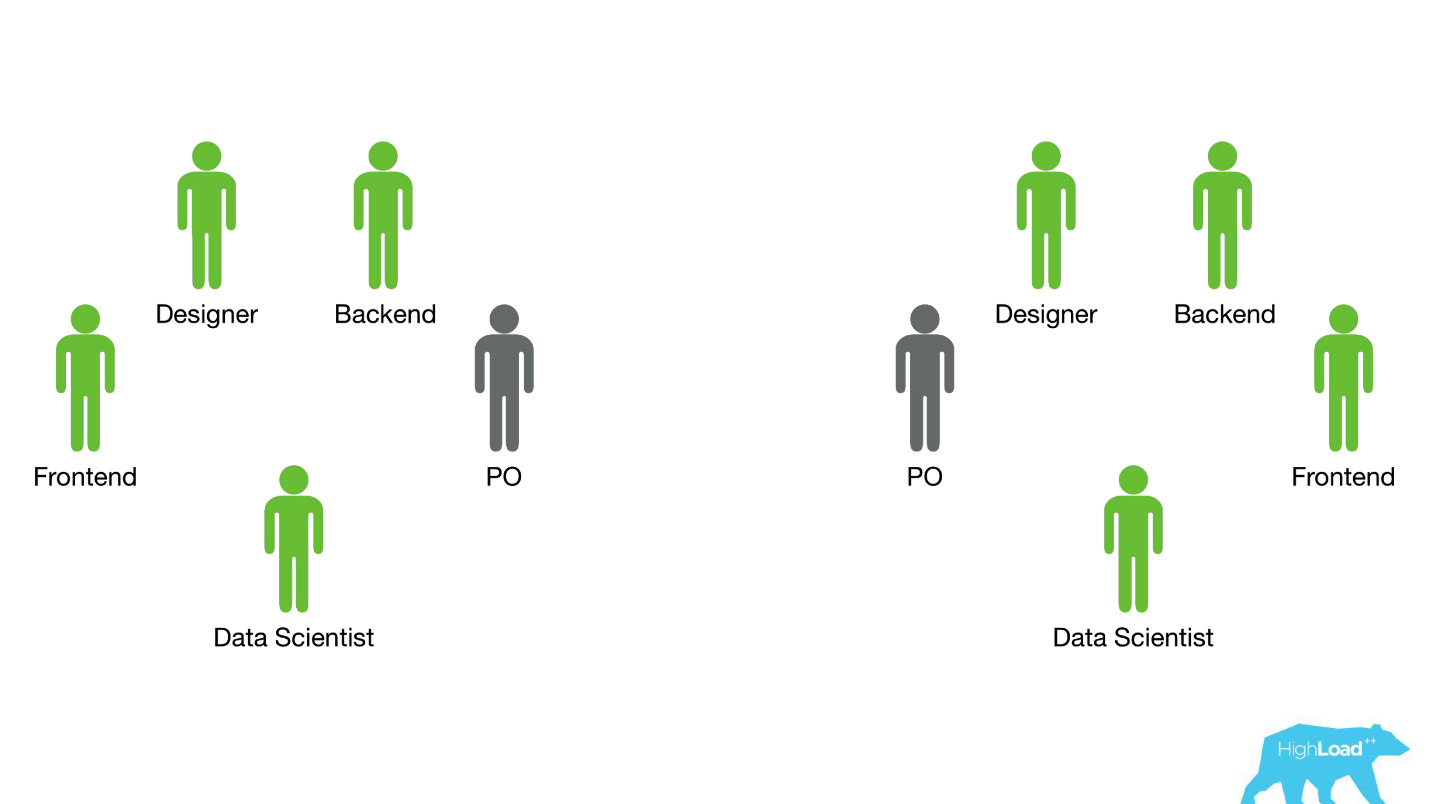
Booking.com is about 200 IT teams. How to let the team know in some completely different part of the company that there is a model that could help them? You may simply not know that such a command even exists. How to find out what models there are and how to use them? Traditionally, external communications in our teams are engaged in PO (Product Owner). This does not mean that we do not have any other horizontal links, just PO is doing this more than others. But it is obvious that on such a scale, one-on-one communication does not scale. Need something to do with it.
How can you facilitate communication?
We suddenly realized that the portal that we did exclusively for monitoring, gradually begins to turn into a showcase of machine learning in our company.
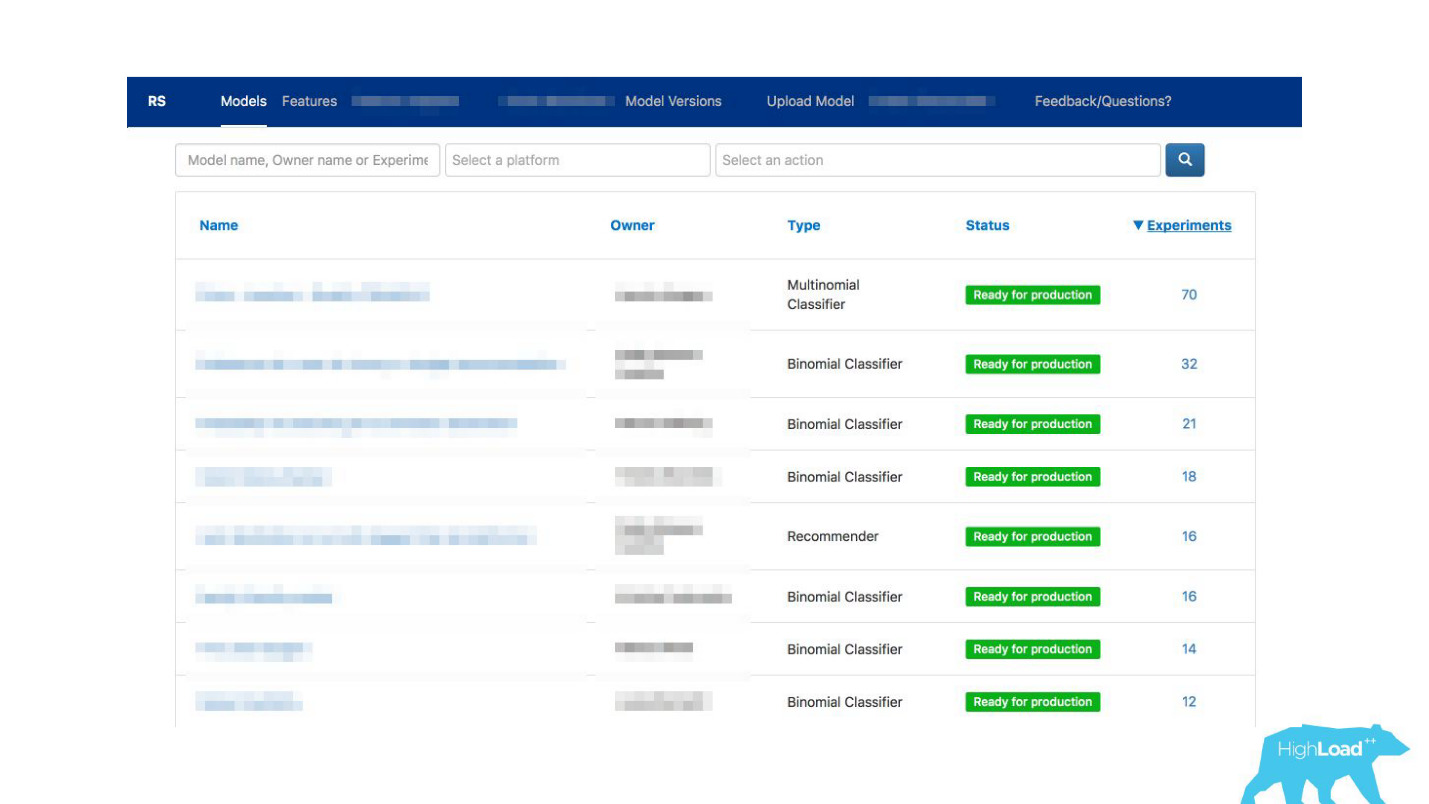
We have given the opportunity to deytasayentist to describe their models in detail. When there were a lot of models, we added tags to topics and areas of applicability for convenient grouping.
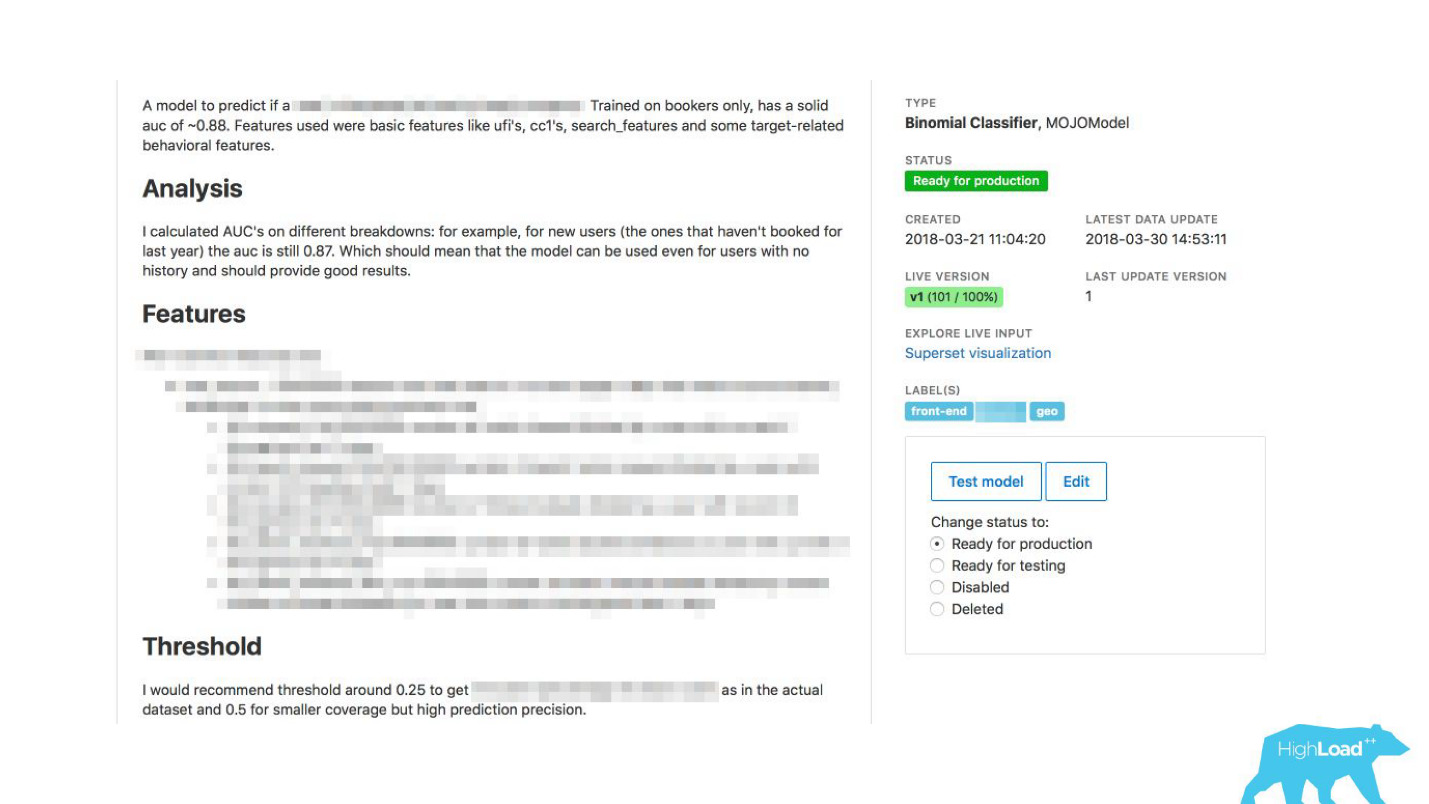
We linked our tool with ExperimentTool. This is a product within our company that provides A / B experiments and stores the entire history of experimentation.

Now, along with the description of the model, you can also see what other teams did with this model before and how successfully. It changed everything.
Seriously, this has changed the way IT works, because even in situations where there is no deytasayentist in the team, you can use machine learning.
For example, many teams use it during brainstorming. When they come up with some new product ideas, they simply select the models that suit them and use them. To do this, do not need anything complicated.
What did it mean for us? Right now at the peak we deliver about 200 thousand predictions per second, while with latency less than 20-30 ms, and including HTTP round trip, and locating more than 200 models.
It may seem that it was such an easy walk in the park: we did everything perfectly, everything works, everyone is happy!
This, of course, does not happen. There were mistakes. At the very beginning, for example, we laid a small time bomb. For some reason, we assumed that most of our models would be recommender systems with heavy input vectors, and the Scala + Akka stack was chosen precisely because it is very easy to organize parallel computations with it. But in reality, the overhead of all this parallelization, the collection together turned out to be higher than the possible gain. At some point, we processed only 100,000 RPS of our 100 machines, and failures occurred with quite characteristic symptoms: CPU utilization is low, but timeouts are obtained.
Then we went back to our computational core, revised, made the benchmarks and as a result of the capacity-testing we learned that for the same traffic we need only 4 cars. Of course, we do not do that, because we have several data centers, we need redundancy of calculations and everything else, but, nevertheless, theoretically we can serve more than 100,000 RPS with just 4 machines.
We are constantly looking for some new monitors that can help us find and correct errors, but do not always take steps in the right direction. At some point, we gathered a small number of models that were used literally across the funnel, starting with the index page, ending with a confirmation of the reservation.
We decided - let's look at how the models change their predictions for the same user. We calculated the variance by grouping everything by user ID, no serious problems were found. The predictions of the models were stable, the variance was around 0.
Another mistake — again technical and organizational — we began to rest on the memory.
The fact is that we store all models on all machines. We started to rest on the memory and thought that it was time to do shards. But the problem is that at the same time batchy were in development - this is the possibility of predictions for one model, but many times. Imagine, for example, a search page, and for each hotel you need to predict something there.
When we started doing sharding, we looked at the live data and were going to shardit very simply - by model ID. The load and volumes of the model were distributed approximately evenly - 49-51%. But when we finished sharding, the batch was already used in production. We had hot models that were used much more than others, and the imbalance was big. Finally, we will solve this problem when we finally go to the containers.
Future plans
First of all, we still want to give the data scientists the opportunity to observe in dynamics the same metrics that they use in their training. We want Label based metrics, and to observe precision and recall in real time.
The company still has internal tools and products with which we are poorly integrated. These are mostly high-load projects, because for everything else we have made a couple of client libraries for Perl and Java, and everyone who needs it can use it. Analysts have easy integration with Spark, they can use our models for their own purposes.
We want to be able to deploy custom code together with the models.
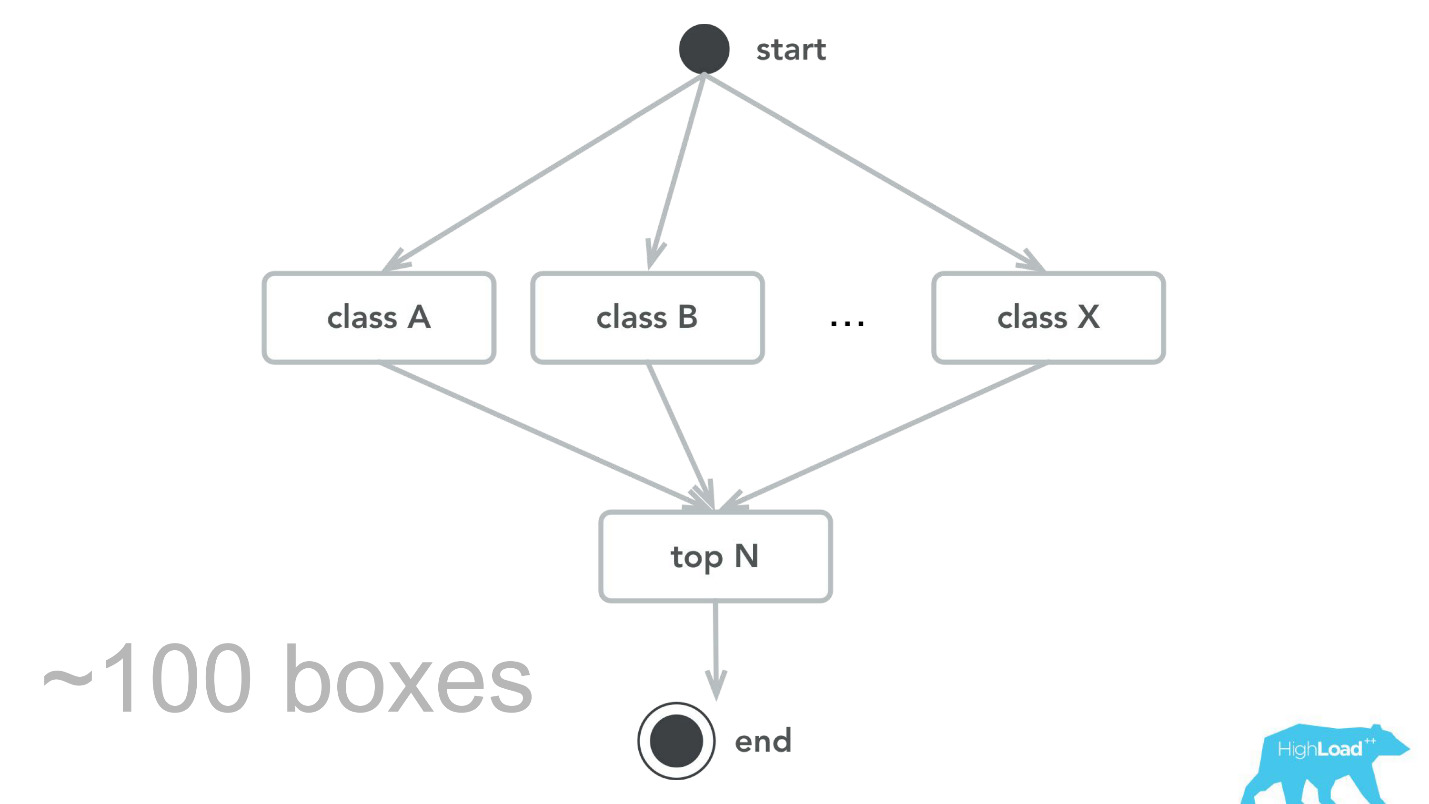
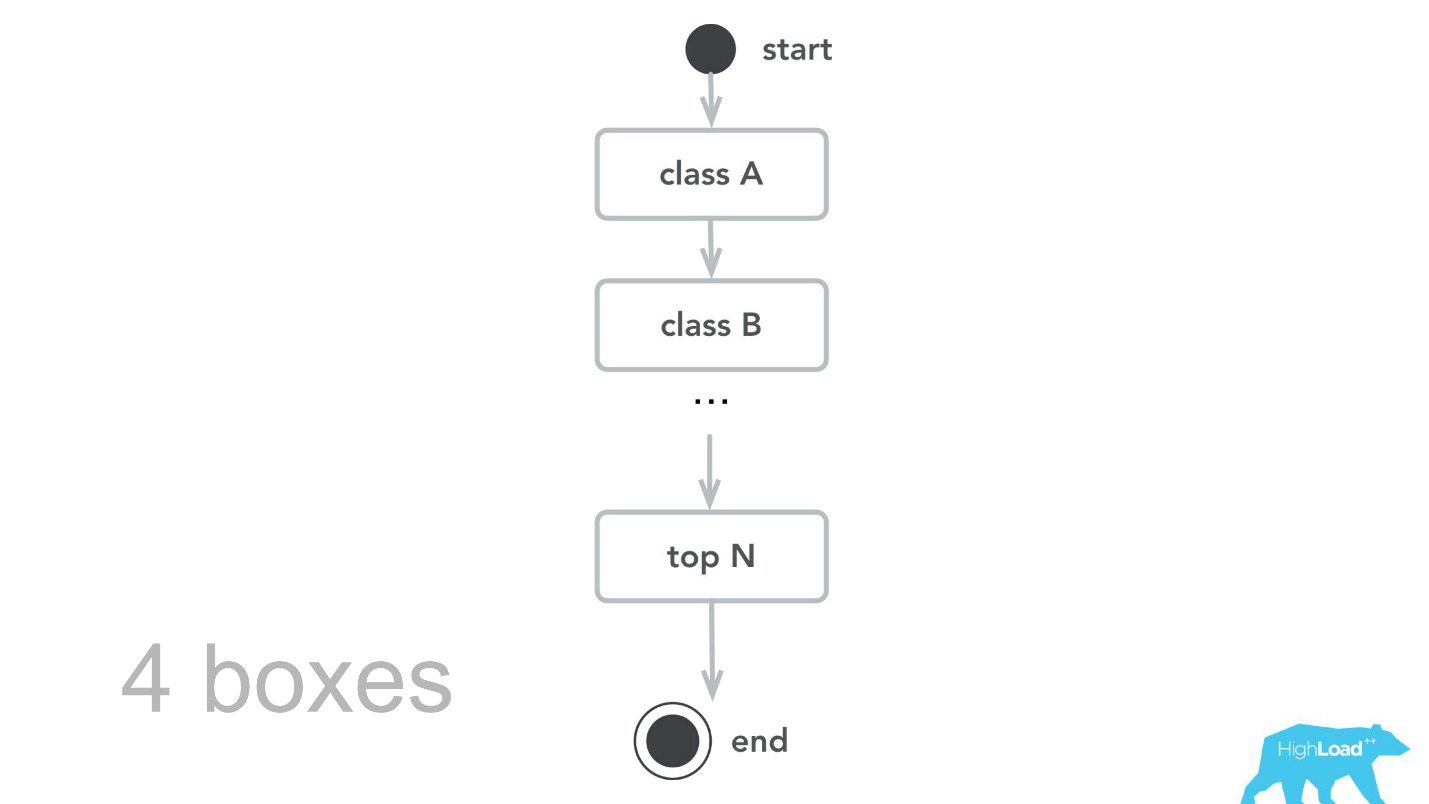
For example, imagine a spam classifier. All procedures that occur before receiving the incoming weight vector, for example, splitting the text into sentences, into words, steaming - you must repeat in the production environment again, preferably in the same way in order to avoid mistakes.
We want to get rid of this problem. We want to deploy a piece of pipeline developed for training a model, along with the model. Then you can send just letters to us, and we will say, spam or not spam.
We want to make an asynchronous prediction. The complexity of our models is growing, and we consider everything slower than 50 ms to be very slow . Imagine a model that makes predictions solely on the basis of the history of visited pages on our site. Then we can run these predictions at the time of rendering the page, and take them and use them when we need to.
Start small
We achieved our first machine learning successes, it is ridiculous to say, exploding the predictions in MySQL. Perhaps you also have the first steps that you can take now. You do not need any sophisticated tools for this. B I have the same advice to deytasayentists. If you do not work with video, with voice and with an image, if your task is somehow related to transactional data - do not take too complex models right away.
Monitor
Monitor everything - you monitor your software, web servers, hardware. The model is the same software . The only difference is the software that was not written by you. He was written by another program, which, in turn, was written by a deithasayentist. Otherwise, everything is the same: input arguments, return values. Know what is happening in reality, how well the model copes with its work, whether everything goes in a regular way - monitor!
Organization footprint
Think about how your organization works. Virtually any of your steps in this direction will change the way people work around you. Think about how they can be helped to solve their problems and how you can make great strides together.
(Don't) Follow our steps
I shared some successes, failures, problems that we faced. I hope this will help someone to get around the shoals we were sitting on. Do as we do, but do not repeat our mistakes. Or repeat - who in the end said that your situation is exactly the same as ours? Who said that what did not work for us will not work for you?
Try, make mistakes, share your mistakes!
About speaker: Viktor Bilyk introduces machine learning products into commercial operation on Booking.com.
First, let's see where Booking.com uses machine learning, in which products.
First, it is a large number of recommendation systems for hotels, directions, dates, and in different points of the sales funnel and in different contexts. For example, we are trying to guess where you will go when you have not entered anything into the search line at all.
This is a screenshot in my account, and I will definitely visit two of these areas this year.
We process almost any text messages from clients, starting with banal spam filters, ending with such complex products as Assistant and ChatToBook, where models are used to define intentions and recognize entities. In addition, there are models that are not so noticeable, for example, Fraud Detection.
We analyze reviews. Models tell us why people go to, say, Berlin.
With the help of machine learning models it is analyzed, for which they praise the hotel, so that you do not have to read thousands of reviews by yourself.
In some places of our interface, almost every piece is tied to the predictions of some models. For example, here we are trying to predict when the hotel will be sold out.
Often we are right - after 19 hours the last room is already booked.
Or, for example, - badge "Favorable offer". Here we are trying to formalize the subjective: what is a good offer in general? How to understand that the prices offered by the hotel for these dates are good? After all, this, apart from the price, depends on many factors, such as additional services, and often, in general, from external causes, if, for example, a football world championship or a large technical conference is taking place in this city.
Begin implementation
Let's wind off a few years ago, in 2015. Some of the products I have mentioned already exist. In this system, which I will talk about today, yet. How did the introduction happen at that time? Things were, frankly, not very. The fact is that we had a huge problem, part of which was technical, and part was organizational.
We sent deytasayentistov in already existing cross-functional teams that are working on a specific user problem, and expected that they would somehow improve the product.
Most often, these pieces of product were built on a Perl stack. There is a very obvious problem with Perl - it is not designed for intensive calculations, and our backend is already loaded with other things. At the same time, the development of serious systems that would solve this problem would not have been possible to prioritize within the team, because the team’s focus is on solving a user problem, and not on solving a user problem using machine learning. Therefore, the Product Owner (PO) would be quite against it.
Let's see how it happened then.
There were only two options - I know for sure, because at that time I was working on such a team and helped the data scientists to bring their first models into battle.
The first option was the materialization of the predictions.. Suppose there is a very simple model with only two features:
- the country where the visitor is located;
- the city in which he is looking for a hotel.
We need to predict the likelihood of some event. We just blow up all the input vectors: let's say 100,000 cities, 200 countries - a total of 20 million lines in MySQL. Sounds like a completely workable option for outputting some small ranking systems or other simple models to production.
Another option is to embed predictions directly into the backend code . There are big limitations - hundreds, maybe thousands of coefficients - that's all we could afford.
Obviously, neither one nor the other way does not allow to bring any complex model into production. This limited the deytasayentists and the success they could achieve by improving products. Obviously, this problem had to be solved somehow.
Prediction Service
The first thing we did was a prediction service. Probably, even the simplest architecture ever shown on Habré and HighLoad ++.
We wrote a small application on Scala + Akka + Spray, which simply received incoming vectors and gave the prediction back. Actually, I’m a little crafty - the system was a bit more complicated, because we needed to somehow monitor and roll it out. In reality, it all looked like this:
Booking.com has an event system - something like a magazine for all systems. There it is very easy to write, and this stream is very simple to redirect. At first, we needed to send client telemetry with perceived latencies and detailed information from the server side to Graphite and Grafana.
We made simple client libraries for Perl - we hid the whole RPC in a local call, put several models in there and the service started to take off. It was easy enough to sell such a product, because we were able to implement more complex models and spend much less time .
The data consultants began to work with much less restrictions, and the work of the back-tenders in some cases was reduced to one-liner.
Product predictions
But let's briefly go back to how we used these predictions in the product.
There is a model that makes prediction based on known facts. Based on this prediction, we somehow change the user interface. This, of course, is not the only scenario of using machine learning in our company, but rather common.
What is the problem of running such features? The thing is that these are two things in one bottle: the model and the change of the user interface. It is very difficult to separate the effects from one and the other.
Imagine launching the “Favorable Offer” badge as part of an AB-experiment. If it does not take off - there is no statistically significant change in the target metrics - it is not known what the problem is: an incomprehensible, small, imperceptible badge or a bad model.
In addition, models can degrade, and there can be a lot of reasons for this. What worked yesterday doesn't necessarily work today. In addition, we are constantly in the cold-start mode, constantly connecting new cities and hotels, people from new cities come to us. We need to somehow understand that the model still summarizes well in these pieces of incoming space.
The most probably recently known case of degradation of the model was the story of Alexa. Most likely, as a result of the retraining, she began to understand random noises as a request to laugh, and began to laugh at night, frightening the owners.
Prediction Monitoring
In order to monitor the predictions, we have slightly modified our system (the diagram below). Similarly, from the event-system, we redirected the stream to Hadoop and began to save, besides everything that we saved before, also all the input vectors, and all the predictions that our system made. Then, using Oozie, we aggregated them in MySQL and from there we showed a small web application to those who are interested in some of the qualitative characteristics of the models.
However, it is important to figure out what to show there. The thing is that it’s very difficult to calculate the usual metrics used in training models, in our case, because we often have a huge delay in labels.
Consider this by example. We want to predict whether the user is going on vacation alone or with his family. We need this prediction when a person chooses a hotel, but we can learn the truth only after a year. Only having already gone on vacation, the user will receive an invitation to leave a review, where, among other things, there will be a question whether he was there alone or with his family.
That is, you need somewhere to store all the predictions made in a year, and also so that you can quickly find matches with the incoming labels. It sounded like a very serious, maybe even a very heavy investment. Therefore, until we have coped with this problem, we decided to do something simpler.
This "simpler" was just a histogram of predictions made by the model.
Above on the chart is a logistic regression that predicts whether the user will change the date of his trip or not. It can be seen that it divides users quite well into two classes: on the left, the hill are those who do not do it; on the right is the hill - those who will do it.
In fact, we even show two graphs: one for the current period and the other for the previous one. It is clearly seen that this week (this is a weekly chart), the model predicts a change in dates a little more often. It is difficult to say for sure whether this is seasonality or that degradation with time.
This led to a change in the workflow of deytasayentists, who stopped engaging other people and began to more quickly iterate their models. They sent models in production to dry-run along with backend engineers. That is, the vectors were collected, the model made a prediction, but these predictions were not used in any way.
In the case of a badge, we simply did not show anything, as before, but collected statistics. This allowed us not to waste time on pre-failure projects. We freed up the time for front-end designers and designers for other experiments. As long as the data scientist is not sure that the model works the way it wants, it simply does not involve others in this process.
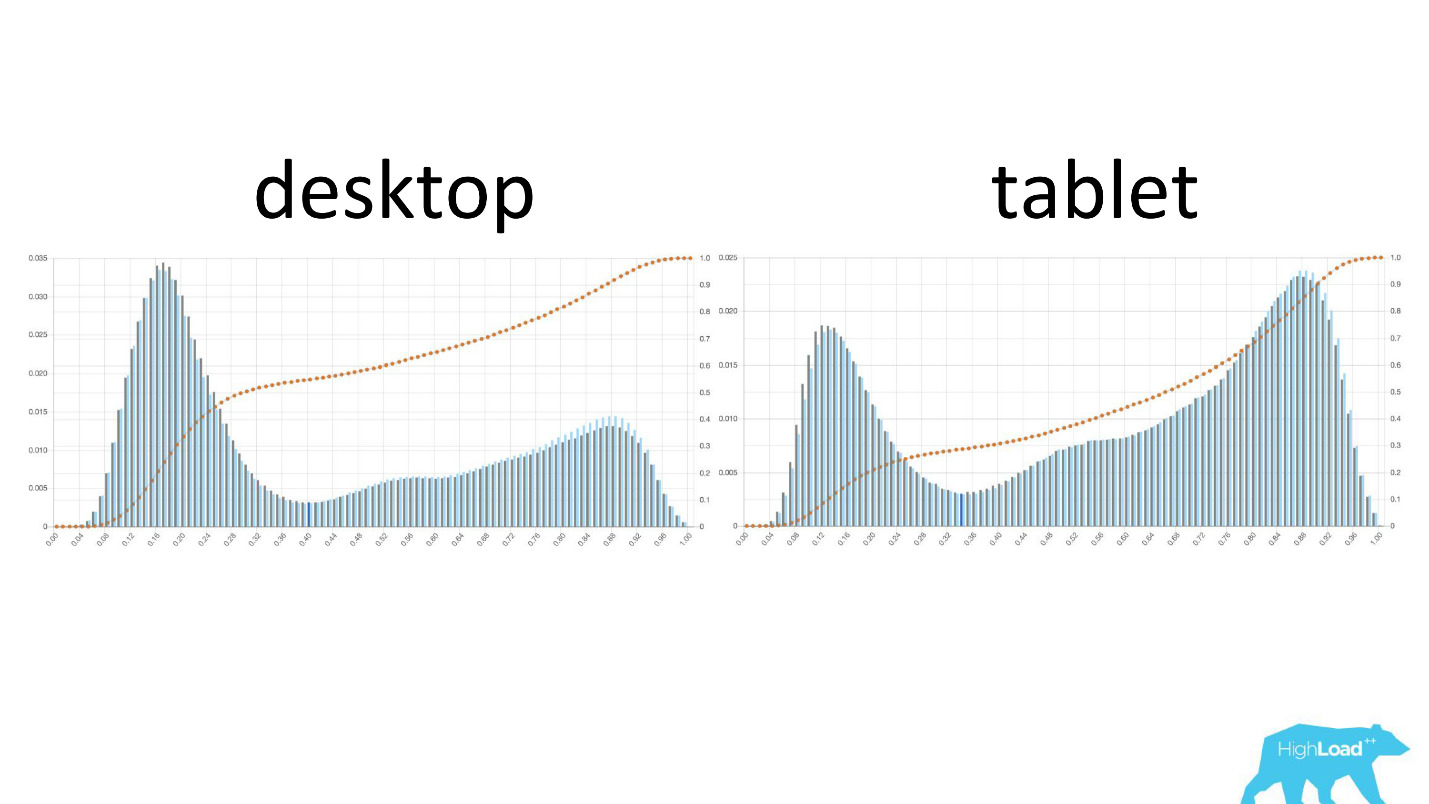
It is interesting to see how the graphs change in different cuts.
On the left - the probability of changing dates on the desktop, on the right - on the tablets. It is clearly seen that on the plates the model predicts a more likely change of dates. This is most likely due to the fact that the tablet is often used for travel planning and less often for booking.
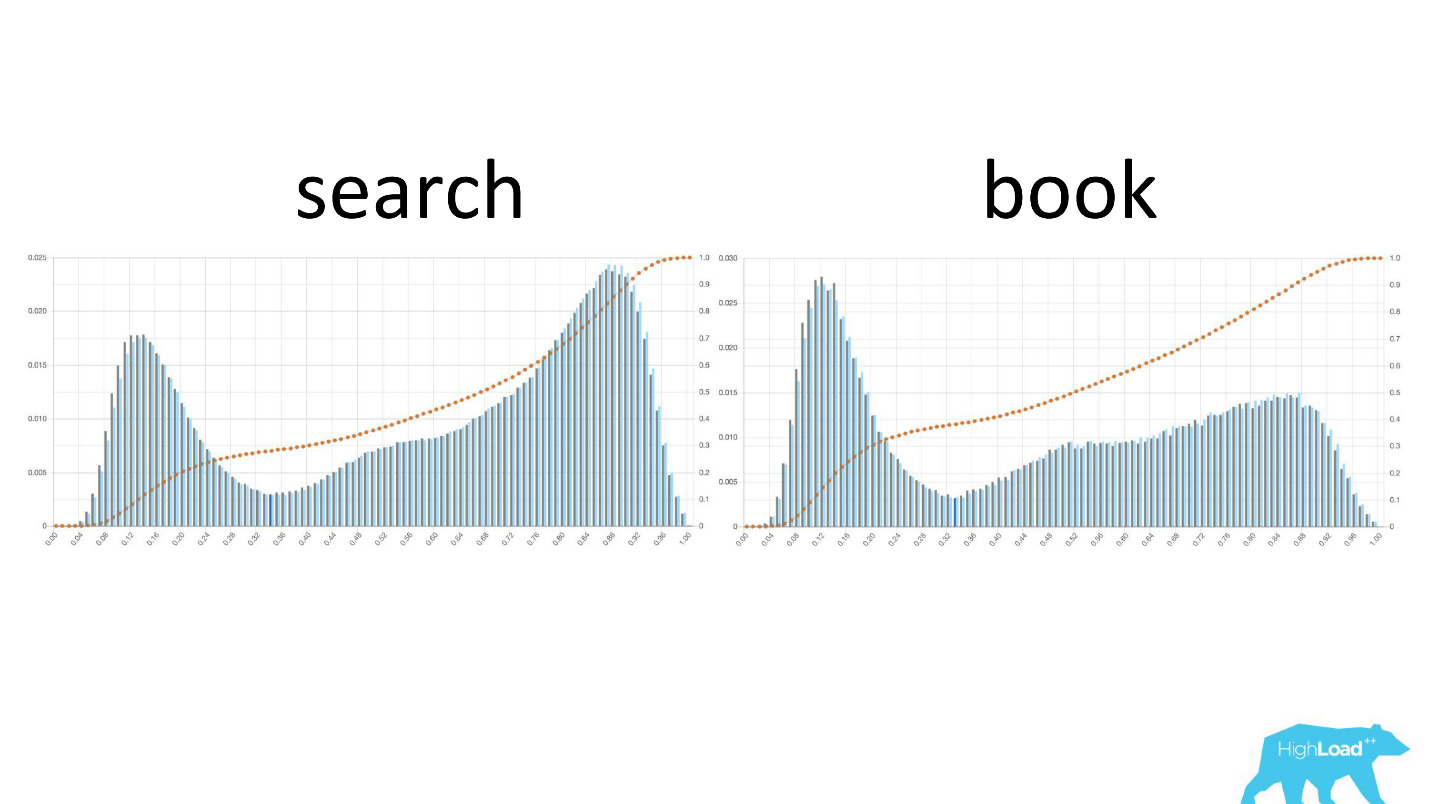
It is also interesting to see how these graphs change as users move along the sales funnel.
On the left, the probability of changing dates on the search page, on the right - on the first booking page. It can be seen that a much larger number of people who have already decided on their dates get to the booking page.
But these were good graphics. What do the bad look like? Very different. Sometimes it's just noise, sometimes a huge hill, which means that the model cannot effectively separate any two classes of predictions.
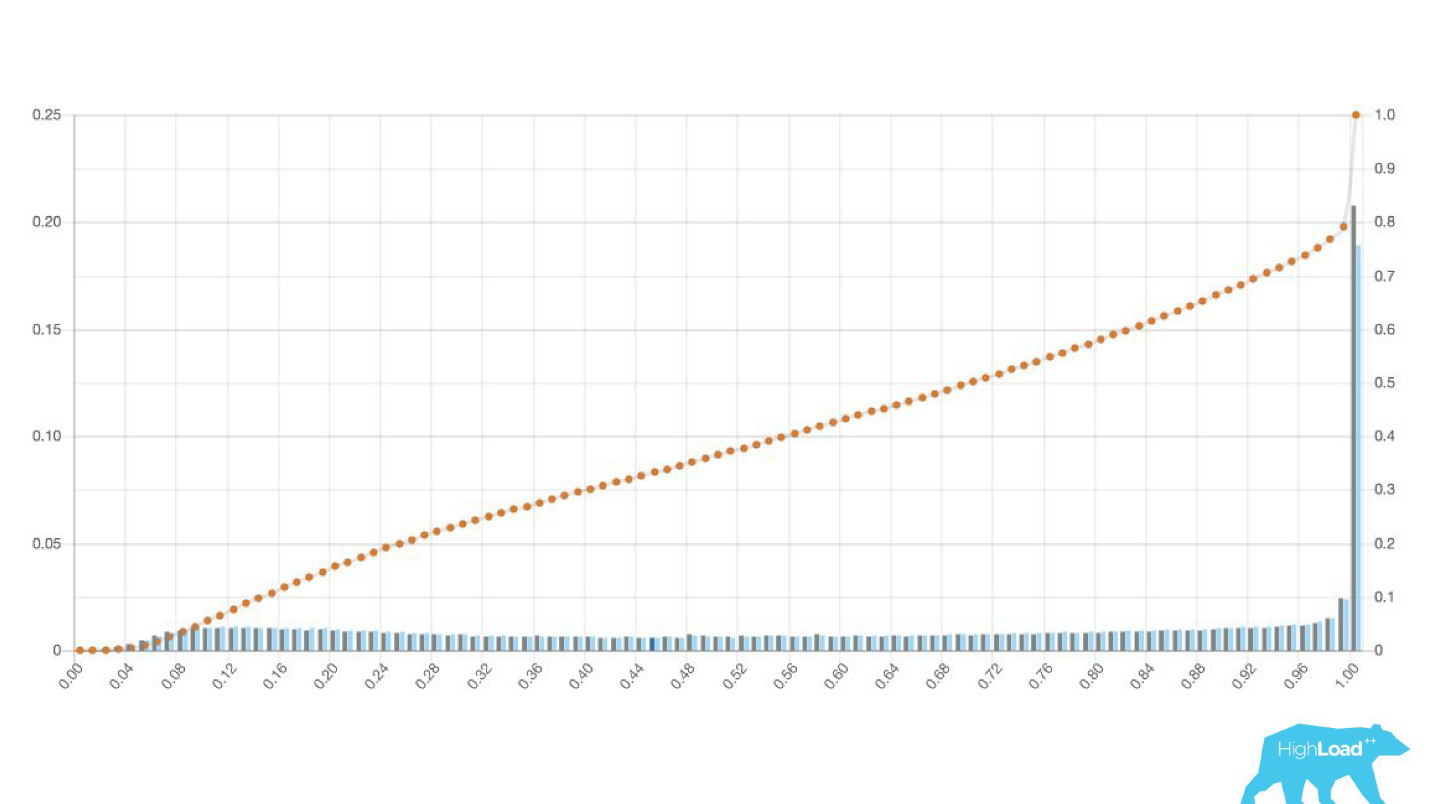
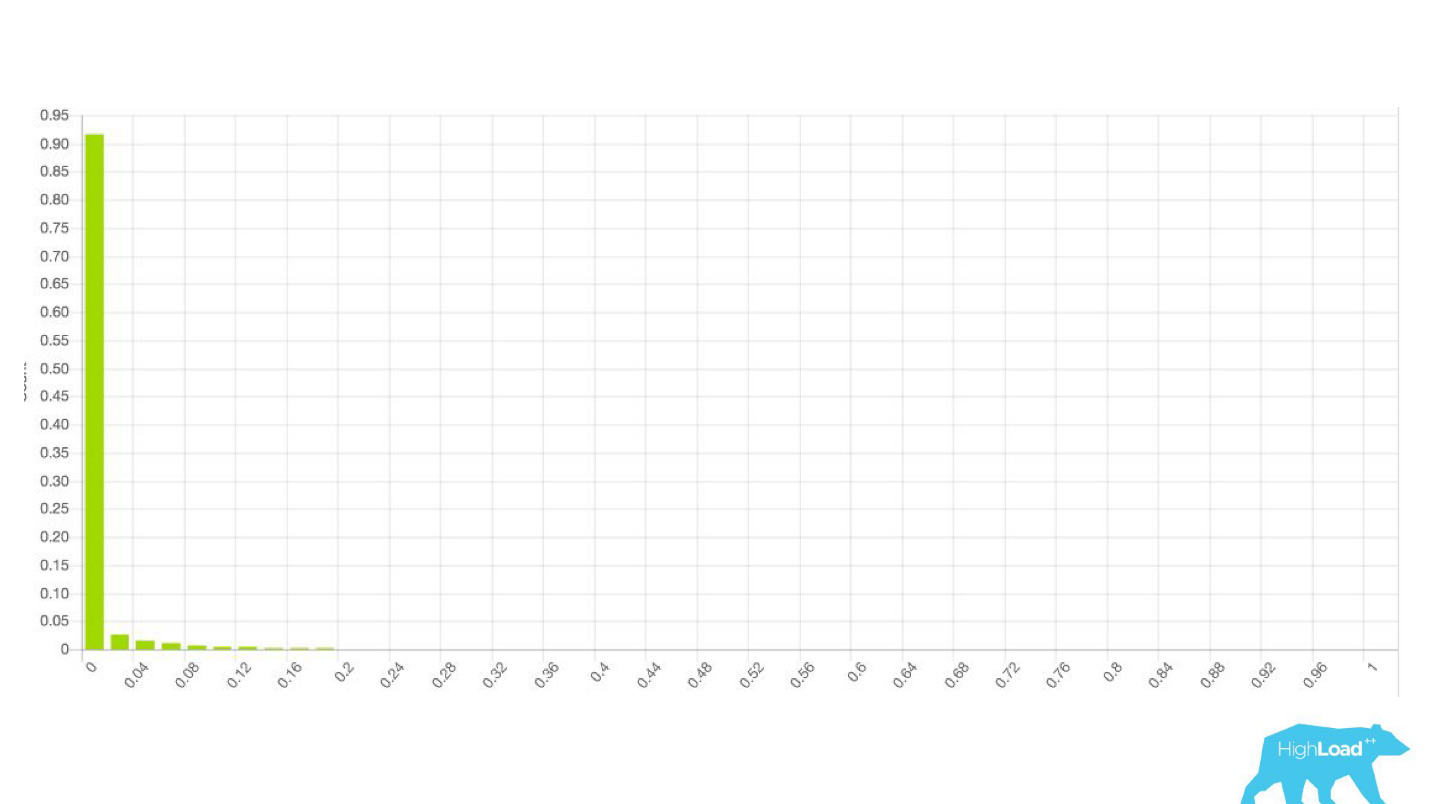
Sometimes these are huge peaks.
This is also a logistic regression, and until a certain moment it showed a beautiful picture with two hills, but one morning it became like this.
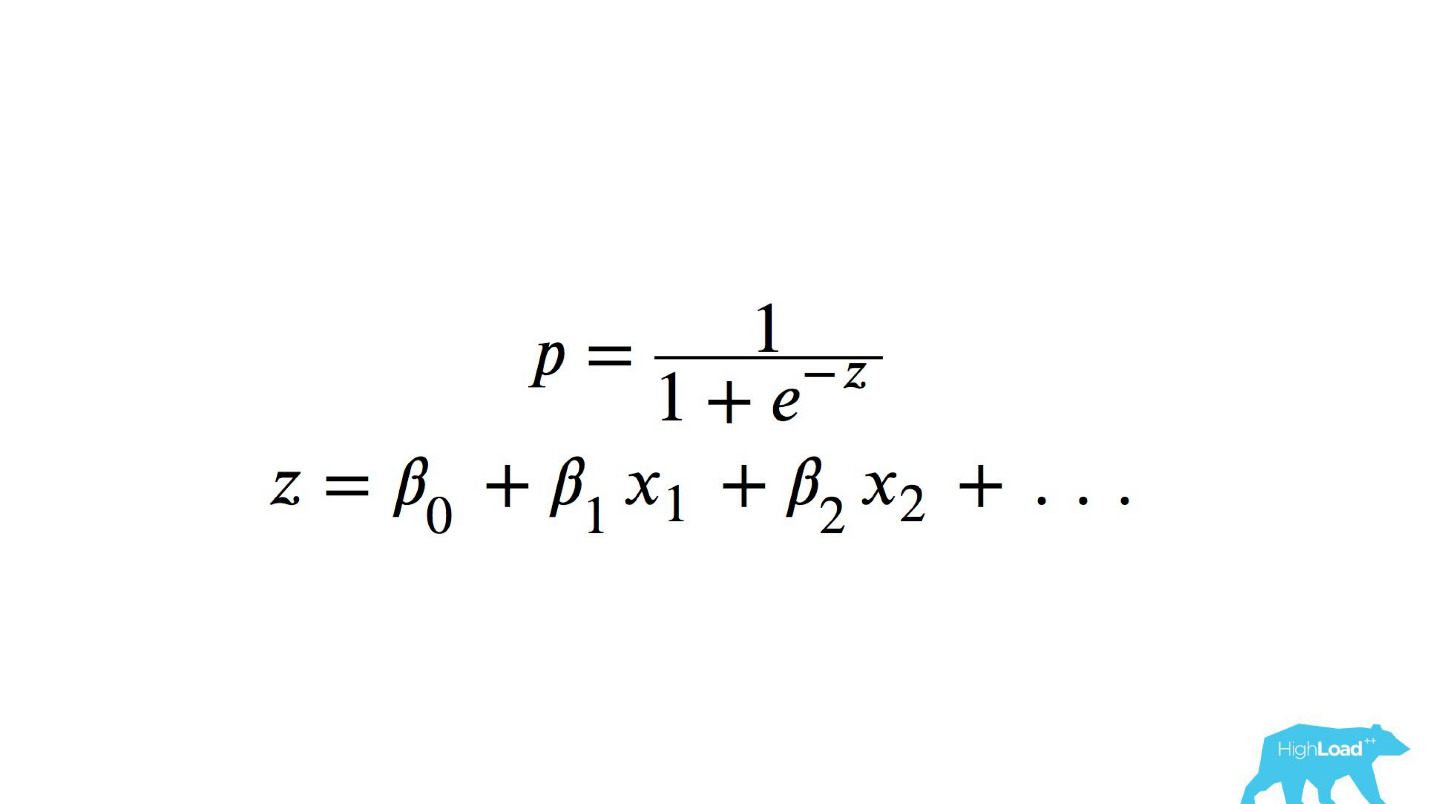
In order to understand what happened inside, you need to understand how the logistic regression is calculated.
Quick reference
This is the logistic function of the scalar product, where x n are some features. One of these features was the price of the night at the hotel (in euros).
Calling this model would be worth something like this:
Pay attention to the selection. It was necessary to convert the price into euros, but the developer forgot to do it.
Currencies like rupees or rubles multiplied the scalar product many times, and, therefore, forced this model to give a value close to one, much more often, which we see on the graph.
Thresholds
Another useful feature of these histograms was the possibility of conscious and optimal selection of threshold values.
If you place the ball on the highest hill on this histogram, push it and imagine where it will stop, this will be the point that is optimal for class separation. Everything on the right is one class, everything on the left is another.
However, if you start moving this point, you can achieve very interesting effects. Suppose we want to run an experiment, which in case the model says “yes”, somehow changes the user interface. If you move this point to the right, the audience of our experiment is reduced. After all, the number of people who received this prediction is the area under the curve. However, in practice, the accuracy of predictions (precision) is much higher. Similarly, if you do not have enough static power, you can increase the audience of your experiment, but lowering the accuracy of the predictions.
In addition to the predictions themselves, we began to monitor the incoming values in the vectors.
One hot encoding
Most of the features in our simplest models are categorical. This means that these are not numbers, but certain categories: the city from which the user is, or the city in which he is looking for a hotel. We use One Hot Encoding and turn each of the possible values into a unit in a binary vector. Since at first we used only our own computational core, it was easy to determine situations where there is no place for an incoming category in the incoming vector, that is, the model did not see this data during training.
So it usually looks like.
destination_id is the city in which the user is looking for a hotel. It is quite natural that the model did not see approximately 5% of the values, since we constantly connect new cities. visitor_cty_id = 23,32%, because data scientists sometimes deliberately omit rare cities.
In a bad case, it may look like this:
Immediately 3 properties, 100% of the values of which the model has never seen. Most often this occurs due to the use of formats other than those used in training, or simply trivial typos.
Now with the help of dashboards, we detect and correct such situations very quickly.
Machine Learning Showcase
Let's talk about other issues that we solved. After we did client libraries and monitoring, the service began to gain momentum very quickly. We were literally flooded with bids from different parts of the company: “Let's connect this model again! Let's update the old one! ”We just stitched, in fact, any new development stopped.
We have gotten out of the situation by making a self-service kiosk for these data scientists . Now you can just go to our portal, the one that we used at first only for monitoring, and literally pressing the button to load the model into production. In a few minutes it will work and give predictions.
There was one more problem.
Booking.com is about 200 IT teams. How to let the team know in some completely different part of the company that there is a model that could help them? You may simply not know that such a command even exists. How to find out what models there are and how to use them? Traditionally, external communications in our teams are engaged in PO (Product Owner). This does not mean that we do not have any other horizontal links, just PO is doing this more than others. But it is obvious that on such a scale, one-on-one communication does not scale. Need something to do with it.
How can you facilitate communication?
We suddenly realized that the portal that we did exclusively for monitoring, gradually begins to turn into a showcase of machine learning in our company.
We have given the opportunity to deytasayentist to describe their models in detail. When there were a lot of models, we added tags to topics and areas of applicability for convenient grouping.
We linked our tool with ExperimentTool. This is a product within our company that provides A / B experiments and stores the entire history of experimentation.
Now, along with the description of the model, you can also see what other teams did with this model before and how successfully. It changed everything.
Seriously, this has changed the way IT works, because even in situations where there is no deytasayentist in the team, you can use machine learning.
For example, many teams use it during brainstorming. When they come up with some new product ideas, they simply select the models that suit them and use them. To do this, do not need anything complicated.
What did it mean for us? Right now at the peak we deliver about 200 thousand predictions per second, while with latency less than 20-30 ms, and including HTTP round trip, and locating more than 200 models.
It may seem that it was such an easy walk in the park: we did everything perfectly, everything works, everyone is happy!
This, of course, does not happen. There were mistakes. At the very beginning, for example, we laid a small time bomb. For some reason, we assumed that most of our models would be recommender systems with heavy input vectors, and the Scala + Akka stack was chosen precisely because it is very easy to organize parallel computations with it. But in reality, the overhead of all this parallelization, the collection together turned out to be higher than the possible gain. At some point, we processed only 100,000 RPS of our 100 machines, and failures occurred with quite characteristic symptoms: CPU utilization is low, but timeouts are obtained.
Then we went back to our computational core, revised, made the benchmarks and as a result of the capacity-testing we learned that for the same traffic we need only 4 cars. Of course, we do not do that, because we have several data centers, we need redundancy of calculations and everything else, but, nevertheless, theoretically we can serve more than 100,000 RPS with just 4 machines.
We are constantly looking for some new monitors that can help us find and correct errors, but do not always take steps in the right direction. At some point, we gathered a small number of models that were used literally across the funnel, starting with the index page, ending with a confirmation of the reservation.
We decided - let's look at how the models change their predictions for the same user. We calculated the variance by grouping everything by user ID, no serious problems were found. The predictions of the models were stable, the variance was around 0.
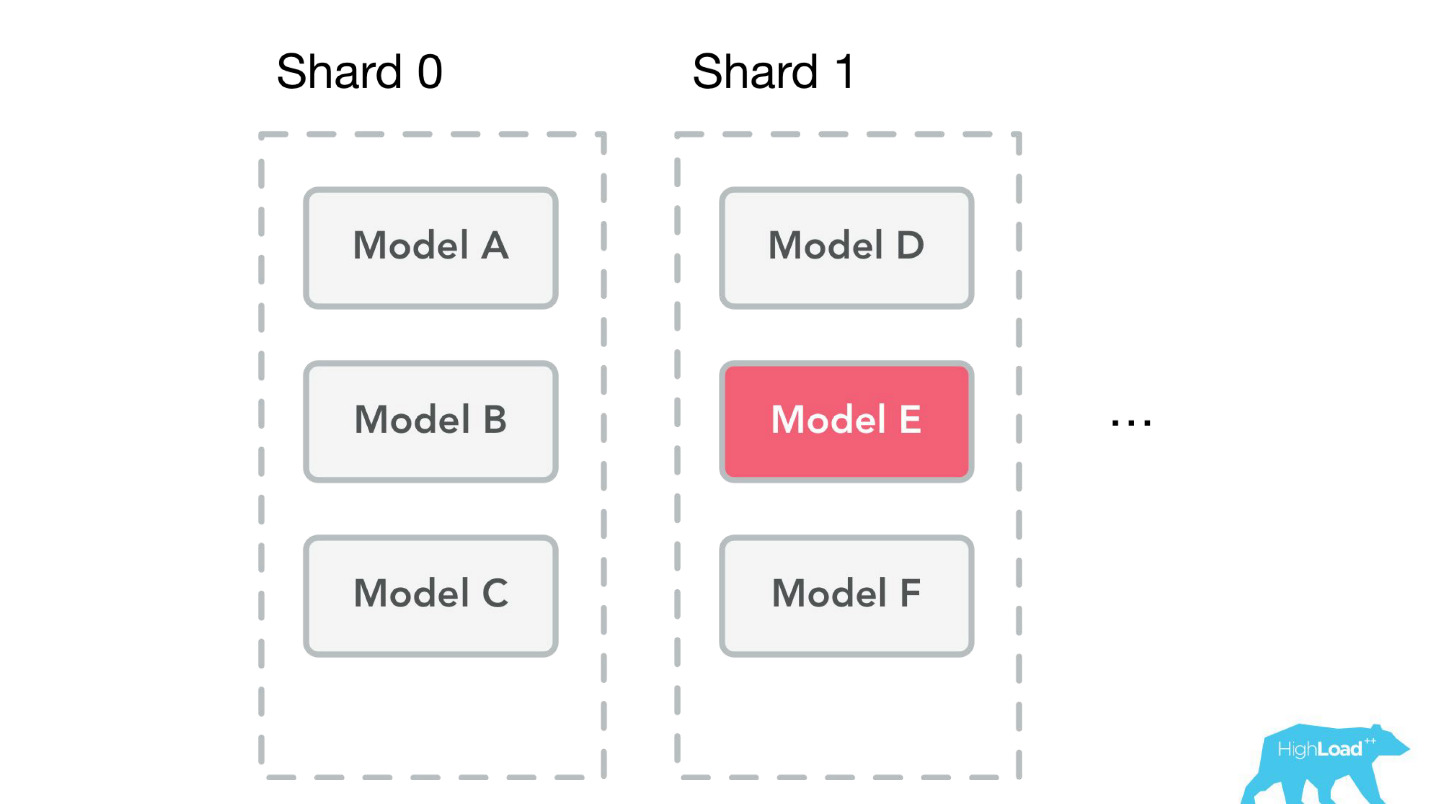
Another mistake — again technical and organizational — we began to rest on the memory.
The fact is that we store all models on all machines. We started to rest on the memory and thought that it was time to do shards. But the problem is that at the same time batchy were in development - this is the possibility of predictions for one model, but many times. Imagine, for example, a search page, and for each hotel you need to predict something there.
When we started doing sharding, we looked at the live data and were going to shardit very simply - by model ID. The load and volumes of the model were distributed approximately evenly - 49-51%. But when we finished sharding, the batch was already used in production. We had hot models that were used much more than others, and the imbalance was big. Finally, we will solve this problem when we finally go to the containers.
Future plans
- Label based metrics
First of all, we still want to give the data scientists the opportunity to observe in dynamics the same metrics that they use in their training. We want Label based metrics, and to observe precision and recall in real time.
- More tools & integrations
The company still has internal tools and products with which we are poorly integrated. These are mostly high-load projects, because for everything else we have made a couple of client libraries for Perl and Java, and everyone who needs it can use it. Analysts have easy integration with Spark, they can use our models for their own purposes.
- Reusable training pipelines
We want to be able to deploy custom code together with the models.
For example, imagine a spam classifier. All procedures that occur before receiving the incoming weight vector, for example, splitting the text into sentences, into words, steaming - you must repeat in the production environment again, preferably in the same way in order to avoid mistakes.
We want to get rid of this problem. We want to deploy a piece of pipeline developed for training a model, along with the model. Then you can send just letters to us, and we will say, spam or not spam.
- Async models
We want to make an asynchronous prediction. The complexity of our models is growing, and we consider everything slower than 50 ms to be very slow . Imagine a model that makes predictions solely on the basis of the history of visited pages on our site. Then we can run these predictions at the time of rendering the page, and take them and use them when we need to.
Start small
The most important thing that I learned while working on the introduction of models in production on Booking.com, and that I want you to remember, take it home and use it - start small!
We achieved our first machine learning successes, it is ridiculous to say, exploding the predictions in MySQL. Perhaps you also have the first steps that you can take now. You do not need any sophisticated tools for this. B I have the same advice to deytasayentists. If you do not work with video, with voice and with an image, if your task is somehow related to transactional data - do not take too complex models right away.
Why do you need a neural network before you try logistic regression?
Monitor
Monitor everything - you monitor your software, web servers, hardware. The model is the same software . The only difference is the software that was not written by you. He was written by another program, which, in turn, was written by a deithasayentist. Otherwise, everything is the same: input arguments, return values. Know what is happening in reality, how well the model copes with its work, whether everything goes in a regular way - monitor!
Organization footprint
Think about how your organization works. Virtually any of your steps in this direction will change the way people work around you. Think about how they can be helped to solve their problems and how you can make great strides together.
(Don't) Follow our steps
I shared some successes, failures, problems that we faced. I hope this will help someone to get around the shoals we were sitting on. Do as we do, but do not repeat our mistakes. Or repeat - who in the end said that your situation is exactly the same as ours? Who said that what did not work for us will not work for you?
Try, make mistakes, share your mistakes!
At HighLoad ++ 2018, which will take place on November 8 and 9 at SKOLKOVO, there will be 135 speakers ready to share the results of their experiments. Additionally, the schedule contains 9 tracks of master classes and mitaps . There are topics for everyone, and tickets can still be booked.