5 data visualization experiments
- Tutorial
This spring, we experimented in the laboratory with a variety of data: characteristics of tanks in the World of Tanks game, statistics of correct and incorrect answers on the SDA simulator, temperature records in Russian cities, violations in the operation of minibuses in Nizhny Novgorod, and the history of changes in airfare prices. The experiment resulted in 5 visual interactive visualizations:
I’ll tell you how we create visualizations and which principles we adhere to: in general and by the example of each visualization. All examples include links to interactive prototypes, where you can independently "feel" the data and draw your own conclusions.
We begin work on visualization by highlighting the “brick” , the minimum indivisible unit of information, then we build a visual macro picture from the bricks and enhance the result with interactivity.
A brick is an atom of data, in order to isolate it, it is necessary to study the data under a microscope. A trivial example of a brick is the thousand dead in an impressive visualization of the losses of the Second World War (author: Neil Halloran). After selecting a brick, we choose a visual way to visualize its properties so that the bricks differ from each other (comparability) and visually “stack” with each other (additivity). In the aforementioned visualization, a brick is indicated by a man with or without a gun; nationality is color coded. A German soldier can be easily distinguished from a Soviet civilian:

And adding up the figures, we get the total losses - in a particular battle, or in a certain country, or all countries during the war:

High-quality visualization reflects the data structure. We group, sort and stack the bricks taking into account the peculiarities of the data, highlight important measurements. Due to the comparability and additivity of the bricks, the regularities and anomalies inherent in the data as a whole are manifested at the macro level.
The secret to powerful visualization is interactivity. Hover tips and pop-up blocks enrich the visualization with additional information. Filters, sliders, drop-down lists control the selection and allow you to compare different slices. Slices are built from the original bricks and have the same reliability and completeness as the macro picture as a whole.
Let us turn to our experiments.
Objective: compare the characteristics of tanks in the game World of Tanks. Data source: tanks-vs.com
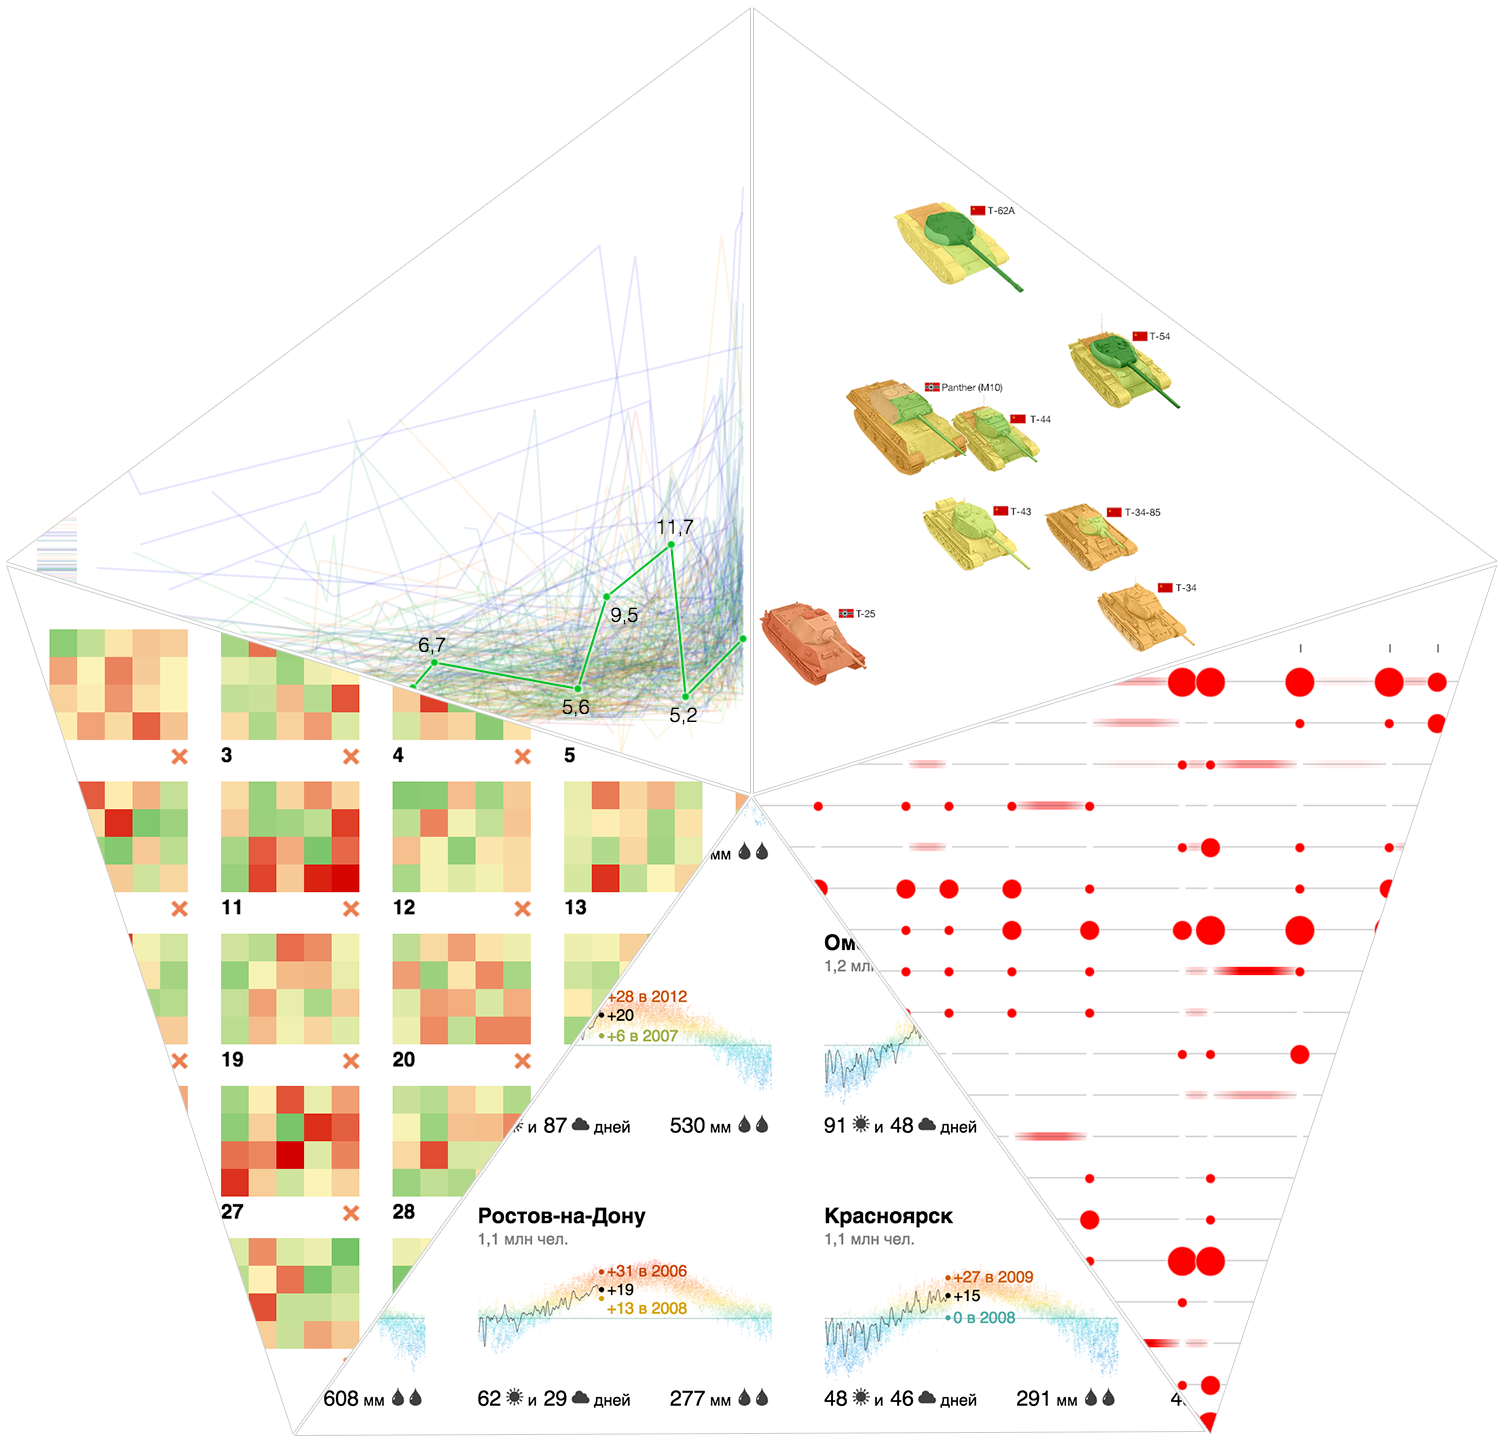
We chose a tank as a brick, the most visual and natural way of visualization is the image of a tank (see the example with cars ). The main characteristics of tanks are mobility, “attack” and “defense”. We show the fortress of different sections of the armor in color, so the level of protection of the tank as a whole, and weaknesses are immediately visible. We will show speed and attack on a two-dimensional graph:
The speed is delayed horizontally, and the maximum damage for 10 seconds, which was chosen as the attack parameter, is vertical. The points on the graph are tanks on the battlefield, you can compare their appearance, size and key characteristics. Another direct analogy: the farther from the coordinate origin the tank is located horizontally, the faster it will go (further away) in life. Countries, types and levels of tanks are configured in the filters above the graph, on the axes you can select any other parameters. When hovering over the tanks, all the characteristics are shown in a list.
Compare, for example, the heavy tanks of the USSR and Germany above level 5. The fastest tanks IS-7, IS-8 (USSR) and VK 36.01 (Germany), the latter loses a lot in maximum damage. The E 100, although slow, is a champion in damage and durability. On the graph of strength and basic damage there is an almost linear relationship between the parameters. Only the German Tiger I (more durable than impact) and the Soviet KV (more impact than durable) differ in the ratio of these parameters from the rest of the tanks in the sample.
For the strength of the armor, we used a "traffic light" gradient: strong and reliable - green, weak and dangerous - red. For some readers, this choice of colors caused a dissonance: for them, green means easily penetrated armor, and red means complex. This question does not seem fundamental to me and can be solved in any way if there is an unambiguous legend.
Objective: to benefit from traffic simulator statistics on traffic rules. Data provided by Atrena simulator: pdd.atrena.org
The data contains an answer to the question of how much you need to train to successfully pass the exam. This is their main interest and benefit. The brick in this case is an attempt, an answer by a specific user to a specific question for the Nth time, and a result (“correctly” or “error”). To assess the complexity of a particular question, we calculate the percentage of errors depending on the number of attempts.
The results will be encoded with a “traffic light” gradient and shown on the grid of questions grouped by tickets. When hovering over a question, we show the content and answer options, highlighting the correct. We calculate the average number of errors per person on the ticket and add the progress indicator: two or less errors - the exam passed, more than two - not passed.
We see that it’s almost impossible to pass the exam without preparation; on average, from 3 to 5 errors are made in each ticket. But after the first training round, the situation improves significantly: 23 tickets out of 40 were handed over on the second attempt. From the third attempt, only the most difficult ones did not succumb: the 11th, 27th and 38th tickets, and it is clear which questions cause the greatest difficulties. On the 11th and 27th tickets, there are several questions that make mistakes. And in the 38th, the 13th question causes problems for a third of students, because of which the average number of errors per person remains above two. Starting from the fourth attempt, all tickets were handed out on average , but the 13th question of the 38th ticket causes difficulties for a third of students up to the fifteenth attempt!
“Double checkmark” marks tickets, the average number of errors in which falls below unity, that is, which are handed over with a high probability. By the fifteenth attempt, such 11 out of 40. In general, the picture between the fifth and fifteenth attempt changes slightly. The most noticeable effect is from the first training circle, and passing tickets more than 5 times is almost pointless.
We also added a grouping by topic. It can be seen that complex and simple questions are distributed more or less evenly on topics.
Objective: to show daily temperature records, so that it would be interesting to study them. Data source: rp5.ru
We showed an annual temperature graph with a dot graph with a “thermal” gradient, emphasized today's temperature and records, supplemented by a climatic summary (the number of sunny and cloudy days, annual rainfall) and the population of the city is our brick. The emphasis on today's temperature and records adds relevance: “Now in Moscow + 22 ° С, and in 2014 this day was + 10 ° С - wow!”.
From the bricks we collected a macro picture for the million-plus cities of Russia and added Sevastopol and Sochi for contrast:
It turns out that the temperature profile of Novosibirsk is not so different from Moscow. In winter, the temperature regularly rises above zero in Rostov, Volgograd and Voronezh, in Sevastopol the spread is from +20 to -20, and only Sochi does not drop below zero in principle. The champions on sunny days are Sevastopol, Sochi and, unexpectedly, Omsk, the anti-record holders are St. Petersburg, Moscow, Voronezh and Chelyabinsk. In Moscow, there is more rainfall than in St. Petersburg, in Omsk two times more than in Novosibirsk, in Voronezh three times more than in Volgograd.
For those who, like me, have a poor idea of the mutual arrangement of cities, we “fixed” a micro-map on the visualization, on which cities are highlighted when you hover over the corresponding brick.
Task: to visualize violations of fixed-route taxis (deviations from the schedule and speeding). Data provided by Baseride: baseride.com
How to visually show deviations and excesses of a minibus in one flight? Arrange the stops horizontally, while maintaining the proportionality of the distances between them. Deviations from the schedule when visiting a particular stop will be shown in a circle whose area is proportional to the delay / lead in minutes. We will paint over speeding areas in red: the greater the excess, the redder the area. Flights without violations or with minor violations look neutral, the more violations, the redder the flight. To make the picture more visible, we revive it with a temporary slider:

Specific latenesses and excesses can be shown when you hover:

Such flights are easy to compare. For example, you can look at all morning flights with one glance, placing them under each other (on the left is the start time). The same picture of the day can be minimized in line with the total delays in stops and the total (translucent) disturbances in the areas:
We see that the last four stops are most affected by schedule violations, and they exceed the speed most often at the beginning and on a long stretch at the end of the route. Thanks to interactivity, one can see how minibuses starting at different times of the day are distributed along the route: who lags behind where and where, and vice versa, ahead of the total mass.
The advantage of this approach is that you can visually show any cut for flights: for a specific date or time of day, for a particular driver, for certain violations - and also compare these slices with each other. So you can show all city routes with statistics for any time period on one screen. In this case, the overall picture and each specific flight will be visible in a form convenient for further research.
Objective: to show changes in airfare prices depending on the departure date and date of purchase. Tutu.ru data: tutu.ru
The ticket price chart for a specific departure date depending on the date of purchase is our brick in this case. It is such a trend that is interesting to study and compare for different dates and seasons of departure, carriers, directions. To distinguish between the graphs, we use a color gradient for different departure dates. The vertical risk axis shows the distribution of prices.
When hovering over the time slider and the chart, we highlight the trend with a specific departure date. The slider controls the selection: you can see summer, autumn, New Year, spring trends, May holidays, etc.

In general, the hypothesis is confirmed that the closer the departure, the more expensive the tickets: on the right side of the schedule there are more expensive purchases, the network is denser. But there are quite a few exceptions to this rule - downward charts with up-front expensive purchases.
We carefully examine the most detailed and uniform data on the flight Moscow → Simferopol (only Aeroflot):

Tickets in the last summer season were bought both in advance and on the eve of departure, for an average of 5 thousand rubles with random deviations of up to 7-10 thousand. In the fall, the density of the “tail” on the left decreased, purchases were made closer to the departure date, with the average price being early slightly less late. In winter, no one bought tickets earlier than a month and a half before departure, but purchase prices in recent days have jumped noticeably - up to 10-15 thousand. In spring, pronounced steps (fixed tariffs) are visible: blue March steps to reduce prices as instructed by the president, green April - after.
Qualitative visualization shows patterns and anomalies in the data, allows you to see them with the naked eye. This is a tool for studying data without cumbersome software and complex mathematics. We are sure that visualization is useful in a variety of tasks, and our experiments confirm this. To participate in the experiment, send interesting data to data@datalaboratory.ru marked in the Question and Answer section .
I’ll tell you how we create visualizations and which principles we adhere to: in general and by the example of each visualization. All examples include links to interactive prototypes, where you can independently "feel" the data and draw your own conclusions.
General principles
We begin work on visualization by highlighting the “brick” , the minimum indivisible unit of information, then we build a visual macro picture from the bricks and enhance the result with interactivity.
A brick is an atom of data, in order to isolate it, it is necessary to study the data under a microscope. A trivial example of a brick is the thousand dead in an impressive visualization of the losses of the Second World War (author: Neil Halloran). After selecting a brick, we choose a visual way to visualize its properties so that the bricks differ from each other (comparability) and visually “stack” with each other (additivity). In the aforementioned visualization, a brick is indicated by a man with or without a gun; nationality is color coded. A German soldier can be easily distinguished from a Soviet civilian:
And adding up the figures, we get the total losses - in a particular battle, or in a certain country, or all countries during the war:
High-quality visualization reflects the data structure. We group, sort and stack the bricks taking into account the peculiarities of the data, highlight important measurements. Due to the comparability and additivity of the bricks, the regularities and anomalies inherent in the data as a whole are manifested at the macro level.
The secret to powerful visualization is interactivity. Hover tips and pop-up blocks enrich the visualization with additional information. Filters, sliders, drop-down lists control the selection and allow you to compare different slices. Slices are built from the original bricks and have the same reliability and completeness as the macro picture as a whole.
Let us turn to our experiments.
Tanks
Objective: compare the characteristics of tanks in the game World of Tanks. Data source: tanks-vs.com
We chose a tank as a brick, the most visual and natural way of visualization is the image of a tank (see the example with cars ). The main characteristics of tanks are mobility, “attack” and “defense”. We show the fortress of different sections of the armor in color, so the level of protection of the tank as a whole, and weaknesses are immediately visible. We will show speed and attack on a two-dimensional graph:
Live prototype: http://tanks.datalaboratory.ru/
The speed is delayed horizontally, and the maximum damage for 10 seconds, which was chosen as the attack parameter, is vertical. The points on the graph are tanks on the battlefield, you can compare their appearance, size and key characteristics. Another direct analogy: the farther from the coordinate origin the tank is located horizontally, the faster it will go (further away) in life. Countries, types and levels of tanks are configured in the filters above the graph, on the axes you can select any other parameters. When hovering over the tanks, all the characteristics are shown in a list.
Compare, for example, the heavy tanks of the USSR and Germany above level 5. The fastest tanks IS-7, IS-8 (USSR) and VK 36.01 (Germany), the latter loses a lot in maximum damage. The E 100, although slow, is a champion in damage and durability. On the graph of strength and basic damage there is an almost linear relationship between the parameters. Only the German Tiger I (more durable than impact) and the Soviet KV (more impact than durable) differ in the ratio of these parameters from the rest of the tanks in the sample.
For the strength of the armor, we used a "traffic light" gradient: strong and reliable - green, weak and dangerous - red. For some readers, this choice of colors caused a dissonance: for them, green means easily penetrated armor, and red means complex. This question does not seem fundamental to me and can be solved in any way if there is an unambiguous legend.
Traffic rules
Objective: to benefit from traffic simulator statistics on traffic rules. Data provided by Atrena simulator: pdd.atrena.org
The data contains an answer to the question of how much you need to train to successfully pass the exam. This is their main interest and benefit. The brick in this case is an attempt, an answer by a specific user to a specific question for the Nth time, and a result (“correctly” or “error”). To assess the complexity of a particular question, we calculate the percentage of errors depending on the number of attempts.
The results will be encoded with a “traffic light” gradient and shown on the grid of questions grouped by tickets. When hovering over a question, we show the content and answer options, highlighting the correct. We calculate the average number of errors per person on the ticket and add the progress indicator: two or less errors - the exam passed, more than two - not passed.
Live prototype: pdd.datalaboratory.ru
We see that it’s almost impossible to pass the exam without preparation; on average, from 3 to 5 errors are made in each ticket. But after the first training round, the situation improves significantly: 23 tickets out of 40 were handed over on the second attempt. From the third attempt, only the most difficult ones did not succumb: the 11th, 27th and 38th tickets, and it is clear which questions cause the greatest difficulties. On the 11th and 27th tickets, there are several questions that make mistakes. And in the 38th, the 13th question causes problems for a third of students, because of which the average number of errors per person remains above two. Starting from the fourth attempt, all tickets were handed out on average , but the 13th question of the 38th ticket causes difficulties for a third of students up to the fifteenth attempt!
“Double checkmark” marks tickets, the average number of errors in which falls below unity, that is, which are handed over with a high probability. By the fifteenth attempt, such 11 out of 40. In general, the picture between the fifth and fifteenth attempt changes slightly. The most noticeable effect is from the first training circle, and passing tickets more than 5 times is almost pointless.
We also added a grouping by topic. It can be seen that complex and simple questions are distributed more or less evenly on topics.
Weather
Objective: to show daily temperature records, so that it would be interesting to study them. Data source: rp5.ru
We showed an annual temperature graph with a dot graph with a “thermal” gradient, emphasized today's temperature and records, supplemented by a climatic summary (the number of sunny and cloudy days, annual rainfall) and the population of the city is our brick. The emphasis on today's temperature and records adds relevance: “Now in Moscow + 22 ° С, and in 2014 this day was + 10 ° С - wow!”.
From the bricks we collected a macro picture for the million-plus cities of Russia and added Sevastopol and Sochi for contrast:
Live prototype: weather-records.datalaboratory.ru
It turns out that the temperature profile of Novosibirsk is not so different from Moscow. In winter, the temperature regularly rises above zero in Rostov, Volgograd and Voronezh, in Sevastopol the spread is from +20 to -20, and only Sochi does not drop below zero in principle. The champions on sunny days are Sevastopol, Sochi and, unexpectedly, Omsk, the anti-record holders are St. Petersburg, Moscow, Voronezh and Chelyabinsk. In Moscow, there is more rainfall than in St. Petersburg, in Omsk two times more than in Novosibirsk, in Voronezh three times more than in Volgograd.
For those who, like me, have a poor idea of the mutual arrangement of cities, we “fixed” a micro-map on the visualization, on which cities are highlighted when you hover over the corresponding brick.
Minibuses
Task: to visualize violations of fixed-route taxis (deviations from the schedule and speeding). Data provided by Baseride: baseride.com
How to visually show deviations and excesses of a minibus in one flight? Arrange the stops horizontally, while maintaining the proportionality of the distances between them. Deviations from the schedule when visiting a particular stop will be shown in a circle whose area is proportional to the delay / lead in minutes. We will paint over speeding areas in red: the greater the excess, the redder the area. Flights without violations or with minor violations look neutral, the more violations, the redder the flight. To make the picture more visible, we revive it with a temporary slider:
Specific latenesses and excesses can be shown when you hover:
Such flights are easy to compare. For example, you can look at all morning flights with one glance, placing them under each other (on the left is the start time). The same picture of the day can be minimized in line with the total delays in stops and the total (translucent) disturbances in the areas:
Live prototype: minibus.datalaboratory.ru
We see that the last four stops are most affected by schedule violations, and they exceed the speed most often at the beginning and on a long stretch at the end of the route. Thanks to interactivity, one can see how minibuses starting at different times of the day are distributed along the route: who lags behind where and where, and vice versa, ahead of the total mass.
The advantage of this approach is that you can visually show any cut for flights: for a specific date or time of day, for a particular driver, for certain violations - and also compare these slices with each other. So you can show all city routes with statistics for any time period on one screen. In this case, the overall picture and each specific flight will be visible in a form convenient for further research.
Airfare prices
Objective: to show changes in airfare prices depending on the departure date and date of purchase. Tutu.ru data: tutu.ru
The ticket price chart for a specific departure date depending on the date of purchase is our brick in this case. It is such a trend that is interesting to study and compare for different dates and seasons of departure, carriers, directions. To distinguish between the graphs, we use a color gradient for different departure dates. The vertical risk axis shows the distribution of prices.
When hovering over the time slider and the chart, we highlight the trend with a specific departure date. The slider controls the selection: you can see summer, autumn, New Year, spring trends, May holidays, etc.
Live prototype: ticket-prices.datalaboratory.ru
In general, the hypothesis is confirmed that the closer the departure, the more expensive the tickets: on the right side of the schedule there are more expensive purchases, the network is denser. But there are quite a few exceptions to this rule - downward charts with up-front expensive purchases.
We carefully examine the most detailed and uniform data on the flight Moscow → Simferopol (only Aeroflot):
Tickets in the last summer season were bought both in advance and on the eve of departure, for an average of 5 thousand rubles with random deviations of up to 7-10 thousand. In the fall, the density of the “tail” on the left decreased, purchases were made closer to the departure date, with the average price being early slightly less late. In winter, no one bought tickets earlier than a month and a half before departure, but purchase prices in recent days have jumped noticeably - up to 10-15 thousand. In spring, pronounced steps (fixed tariffs) are visible: blue March steps to reduce prices as instructed by the president, green April - after.
Qualitative visualization shows patterns and anomalies in the data, allows you to see them with the naked eye. This is a tool for studying data without cumbersome software and complex mathematics. We are sure that visualization is useful in a variety of tasks, and our experiments confirm this. To participate in the experiment, send interesting data to data@datalaboratory.ru marked in the Question and Answer section .