GridFS vs SQL Server vs Local
For the meticulous
Recently, there has often been a debate among server application developers about how to better manage files and which technology provides faster read / write files. Articles and articles about the comparative performance of the local file system and GridFS began to appear on the network. Or about storing files in a relational database as a BLOB versus storing on a hard disk in a file system. So I decided to get involved in this confrontation. Today we will compare the performance and overhead of MongoDB 2.6.7 x64 GridFS versus MS SQL Server Express 2012 v11.0.5058.0 x64 versus NTFS. For the experiment, we used the Windows 7 x64 SP1 platform on AMD Athlon (tm) II X2 250 Processor 3.00 GHz with 4GB of RAM 1033 MHz and 600 GB HDD SATA 6Gb / s Western Digital VelociRaptor 10000rpm 32Mb. After each test, the computer restarts, and the bases were reset to zero. We will consider performance on the example of a file server in C # under .NET 4.5, whose codeattached to the article.
Get to the point
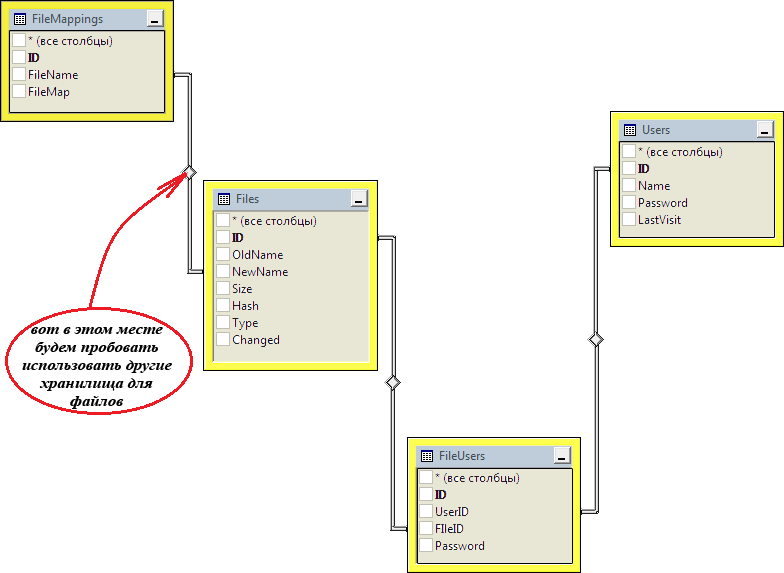
During the test, we try to save 1000 files of 10,000,000 bytes. Each downloaded file will be registered in the “Files” table: “Hash” is used to check whether such a file has already been downloaded, “NewName” associates file information with its bitmap on the server in the “FileMapping” table. File server database schema:
Along with this, we will try to store files in GridFS using the official MongoDB driver and simply on the hard disk using the FileInfo class from the .NET class library. To obtain the possibility of conveniently constructing “human-readable” queries to SQL Server using LINQ technology and lambda expressions, we will use Entity Framework 6.0:

Single threaded recording
To begin with, we test saving just to disk by loading files in single-threaded mode. According to the results of five launches, operations were required: 164751, 165095, 164611, 165937 and 166296 milliseconds. The maximum difference between the results was about 1%. So, on average, the process worked 165338 milliseconds of which 52966 - time to register a file, 12685 - time to write a file:

Running a program with measuring the runtime of its parts and without measuring did not lead to different results. Running the program with the thread browser showed that the maximum occupied RAM size was 59796 KB. Total disk space: approximately 9.3 GB. For simplicity, I will immediately give the average result of the execution time of operations in seconds.
Now, test writing files to the SQL Server database. The size of the resulting database on the disk was approximately 9.8 GB. At the peak, the program occupied 233432 KB, and the DBMS - 1627048 KB. The program worked on average 998 seconds. Of these, 34 seconds to register a file and 823 seconds to record:

Next came the GridFS lineup. Disk space used is approximately 12 GB. I used up MongoDB all the RAM that I got to. At the same time, the memory consumption of SQL Server and our server remained within the usual values, which can be neglected in this situation. Everything completed in about 921 seconds. For registration - 60 seconds, for recording - 766 seconds:

Multithreaded recording
Here we encountered the first difficulties: when several threads get out to establish a connection with the DBMS at the same time, errors occur. And if working with MongoDB goes “without confirmation” - the driver does not give an error and continues to work and everything runs smoothly, then EF while calling “CreateIfNotExists” shows a bunch of debugging information, gives an error that is not caught using try-catch and ends the process with a mistake. In this case, the error does not appear if you compile and run along with the debugger from the development environment. The problem was solved by synchronizing the flows and establishing connections with the DBMS in turn.
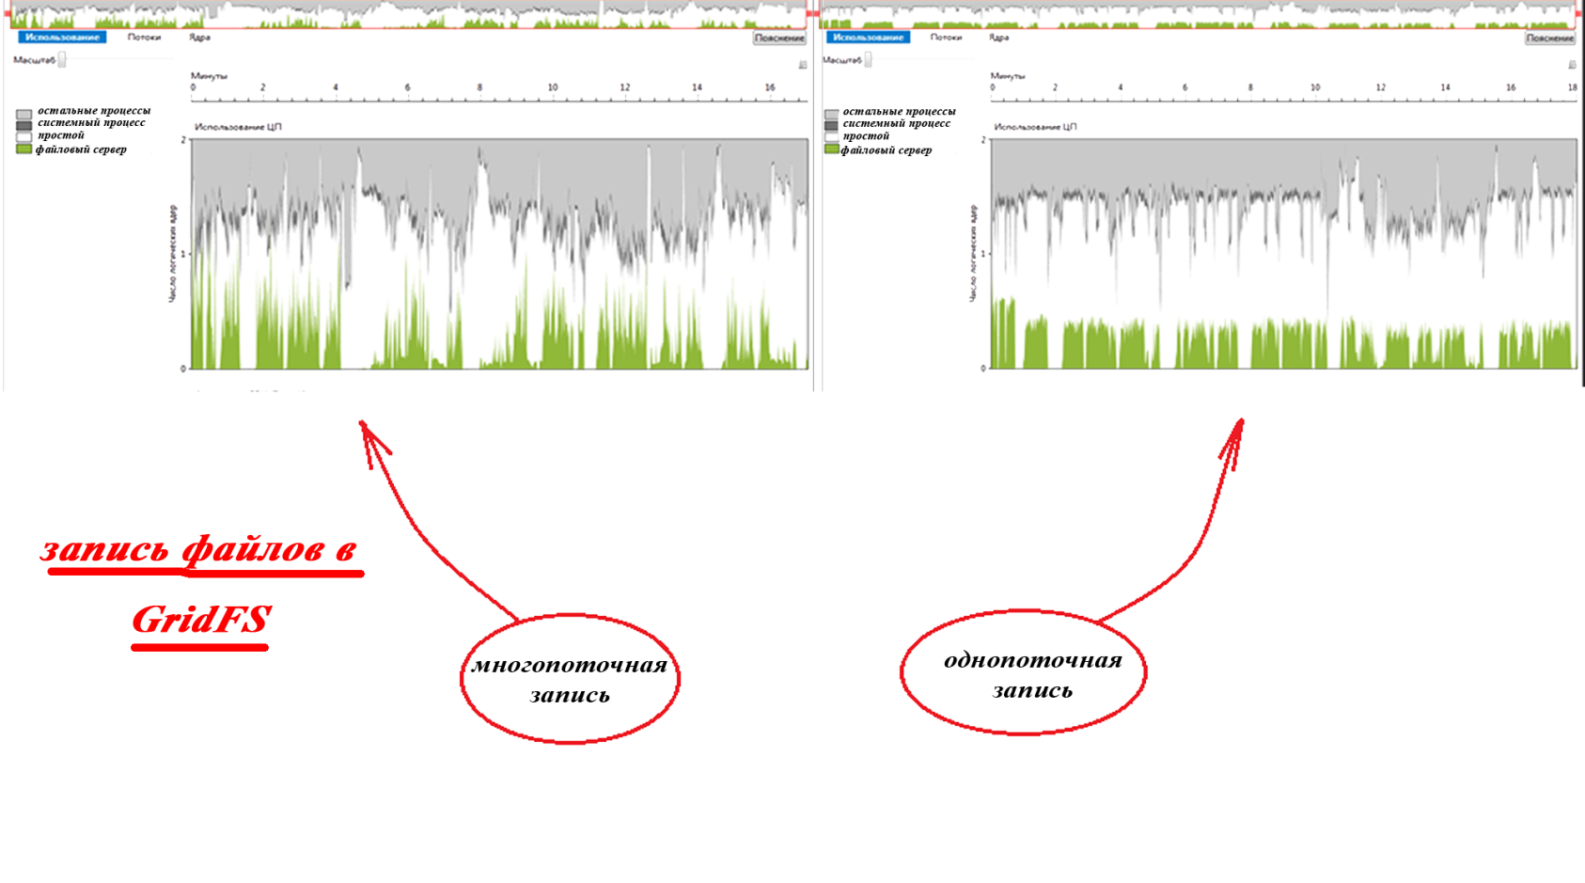
We perform write operations using 20 streams of 50 files each for recording. Testing GridFS showed a strong scatter: 716259, 623205, 675829, 583331 and 739815 milliseconds, which averaged 668 seconds. As you can see, with the same overhead costs, it took less time to complete. This is explained by shorter downtime, which is shown by the parallelism visualizer on the graphs of the use of CPU cores (parallelism visualization using the visualizer took much longer):
When writing files directly to the file system, the spread of the received test values was not large and the average value was 170 seconds. As you can see, the difference between single-threaded and multi-threaded recording to disk was less than 3%. Therefore, I consider it appropriate to omit the CPU utilization schedules for this case.
Multithreaded file writing The SQL Server database led to additional problems: During loading, an error occurred in some threads due to the timeout output. As a result, the connection was interrupted, the process terminated with an error, and the database was brought to an inconsistent state. For a thousand requests, the first attempt failed in about 40 cases. Of these, about two ended in failure in the second attempt. The problem was solved by increasing the timeout to 30 seconds and retrying the connection in case of failure.
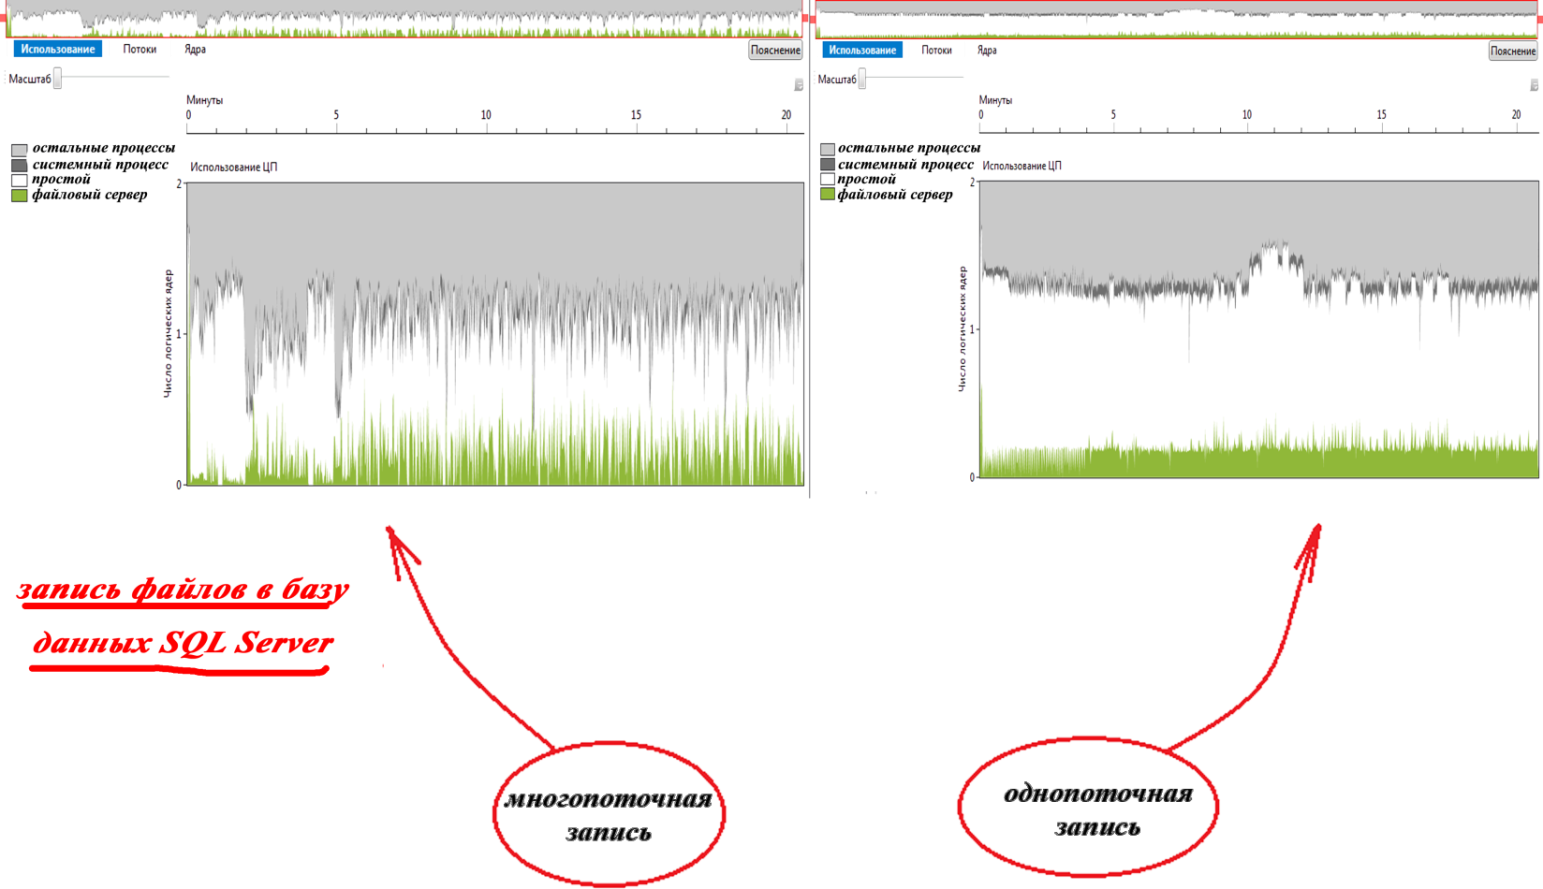
When saving 1000 files using multithreaded SQL Server, the time spread was less than 5%, and the result averaged 840 seconds. This is almost 16% faster than in single-threaded mode:
Reading files
Now we test reading files from different repositories. In single-threaded mode, we count all files in a row, and in multi-threaded mode - in 20 streams of 50 random files each. Traditionally, 5 attempts of each type:

Reading files from the SQL Server database did not go smoothly the first time. Entity Framework caches the result on the client application side at each query to the database for data sampling. And, although the CLR means automatic “garbage collection”, memory is quickly consumed, which leads to an “OutOfMemory” error and the process terminates abnormally. This is due to the fact that EF does not handle this type of exceptions on its own and does not delete data from the cache even when all memory is used up. And by querying tables that store files, this becomes critical. The problem was resolved by disabling caching in the “FileMapping” entity collections using the “AsNoTracking” installation.
Total
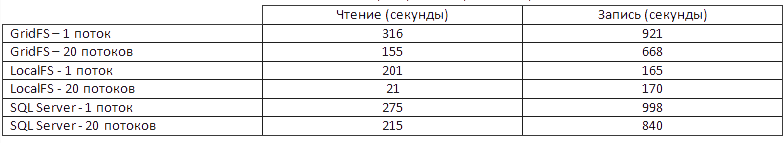
We have a raped hard drive and the following pivot table:
Bonus
Trying to anticipate possible criticism and answer in advance answers to questions that have not yet been asked, a little later, I supplement the article with some interesting (I hope) and maybe useful comments. First: if you do not reset the database before each new test, then the performance will not change significantly. At least, neither in the second, nor in the third, nor in repeated repeated (in reasonable aisles) runs, differences in the results could not be obtained. Therefore, we omit the detailed description of this part of the work, as the most boring.
Second: many will probably say that when working with a DBMS through sockets, the data to be transmitted will have to go through the entire protocol stack back and forth. Therefore, we will consider another option. In fact, the same option with the FileInfo class, only we will now access it using .NET Remouting, if you understand what I mean:
