Unusual Playboy models, or about detecting outliers in data using Scikit-learn
Motivated article user BubaVV about the prediction weight Playboy model on its shape and growth, the author decided to go deeper if you know what I mean in the Spine-Chilling research topic and the same data found emissions, ie especially sisyastaya model superimposed over the other with their forms height or weight. Against the background of this warm-up, feelings of humor at the same time tell a little bit to novice researchers about outlier detection and anomaly detection data in an implementation of the One-class Support Vector Machine in the Scikit-learn library written in Python.
So, honestly referring to the source of the data and the person who worked on them, open the CSV file with the girls.csv data and see what is there. We see the parameters of 604 Playboy girls from December 1953 to January 2009: chest circumference (Bust, in cm), waist circumference (Waist, in cm), hip circumference (Hips, in cm), and height (Height, in cm .) and weight (Weight, in kg).
Let's open our favorite Python programming environment (in my case Eclipse + PyDev) and load the data using the Pandas library. This article assumes that the Pandas, NumPy, SciPy, sklearn, and matplotlib libraries are installed. If not, Windows users can rejoice and simply install precompiled libraries from here .
Well, users of nyx and poppies (as well as the author) will have to suffer a little, but the article is not about that.
First we import the modules that we need. We will talk about their role as they become available.
Create a girls instance of the Pandas DataFrame data structure by reading the data from the girls.csv file (it lies next to this py-file, otherwise you must specify the full path). The header parameter says that the names of the attributes are in the first line (i.e., in the zero, if you count as programmers).
By the way, Pandas is a great option for those who are used to python, but still love the speed of parsing data in R. The main thing that Pandas inherited from R is just the convenient DataFrame data structure.
The author met Pandas on the Kaggle tutorial in the trial competition Titanic: Machine Learning from Disaster. For those new to Kaggle, this is a great excuse to finally do this.
Let's see the general statistics of our girls:
We will be informed that there are 604 girls at our disposal, each with 7 signs - Month (type object), Year (type int64) and 5 more signs of type int64, which we already called.
Then we learn more about girls:
Oh, if everything in life were so simple!
The interpreter will list us the main statistical characteristics of the signs of girls - the average, minimum and maximum values. Already not bad. From this we conclude that the average shape of the Playboy model is 89-60-88 (expected), average height - 168 cm, weight - 52 kg.
Here the growth then seems to be small. Apparently, this is due to the fact that historical data, from the middle of the 20th century, now the model’s standard seems to be 180 cm height.
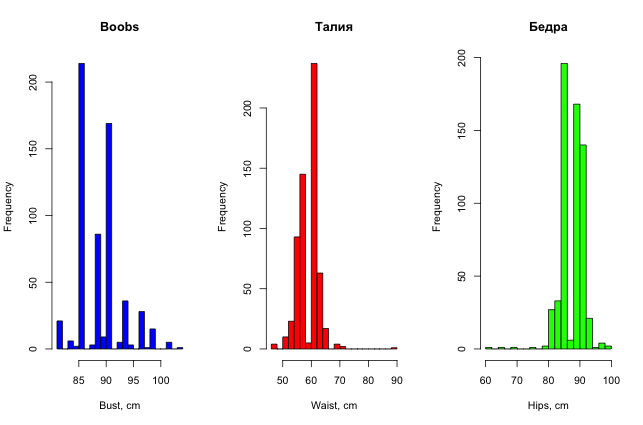
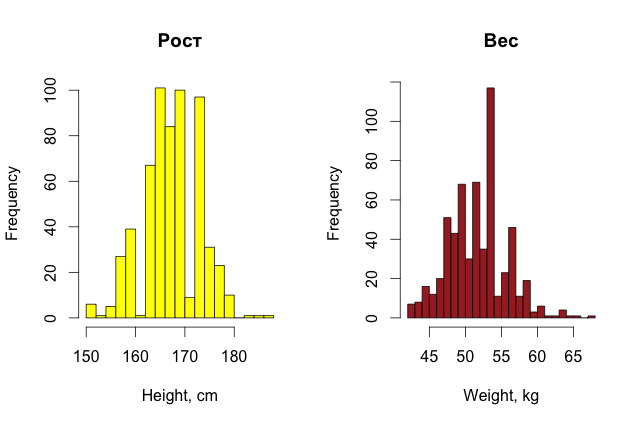
The coverage of girls’s breasts varies from 81 to 104 cm, waist - from 46 to 89, hips - from 61 to 99, height - from 150 cm to 188 cm, weight - from 42 kg to 68 kg.
Wow, you can already suspect that an error has crept into the data. Whatkind of beer barrel is the model with a waist of 89 cm? And how can the hips be 61 cm?
Let's see what these unique ones are:
These are the girls of the month Playboy in December 1998 and January 2005, respectively. It's easy to find them here . These are the triplets Nicole, Erica and Jacquelinewith the non-speaking surname Dam ( Dahm ) - all three “under one account” and Destiny Davis ( Destiny Davis ). It is easy to notice that the waist of the triplets is 25 inches (64 cm), not 89, and the hips of our Destini are 86 cm, and not 61 at all.
For beauty, you can also plot histograms of the distribution of girls' parameters (for variety they are made in R).
So, with a simple, unaided look at the data, one can already find some oddities in them, if, of course, there is not very much data, and the signs can somehow be interpreted in a way that is understandable to a person.
To train the model, we leave only numerical parameters, except for the year. We will write them into the NumPy girl_params array , simultaneously converting to type float64. We scale the data so that all the attributes lie in the range from -1 to 1. This is important for many key learning algorithms. Without going into details, by scaling we avoid the fact that a trait gains more weight just because it has a larger range of change. For example, if we consider the Euclidean distance between people by the signs “Age” and “Income”, then the contribution to the metric will be much higher only because it is measured, for example, in thousands, and age in tens.
Next, select 2 main components in the data so that they can be displayed. Here the Scikit-learn Principal Component Analysis ( PCA ) library came in handy . Also, it will not hurt us to keep the number of our girls. In addition, we will say that we are looking for 1% of the emissions in the data, that is, we will limit ourselves to 6-7 “strange” girls. (The variables in Python written in upper case symbolize constants and are usually written at the beginning of the file after connecting the modules).
To detect “outliers” in the data, we use a single-class model of the support vector machine. The theoretical work on this variation of SVM was begun by Alexei Yakovlevich Chervonenkis. According to Yandex, now the development of methods for solving this problem takes first place in the development of the theory of machine learning.
I will not tell here what SVM and kernels are, there is so much written about it, for example, on Habré (simpler) and on machinelearning.ru(more complicated). I only note that One-class SVM calls, as the name implies, to distinguish objects of the same class. Detecting data anomalies is just a modest application of this idea. Now, in the era of deep learning, using the algorithms of one-class classification, they are trying to teach the computer to “create a representation” of an object, as, for example, a child distinguishes a dog from all other objects.
But back to the Scikit implementation of One-class SVM, which is well documented on the Scikit-learn site.
We create an instance of the classifier with a Gaussian kernel and "feed" the data to it.
We create an array dist_to_border , which stores the distances from the objects of the training set X to the constructed dividing surface, and then, after we have chosen the threshold, we create an array of indicators (True or False) that the object is a representative of this class, and not an outlier. Moreover, the distance is positive if the object lies “inside” the area bounded by the constructed dividing surface (that is, it is a representative of the class), and negative otherwise. The threshold is determined statistically, such as the distance to the dividing surface, that OUTLIER_FRACTION (one in our case) has a higher percentage of the sample (i.e., in our case, threshold is a 1% percentile of the array of distances to the dividing surface).
Finally, we visualize what happened. At this point I will not stop, those who wish can deal with matplotlib themselves. This is the redesigned code from the Scikit-learn “Outlier detection with several methods” example .
We get the following picture:
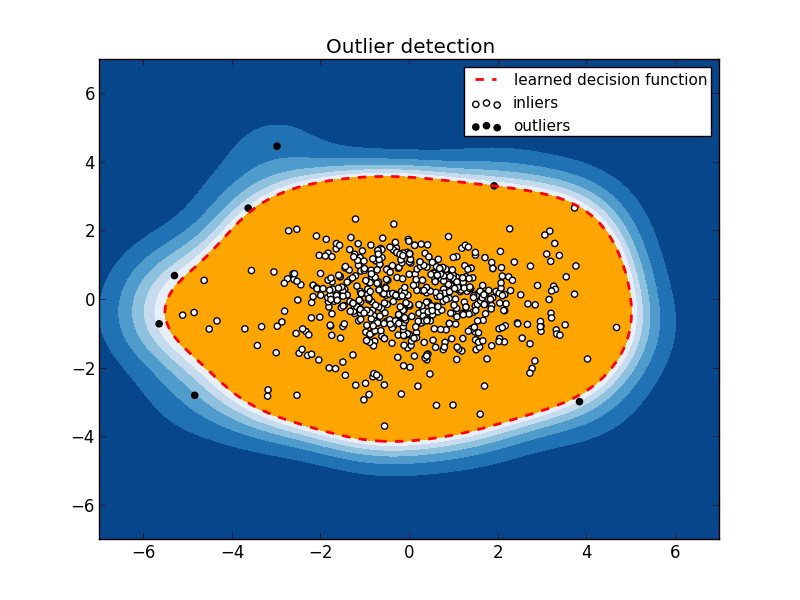
7 “emissions” are visible. To understand what kind of girls are hiding under this unpleasant "outburst", let's look at them in the source data.
And now the most entertaining part is the interpretation of the received emissions.
We notice that there are only 7 exhibits in our Kunstkamera (we set the threshold OUTLIER_FRACTION so successfully), so you can walk through each of them.
It is noteworthy that the lady with a hips of 61 cm, which we suspected was very different from other girls, was normal in the rest of the parameters, and SVM was not defined as an “outlier”.
In conclusion, I note the importance of primary data analysis, “just by the eyes” and, of course, note that the detection of anomalies in the data is also used in more serious tasks - in credit scoring to recognize unreliable customers, in security systems to detect potential bottlenecks, analysis of banking transactions to search for cybercriminals and more. An interested reader will also find many other algorithms for detecting anomalies and outliers in the data and their applications.
Download and initial data analysis
So, honestly referring to the source of the data and the person who worked on them, open the CSV file with the girls.csv data and see what is there. We see the parameters of 604 Playboy girls from December 1953 to January 2009: chest circumference (Bust, in cm), waist circumference (Waist, in cm), hip circumference (Hips, in cm), and height (Height, in cm .) and weight (Weight, in kg).
Let's open our favorite Python programming environment (in my case Eclipse + PyDev) and load the data using the Pandas library. This article assumes that the Pandas, NumPy, SciPy, sklearn, and matplotlib libraries are installed. If not, Windows users can rejoice and simply install precompiled libraries from here .
Well, users of nyx and poppies (as well as the author) will have to suffer a little, but the article is not about that.
First we import the modules that we need. We will talk about their role as they become available.
import pandas
import numpy as np
import matplotlib.pyplot as plt
import matplotlib.font_manager
from scipy import stats
from sklearn.preprocessing import scale
from sklearn import svm
from sklearn.decomposition import PCA
Create a girls instance of the Pandas DataFrame data structure by reading the data from the girls.csv file (it lies next to this py-file, otherwise you must specify the full path). The header parameter says that the names of the attributes are in the first line (i.e., in the zero, if you count as programmers).
girls = pandas.read_csv('girls.csv', header=0)
By the way, Pandas is a great option for those who are used to python, but still love the speed of parsing data in R. The main thing that Pandas inherited from R is just the convenient DataFrame data structure.
The author met Pandas on the Kaggle tutorial in the trial competition Titanic: Machine Learning from Disaster. For those new to Kaggle, this is a great excuse to finally do this.
Let's see the general statistics of our girls:
print girls.info()
We will be informed that there are 604 girls at our disposal, each with 7 signs - Month (type object), Year (type int64) and 5 more signs of type int64, which we already called.
Then we learn more about girls:
print girls.describe()
Oh, if everything in life were so simple!
The interpreter will list us the main statistical characteristics of the signs of girls - the average, minimum and maximum values. Already not bad. From this we conclude that the average shape of the Playboy model is 89-60-88 (expected), average height - 168 cm, weight - 52 kg.
Here the growth then seems to be small. Apparently, this is due to the fact that historical data, from the middle of the 20th century, now the model’s standard seems to be 180 cm height.
The coverage of girls’s breasts varies from 81 to 104 cm, waist - from 46 to 89, hips - from 61 to 99, height - from 150 cm to 188 cm, weight - from 42 kg to 68 kg.
Wow, you can already suspect that an error has crept into the data. What
Let's see what these unique ones are:
print girls[['Month','Year']][girls['Waist'] == 89]
These are the girls of the month Playboy in December 1998 and January 2005, respectively. It's easy to find them here . These are the triplets Nicole, Erica and Jacqueline
For beauty, you can also plot histograms of the distribution of girls' parameters (for variety they are made in R).
So, with a simple, unaided look at the data, one can already find some oddities in them, if, of course, there is not very much data, and the signs can somehow be interpreted in a way that is understandable to a person.
Data preprocessing
To train the model, we leave only numerical parameters, except for the year. We will write them into the NumPy girl_params array , simultaneously converting to type float64. We scale the data so that all the attributes lie in the range from -1 to 1. This is important for many key learning algorithms. Without going into details, by scaling we avoid the fact that a trait gains more weight just because it has a larger range of change. For example, if we consider the Euclidean distance between people by the signs “Age” and “Income”, then the contribution to the metric will be much higher only because it is measured, for example, in thousands, and age in tens.
girl_params = np.array(girls.values[:,2:], dtype="float64")
girl_params = scale(girl_params)
Next, select 2 main components in the data so that they can be displayed. Here the Scikit-learn Principal Component Analysis ( PCA ) library came in handy . Also, it will not hurt us to keep the number of our girls. In addition, we will say that we are looking for 1% of the emissions in the data, that is, we will limit ourselves to 6-7 “strange” girls. (The variables in Python written in upper case symbolize constants and are usually written at the beginning of the file after connecting the modules).
X = PCA(n_components=2).fit_transform(girl_params)
girls_num = X.shape[0]
OUTLIER_FRACTION = 0.01
Model training
To detect “outliers” in the data, we use a single-class model of the support vector machine. The theoretical work on this variation of SVM was begun by Alexei Yakovlevich Chervonenkis. According to Yandex, now the development of methods for solving this problem takes first place in the development of the theory of machine learning.
I will not tell here what SVM and kernels are, there is so much written about it, for example, on Habré (simpler) and on machinelearning.ru(more complicated). I only note that One-class SVM calls, as the name implies, to distinguish objects of the same class. Detecting data anomalies is just a modest application of this idea. Now, in the era of deep learning, using the algorithms of one-class classification, they are trying to teach the computer to “create a representation” of an object, as, for example, a child distinguishes a dog from all other objects.
But back to the Scikit implementation of One-class SVM, which is well documented on the Scikit-learn site.
We create an instance of the classifier with a Gaussian kernel and "feed" the data to it.
clf = svm.OneClassSVM(kernel="rbf")
clf.fit(X)
Emission search
We create an array dist_to_border , which stores the distances from the objects of the training set X to the constructed dividing surface, and then, after we have chosen the threshold, we create an array of indicators (True or False) that the object is a representative of this class, and not an outlier. Moreover, the distance is positive if the object lies “inside” the area bounded by the constructed dividing surface (that is, it is a representative of the class), and negative otherwise. The threshold is determined statistically, such as the distance to the dividing surface, that OUTLIER_FRACTION (one in our case) has a higher percentage of the sample (i.e., in our case, threshold is a 1% percentile of the array of distances to the dividing surface).
dist_to_border = clf.decision_function(X).ravel()
threshold = stats.scoreatpercentile(dist_to_border,
            100 * OUTLIER_FRACTION)
is_inlier = dist_to_border > threshold
Display and interpretation of results
Finally, we visualize what happened. At this point I will not stop, those who wish can deal with matplotlib themselves. This is the redesigned code from the Scikit-learn “Outlier detection with several methods” example .
xx, yy = np.meshgrid(np.linspace(-7, 7, 500), np.linspace(-7, 7, 500))
n_inliers = int((1. - OUTLIER_FRACTION) * girls_num)
n_outliers = int(OUTLIER_FRACTION * girls_num)
Z = clf.decision_function(np.c_[xx.ravel(), yy.ravel()])
Z = Z.reshape(xx.shape)
plt.title("Outlier detection")
plt.contourf(xx, yy, Z, levels=np.linspace(Z.min(), threshold, 7),
                         cmap=plt.cm.Blues_r)
a = plt.contour(xx, yy, Z, levels=[threshold],
                            linewidths=2, colors='red')
plt.contourf(xx, yy, Z, levels=[threshold, Z.max()],
                         colors='orange')
b = plt.scatter(X[is_inlier == 0, 0], X[is_inlier == 0, 1], c='white')
c = plt.scatter(X[is_inlier == 1, 0], X[is_inlier == 1, 1], c='black')
plt.axis('tight')
plt.legend([a.collections[0], b, c],
           ['learned decision function', 'outliers', 'inliers'],
           prop=matplotlib.font_manager.FontProperties(size=11))
plt.xlim((-7, 7))
plt.ylim((-7, 7))
plt.show()
We get the following picture:
7 “emissions” are visible. To understand what kind of girls are hiding under this unpleasant "outburst", let's look at them in the source data.
print girls[is_inlier == 0]
         Month  Year  Bust  Waist  Hips  Height  Weight
54   September  1962    91     46    86     152      45
67     October  1963    94     66    94     183      68
79     October  1964   104     64    97     168      66
173  September  1972    98     64    99     185      64
483   December  1998    86     89    86     173      52
507   December  2000    86     66    91     188      61
535      April  2003    86     61    69     173      54
And now the most entertaining part is the interpretation of the received emissions.
We notice that there are only 7 exhibits in our Kunstkamera (we set the threshold OUTLIER_FRACTION so successfully), so you can walk through each of them.
- Mickey Winters . September, 1962. 91-46-86, height 152, weight 45.

Waist 46 is, of course, cool! How are they doing with this breast 91? - Christine Williams . October, 1963. 94-66-94, height 183, weight 68.

Not a small girl for those years. This is not Mickey Winters. - Rosemary Hillcrest . October, 1964. 104-64-97, height 168, weight 66.

Wow, wow, palehce!An impressive lady. - Susan Miller . September, 1972. 98-64-99, height 185, weight 64.
- Cutie triplets Dam . 86-89 (real 64) -86, height 173, weight 52.

An example of an error in the data. It is not very clear how they measured everything for three. - Cara Michelle . December, 2000. 86-66-91, height 188, weight 61.

Height 188 - higher than the author of this article. Explicit "outlier" for such "historical" data. - Carmella de Cesare . April 2003. 86-61-69, height 173, weight 54.

Perhaps because of the hips.
It is noteworthy that the lady with a hips of 61 cm, which we suspected was very different from other girls, was normal in the rest of the parameters, and SVM was not defined as an “outlier”.
Conclusion
In conclusion, I note the importance of primary data analysis, “just by the eyes” and, of course, note that the detection of anomalies in the data is also used in more serious tasks - in credit scoring to recognize unreliable customers, in security systems to detect potential bottlenecks, analysis of banking transactions to search for cybercriminals and more. An interested reader will also find many other algorithms for detecting anomalies and outliers in the data and their applications.