Application Insights - collect telemetry of Windows Phone and Windows applications

I am pleased to inform you that Application Insights now supports the collection of telemetry of Windows and Windows Phone applications. Now you can get information about how users interact with your application, as well as diagnose problems that occur during the application. All received data is visualized on the Azure Preview portal.
When you add Application Insights to your project, information about your application (users, sessions, page views, problems) starts to be collected automatically. In addition, there is an API that allows you to send events, metrics, and exceptions. Let's see what features Application Insights provides .
Add Application Insights to Your Project
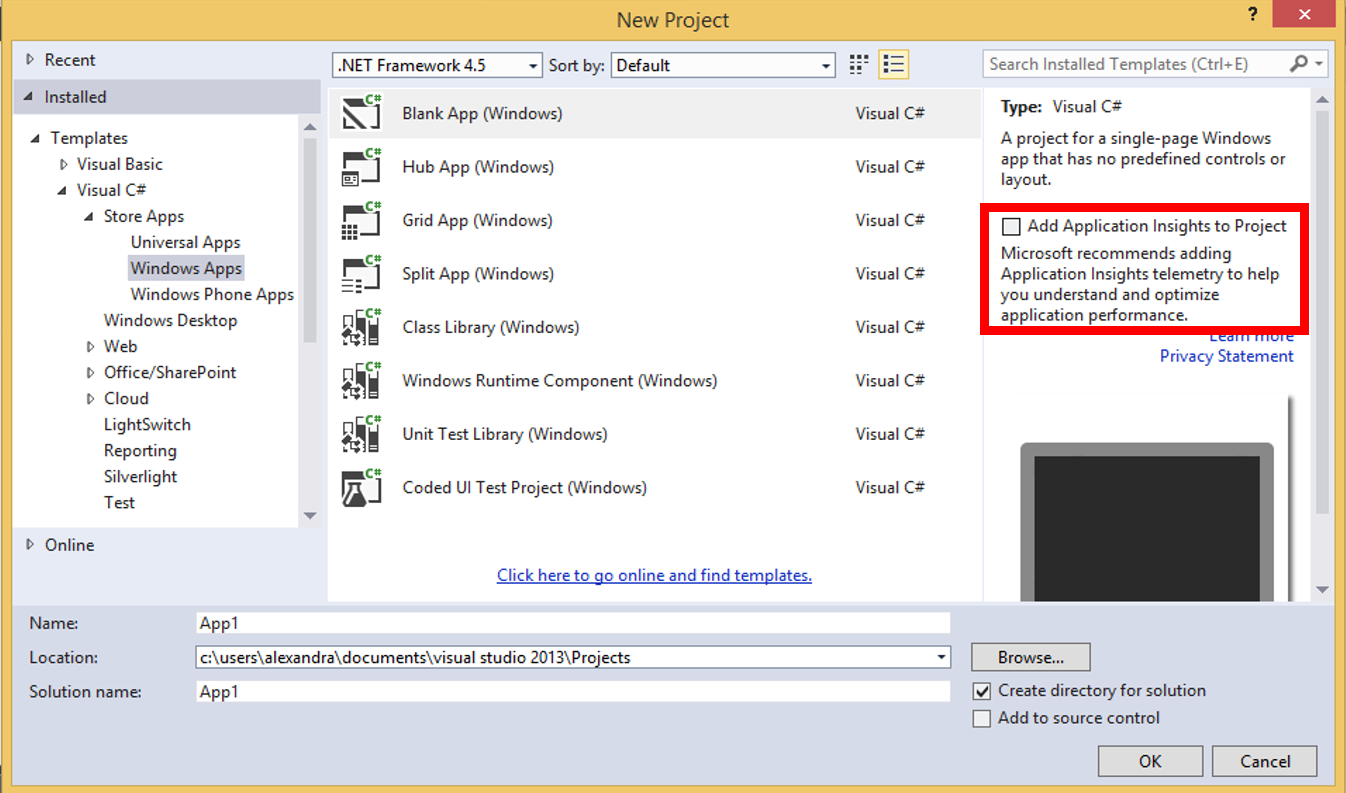
If you have not created a project yet, in the New Project window , select Windows or Windows Phone Apps from the list, in the right part of the window check the box next to Add Application Insights to Project .
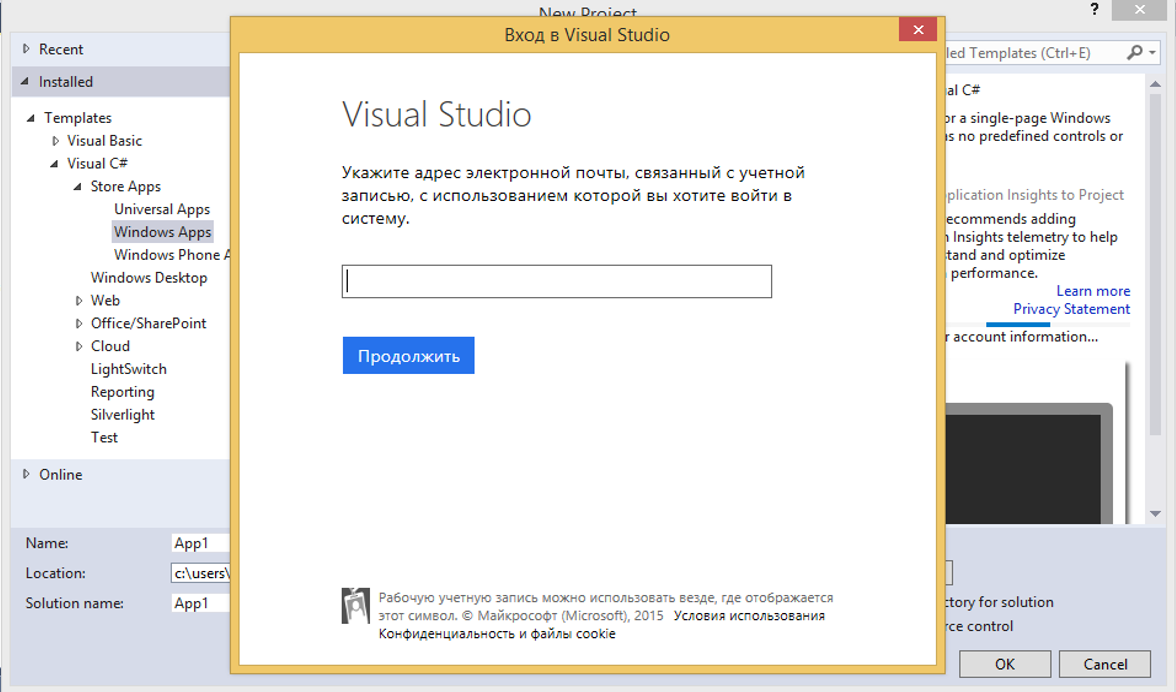
A window will open in which you will need to enter your account information with an Azure subscription. If you do not have an Azure subscription, you can activate the free (trial) or Pay As You Go (paid) version of the subscription.
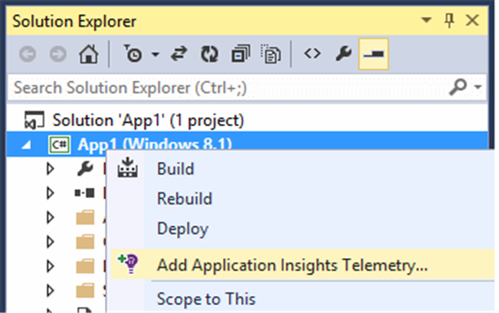
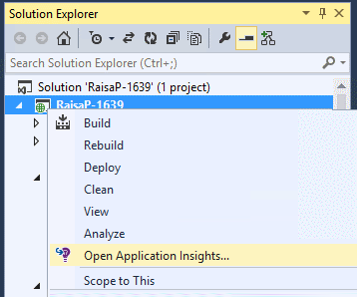
If you already had a project created earlier by Windows or Windows Phone, then open it in Visual Studio 2013 (at least Update 3). Select Add Application Insights telemetry .
If you have not logged in to your account before, do it now.
Launch the application
Press F5 to launch the application on the emulator or on the device. Application Insights will automatically collect information about sessions, users, page views, and application errors.
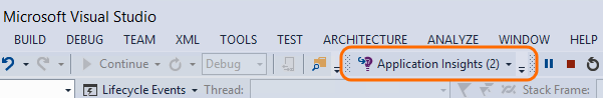
You will see a notification in Visual Studio that will notify you that the data has been successfully collected and sent.
In debug mode, telemetry will be sent immediately after it is formed. In release mode, telemetry is stored on the device and sent only when the application resumes.
View Collected Data
Open Application Insights in your application:
First you will see only one or two points. For example:
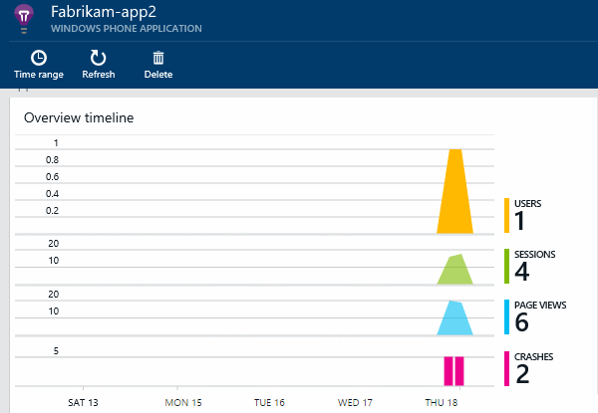
Click Refresh if you want to see more information.
You can click on any chart to view detailed information.
Information tracking
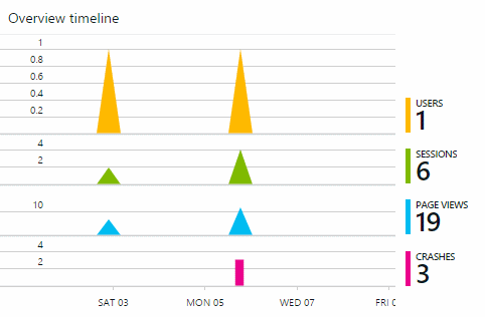
On the Overview timeline page , click on the Users and Sessions charts to see the analytics.
Note:
- Users are tracked anonymously, so the same user logging in from different devices will be counted twice.
- A session is counted when the application is paused, and random exits from the application are not counted.
Segmentation
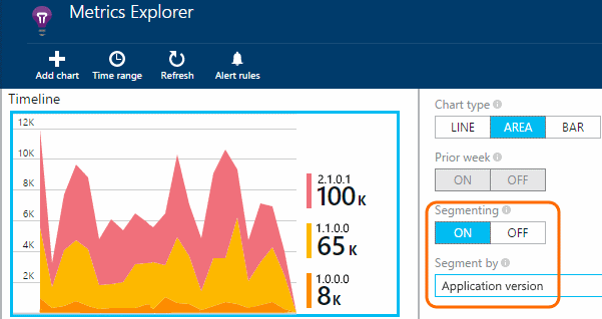
You can watch information based on various criteria. For example, to see how many users are using a particular version of an application, open the Users diagram and select segmentation by application version (Application Version):
Browse Pages
In order to see which pages of your application are visited by users, add the following code to your application:
var telemetry = new TelemetryClient();
telemetry.TrackPageView("GameReviewPage");
The results will be available in the Page Views section .
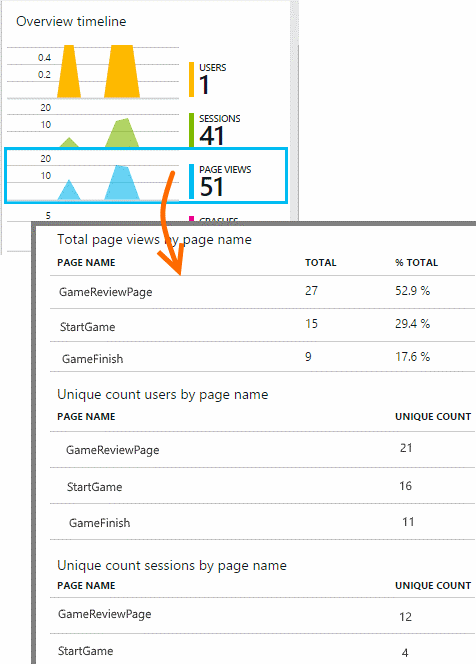
Thus, you can view information about any page.
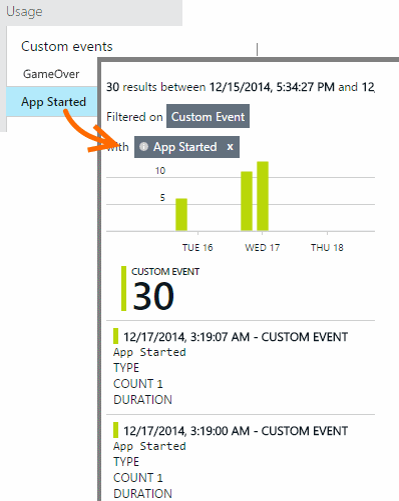
Custom Events
You can track user behavior in various situations, for example, at the end of the game. Add the following code:
telemetry.TrackEvent("GameOver");
The data appears in the Custom Events grid . You can view general information about events or click on a specific event to view a detailed description.
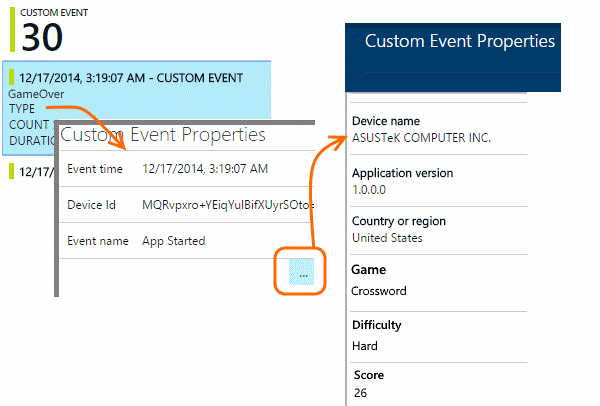
You can also add string and numeric properties for each event.
// Определение различных свойств:
var properties = new Dictionary
   {{"Game", currentGame.Name}, {"Difficulty", currentGame.Difficulty}};
var measurements = new Dictionary
   {{"Score", currentGame.Score}, {"Opponents", currentGame.OpponentCount}};
// Отправка события:
telemetry.TrackEvent("GameOver", properties, measurements);
Click on any event to see its detailed description.
You can find more information about custom events here .
Detecting and diagnosing program crashes
Setting a crash notification in a program
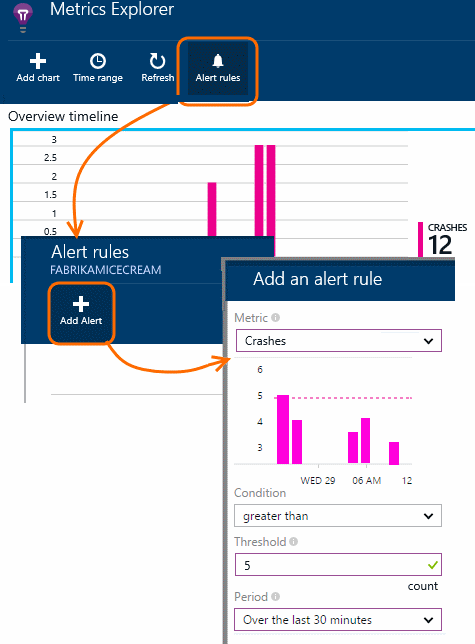
Fault diagnosis
In order to find out how often your program crashes or compare the stability of one version compared to another, click on the Crashes icon and sort by application version ( Application Version ):

In order to find out about exceptions that cause crashes , open Diagnostic Search .
Please note that you can choose which data will be displayed.
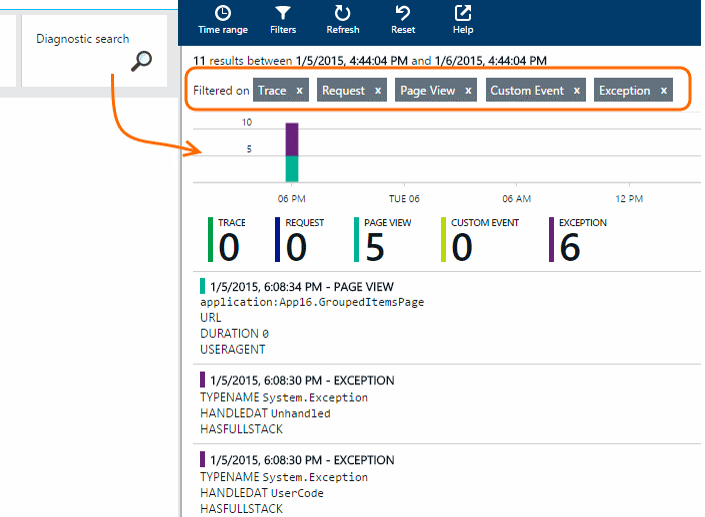
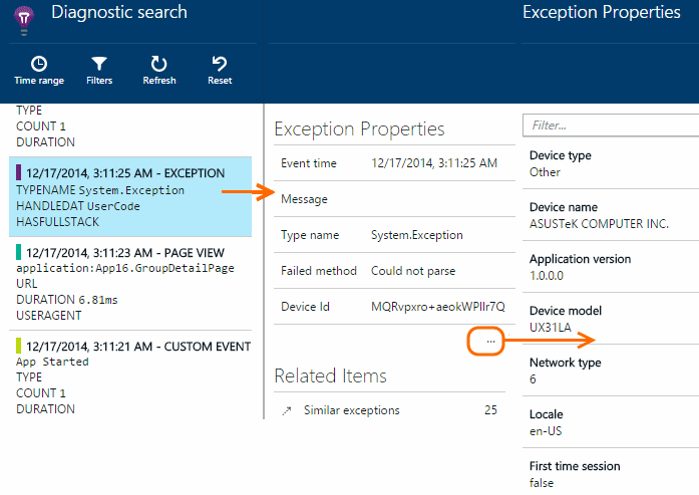
In order to see detailed information about the exception, click on it.
View Telemetry on the Application Insights Portal
You can watch telemetry not only directly in Visual Studio, but also on the Azure portal. Go to Browse -> Application Insights and select the application you created.
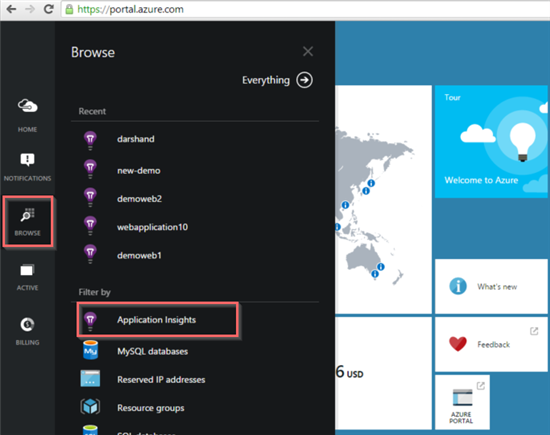
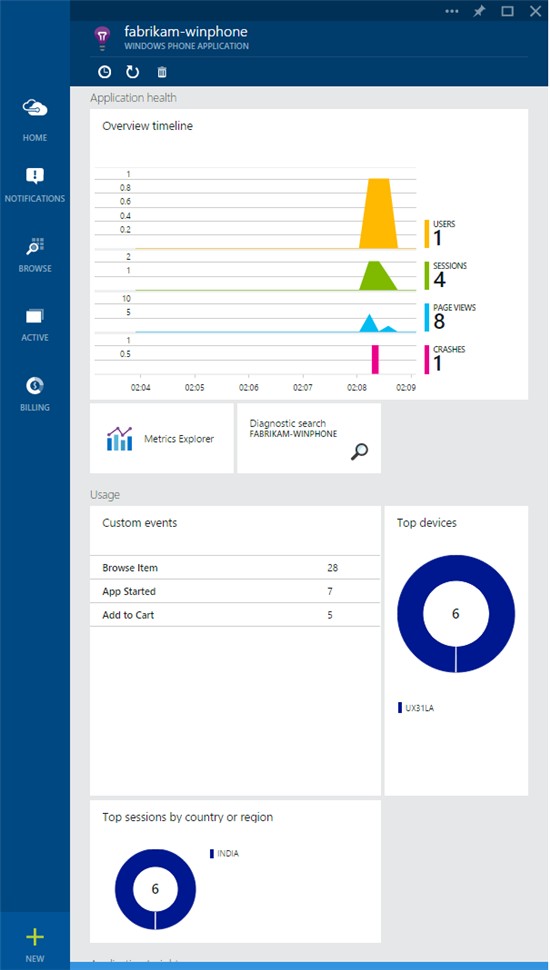
You will immediately see the telemetry collected by your application.
So, we examined only the main possibilities of using telemetry Application Insights in Windows and Windows Phone applications. If you want to know more about some of the features of Application Insights, you can click on one of the links listed below.
useful links
- Try Azure for 30 days for free!
- Learn Microsoft Cloud and Other Virtual Academy courses
- Business and the cloud: best practices solutions
- Windows 8.1 Update for large organizations. Beginning of work
- Microsoft Hybrid Cloud: Sample Guide
- Toolkit for Preparing Users for Windows 8.1
- Introduction to the Win2D Graphics Library
- Download Free or Trial Visual Studio
- Become a Universal Windows Developer