How to make data speak
As soon as Google Analytics or Yandex.Metrica publish news about a new report, metric or interface update and the whole community rejoices, I feel lightheaded. But not from joy. For me, this is a signal that in the near future, instead of working on product quality, we will begin to study analytics systems. The pursuit of data has supplanted the desire for quality analysis at the back of the need. Accuracy has become more important than the trend, and sites now have 3-5 counters from different analytics systems.

There is not much data? As it happens. Remember the data paradox that Avinash Koshik perfectly formulated . Lack of data does not allow decisions, but abundance does not give an idea of what is happening.
So is it time to start looking for answers? I will talk about a universal method that helps me draw conclusions, and also brings great pleasure in working with information. So that users who are far from Internet marketing and web analytics do not get bored, as an example, I took a topic from our everyday reality.
Working with data consists of several stages, but there is no need to follow a strict sequence: you have to return to the previous stages and run ahead.
1. Preparation
- Formulation of questions.
- Source selection.
- Data collection.
- The study.
- Cleansing data and making assumptions.
2. Analysis
- Search for answers to the questions posed.
- Search for patterns.
- Search for dependencies.
3. Demonstration of the result
- Data visualization.
- Demonstration of solutions, answers.
Go!
Data is a trap for the mind. They lure numbers into the forest and can easily lead astray. In order not to deviate from the goal, ask the question you want to get an answer to. Formulate it in free form and write it on paper. Let it be a simple question, “Is my site selling good or bad?” or "Where did the buyers disappear from the site?" Then break the general question into sub-questions and add them to the list. For example, the question of sales on the site will be relevant to the sub-question: which products sell well, which ones are bad. Do not forget to leave empty space on the sheet of paper, it is quite possible that in the subsequent steps you will want to add to the list.
My questions:
What is the foreign policy of Russia in recent years?
(I warned that I would take data from real life).
Sub questions:
I am interested in foreign policy processes after the Munich Conference from February 2007 to September 2014. I have formulated the questions, now we are going to search for the source.
A key requirement for the source: its constituent data must be relevant and homogeneous.
Relevant means that they contain the necessary and sufficient minimum information to answer the questions posed, and are also close to the original source.
In historical science there is a whole industry called source study. She is engaged in the classification and analysis of sources and operates with the concepts of primary and secondary sources. To obtain the most reliable results, it is important to use the primary sources - first-hand messages that have not been processed by someone from outside. For example, data from Wikipedia about events in foreign policy are not the primary source. The primary source may be minutes of meetings of top officials with dates of meetings and a list of participants.
The second data requirement is uniformity. The presence of common properties, the nature of which is unchanged for the whole set of objects, is a prerequisite. In other words, the data should be qualitatively uniform in composition. It is not correct to compare and add metrics from Yandex.Metrica and Google Analytics, since the methods for processing them can be different. Although I quite often observe the opposite picture.
Let's get back to foreign policy. For the data source, I took official reports on significant foreign policy events with the participation of Russia from the site kremlin.ru. Despite the fact that official press releases are not the primary sources, we can use them in our work. They are as close to the source as possible. Publications on the one hand reflect the quality of the work of the content manager and the PR service of the Kremlin, on the other hand, are directly related to the events.
1) Data from the archive in the Foreign Policy section
2) News on the tag “foreign policy” (from 08/05/2008 to 10/14/2014)
I’ll run ahead and say that I will have to abandon the use of the first source. Since September 2009, the archive has ceased to be replenished with news, in addition, in the first and second cases, different principles for describing news were used.
After we have decided on the source, we proceed to the most complex and important part of the work: data collection.
I asked the programmer to parse sections of the site into a CSV table so that later it was convenient to work with records in Excel. You are free to choose any data analysis tools that are convenient for you.
An important detail: you must use a relational data organization model.
Simply put, each new record should be located on a new line, attributes should be placed in columns and belong to one data type (date, text, number, etc.). We strive to create a uniform and high-quality database.
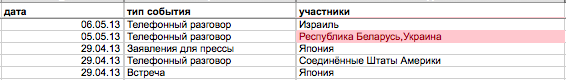
In my example, the entry in the line is a unique publication on the topic of foreign policy events. In Excel, it looks like an entry in a line with attributes: event date, event type, participant / participants of the event.
Parsing two sections was not easy for us: the site gave an error 402 Payment Required, 6 objects were lost somewhere, about 3,500 records were at our disposal. If a loss of 0.18% of the data can be tolerated, then the fact that there were two tables on hand from different sources and with different attributes could not be ignored. If they were combined, the principle of data uniformity would be violated, so I had to additionally compare intersecting periods from both sources, and in the end I decided to remove the first source. In the end, we received 3326 event records for the period from 05/08/2008 to 10/14/2014.
Now the received data needs to be studied. Excel has simple and convenient tools: groupings, filters, sortings, pivot tables, which are quite enough for most tasks. I looked through the contents of the cells with interest and drew attention to the repeating names of events in the headlines. Publications about meetings, telephone conversations, signing of documents, ceremonies were met with enviable constancy. A new attribute “event type” was requested for the records, I created another column and filled it with the corresponding values.
It is important to note that not all events were interpreted unambiguously. For example, I attributed the message about the beginning of the meeting and the message about the negotiations at the meeting to one type of “Meeting” event, which means that there could be several records about one event in our database. The assumptions made were recorded and applied to all data.
The study period from 05/08/2008 to 10/14/2014 captures the presidency of V.V. Putin and D.A. Medvedev. Let me remind you the dates:
V.V. Putin - 05/07/2000 - 05/07/2008
D.A. Medvedev - May 7, 2008 - May 7, 2012
V.V. Putin - 05/07/2012 - present
This stage of work was the longest and most responsible. I ran data through filters more than once, grouped records, checked the correctness of values, data types, and as a result I achieved the necessary uniformity and correctness.
Immediately after the preparation of the data, it is important to take a break and return to the beginning - to the questions that we have formulated. It often happens that at this point the thought goes far beyond the scope of the current study, so returning to the beginning becomes the best way to not miss the important.
Now we are close to drawing conclusions. At the analysis stage, it is important to avoid bias. It is possible to start research with the desire to prove a ready-made hypothesis, but do not forget about the possible existence of alternatives. Trying to prove that the bounce rate has increased due to poor traffic, we will never find a drop in site loading speed after a recent release.
Another caveat concerns finding dependencies and patterns. We really want to know how one value affects another, because in our everyday view, cause and effect go in pairs. But social phenomena, and user behavior on the site also applies to them, are characterized by a multiplicity of causes and effects. Even when we see two similarly shaped curves on the graph that reflect different signs of one phenomenon, there can be no relationship between them. Any conclusions about the presence of a correlation between the values are always probabilistic.
Now, let's get down to our answers to questions about foreign policy.
What is the activity of Russia in foreign policy over the past years.

In 2010, the maximum number of news on foreign policy issues was published.
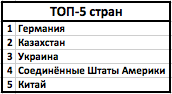
What is the list of countries with which Russia has interacted most often. I made a list of the top 5 countries about which the maximum number of messages for the study period has been accumulated. We will keep an eye on key participants in international relations. If someone suddenly disappears from the sample in the subsequent stages, this will serve as a signal to check the data again or ask a new question.
What are the most popular types of events mentioned in the news and are there any features or changes throughout the period.
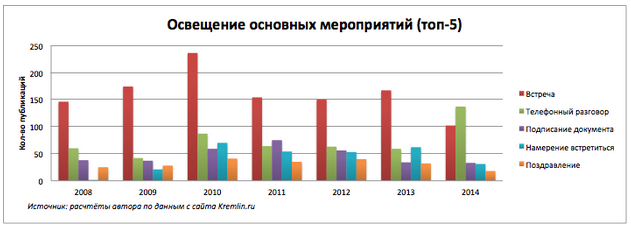
The number of press releases about meetings in 2010 is maximum. In 2014, a sharp increase in the number of messages about telephone conversations took place.
Russian politicians began to talk more and meet less. Operational and urgent tasks require fewer ceremonies.
I wonder what countries and organizations the number of telephone conversations in 2014 increased. I selected the participants with the maximum number of telephone conversations in 2014.
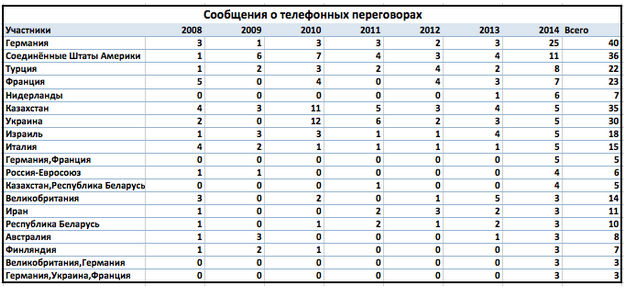
In 2014, we observe unique groups of participants in telephone conversations and an increase in direct contacts with a number of countries. Of the key participants in international relations, China is not listed, we will find out later what this may be connected with.
We plot the number of messages by country, taking into account multilateral telephone calls.
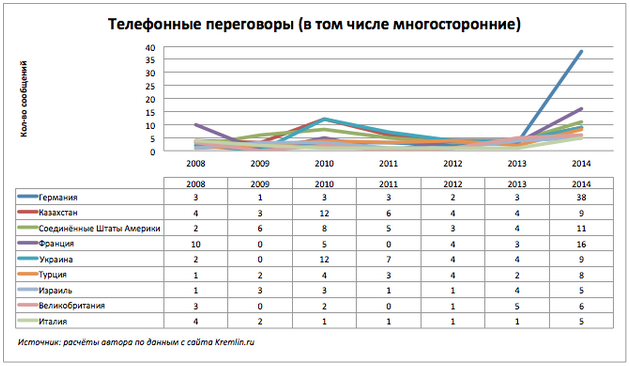
A noticeable increase in telephone conversations with Germany, France and the United States.
What about the meetings? Take the countries leading in the meetings and take a look at the big picture.
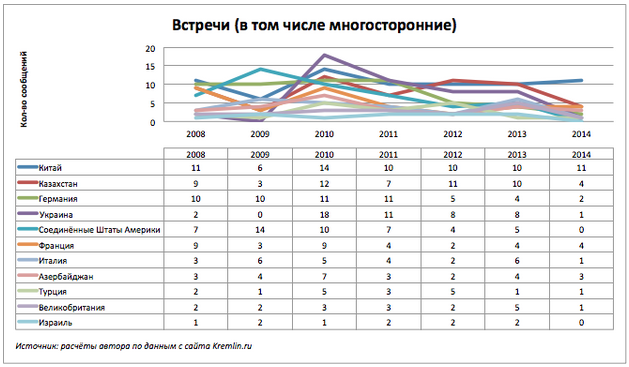
The graph is not the most indicative, but the data table shows that on 10/14/2014 there are no reports of Russian meetings with the United States and Israel.
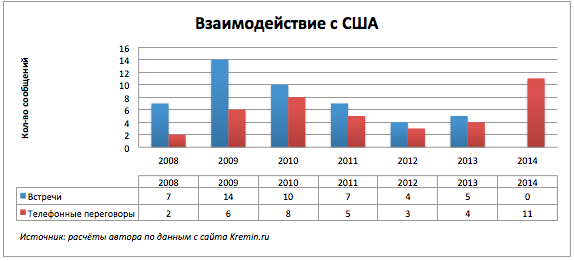
The nature of Russia's interactions with specific countries is interesting. We continue to consider two key events of the meeting and telephone calls by country.
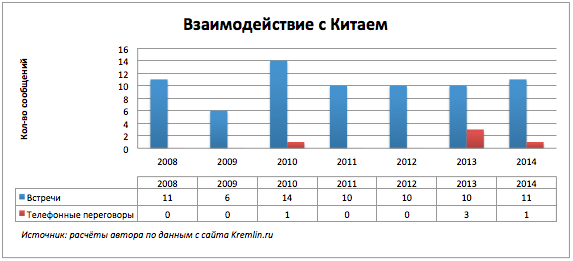
Our eastern neighbor does not like talking on the phone.

Telephone calls for the current year have broken all records.
Already the end of the year and no meetings.
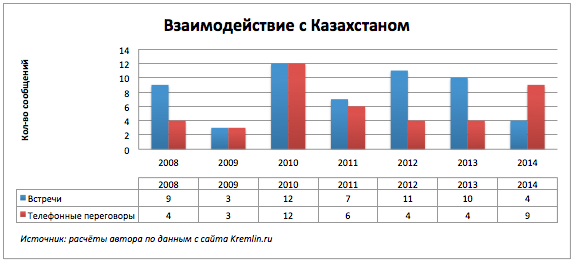
Hopping changes.
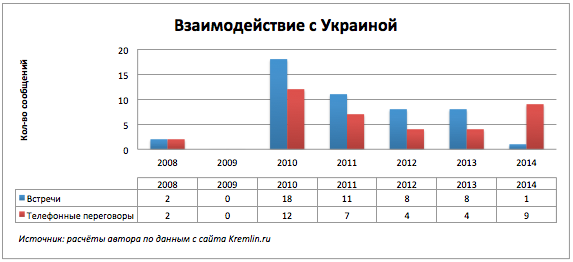
In 2009, the year is completely calm. The lack of communications is likely due to the gas conflict between Russia and Ukraine in 2008-2009.
You may have noticed that in the “participants” column we have several types of values: indicating one or several countries separated by commas or countries and organizations.
Meetings between politicians are bilateral and multilateral. It is interesting to look at which countries Russia meets more often in bilateral negotiations, with which in multilateral ones.
To do this, I supplemented the data with another attribute: a coefficient equal to the ratio of the total number of meetings to the number of bilateral. Those countries that are below average are mostly negotiating at bilateral meetings; those above average participate actively in multilateral.
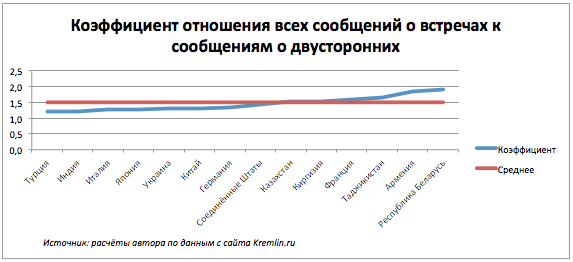
There is nothing surprising in the fact that the CIS countries were closer to the intersection point and above average - they take part in joint forums and summits. But what did France forget in their company? I made a summary table for all events involving France over the entire period, and it turned out that France was a third party in the negotiations to resolve the 2008 Georgian-South Ossetian conflict.
***
Of course, you can still get a lot of interesting things from this data, but I received answers to questions, which means that the goal has been achieved. Even more: now I always have information at hand for a deeper understanding of the current situation in foreign policy. As you can see, if you stop collecting numbers and start asking specific questions, the data answers in the language of useful and interesting conclusions.
In the end I will tell my favorite story about the first place of work of Avinash Koshik. The future world expert in the field of web analytics came to the company where 200 reports were configured. A month after his arrival Avinash Koshik disconnected them all. Two weeks passed, and no one noticed the loss.
upd. Promised files
1. Source
2. Processing
password for opening: habr2014
There is not much data? As it happens. Remember the data paradox that Avinash Koshik perfectly formulated . Lack of data does not allow decisions, but abundance does not give an idea of what is happening.
So is it time to start looking for answers? I will talk about a universal method that helps me draw conclusions, and also brings great pleasure in working with information. So that users who are far from Internet marketing and web analytics do not get bored, as an example, I took a topic from our everyday reality.
The main stages of working with data
Working with data consists of several stages, but there is no need to follow a strict sequence: you have to return to the previous stages and run ahead.
1. Preparation
- Formulation of questions.
- Source selection.
- Data collection.
- The study.
- Cleansing data and making assumptions.
2. Analysis
- Search for answers to the questions posed.
- Search for patterns.
- Search for dependencies.
3. Demonstration of the result
- Data visualization.
- Demonstration of solutions, answers.
Go!
Training
Wording of questions
Data is a trap for the mind. They lure numbers into the forest and can easily lead astray. In order not to deviate from the goal, ask the question you want to get an answer to. Formulate it in free form and write it on paper. Let it be a simple question, “Is my site selling good or bad?” or "Where did the buyers disappear from the site?" Then break the general question into sub-questions and add them to the list. For example, the question of sales on the site will be relevant to the sub-question: which products sell well, which ones are bad. Do not forget to leave empty space on the sheet of paper, it is quite possible that in the subsequent steps you will want to add to the list.
My questions:
What is the foreign policy of Russia in recent years?
(I warned that I would take data from real life).
Sub questions:
- What is the activity of Russia in foreign policy over recent years?
- Which countries does Russia most actively interact with?
- How did preferences in interactions with other countries change?
I am interested in foreign policy processes after the Munich Conference from February 2007 to September 2014. I have formulated the questions, now we are going to search for the source.
Data source selection
A key requirement for the source: its constituent data must be relevant and homogeneous.
Relevant means that they contain the necessary and sufficient minimum information to answer the questions posed, and are also close to the original source.
In historical science there is a whole industry called source study. She is engaged in the classification and analysis of sources and operates with the concepts of primary and secondary sources. To obtain the most reliable results, it is important to use the primary sources - first-hand messages that have not been processed by someone from outside. For example, data from Wikipedia about events in foreign policy are not the primary source. The primary source may be minutes of meetings of top officials with dates of meetings and a list of participants.
The second data requirement is uniformity. The presence of common properties, the nature of which is unchanged for the whole set of objects, is a prerequisite. In other words, the data should be qualitatively uniform in composition. It is not correct to compare and add metrics from Yandex.Metrica and Google Analytics, since the methods for processing them can be different. Although I quite often observe the opposite picture.
Let's get back to foreign policy. For the data source, I took official reports on significant foreign policy events with the participation of Russia from the site kremlin.ru. Despite the fact that official press releases are not the primary sources, we can use them in our work. They are as close to the source as possible. Publications on the one hand reflect the quality of the work of the content manager and the PR service of the Kremlin, on the other hand, are directly related to the events.
1) Data from the archive in the Foreign Policy section
2) News on the tag “foreign policy” (from 08/05/2008 to 10/14/2014)
I’ll run ahead and say that I will have to abandon the use of the first source. Since September 2009, the archive has ceased to be replenished with news, in addition, in the first and second cases, different principles for describing news were used.
After we have decided on the source, we proceed to the most complex and important part of the work: data collection.
Collection, study, cleaning, assumptions
I asked the programmer to parse sections of the site into a CSV table so that later it was convenient to work with records in Excel. You are free to choose any data analysis tools that are convenient for you.
An important detail: you must use a relational data organization model.
Simply put, each new record should be located on a new line, attributes should be placed in columns and belong to one data type (date, text, number, etc.). We strive to create a uniform and high-quality database.
In my example, the entry in the line is a unique publication on the topic of foreign policy events. In Excel, it looks like an entry in a line with attributes: event date, event type, participant / participants of the event.
Parsing two sections was not easy for us: the site gave an error 402 Payment Required, 6 objects were lost somewhere, about 3,500 records were at our disposal. If a loss of 0.18% of the data can be tolerated, then the fact that there were two tables on hand from different sources and with different attributes could not be ignored. If they were combined, the principle of data uniformity would be violated, so I had to additionally compare intersecting periods from both sources, and in the end I decided to remove the first source. In the end, we received 3326 event records for the period from 05/08/2008 to 10/14/2014.
Now the received data needs to be studied. Excel has simple and convenient tools: groupings, filters, sortings, pivot tables, which are quite enough for most tasks. I looked through the contents of the cells with interest and drew attention to the repeating names of events in the headlines. Publications about meetings, telephone conversations, signing of documents, ceremonies were met with enviable constancy. A new attribute “event type” was requested for the records, I created another column and filled it with the corresponding values.
It is important to note that not all events were interpreted unambiguously. For example, I attributed the message about the beginning of the meeting and the message about the negotiations at the meeting to one type of “Meeting” event, which means that there could be several records about one event in our database. The assumptions made were recorded and applied to all data.
The study period from 05/08/2008 to 10/14/2014 captures the presidency of V.V. Putin and D.A. Medvedev. Let me remind you the dates:
V.V. Putin - 05/07/2000 - 05/07/2008
D.A. Medvedev - May 7, 2008 - May 7, 2012
V.V. Putin - 05/07/2012 - present
This stage of work was the longest and most responsible. I ran data through filters more than once, grouped records, checked the correctness of values, data types, and as a result I achieved the necessary uniformity and correctness.
Data analysis
Immediately after the preparation of the data, it is important to take a break and return to the beginning - to the questions that we have formulated. It often happens that at this point the thought goes far beyond the scope of the current study, so returning to the beginning becomes the best way to not miss the important.
Now we are close to drawing conclusions. At the analysis stage, it is important to avoid bias. It is possible to start research with the desire to prove a ready-made hypothesis, but do not forget about the possible existence of alternatives. Trying to prove that the bounce rate has increased due to poor traffic, we will never find a drop in site loading speed after a recent release.
Another caveat concerns finding dependencies and patterns. We really want to know how one value affects another, because in our everyday view, cause and effect go in pairs. But social phenomena, and user behavior on the site also applies to them, are characterized by a multiplicity of causes and effects. Even when we see two similarly shaped curves on the graph that reflect different signs of one phenomenon, there can be no relationship between them. Any conclusions about the presence of a correlation between the values are always probabilistic.
Now, let's get down to our answers to questions about foreign policy.
Demonstration of the result
What is the activity of Russia in foreign policy over the past years.
In 2010, the maximum number of news on foreign policy issues was published.
What is the list of countries with which Russia has interacted most often. I made a list of the top 5 countries about which the maximum number of messages for the study period has been accumulated. We will keep an eye on key participants in international relations. If someone suddenly disappears from the sample in the subsequent stages, this will serve as a signal to check the data again or ask a new question.
What are the most popular types of events mentioned in the news and are there any features or changes throughout the period.
The number of press releases about meetings in 2010 is maximum. In 2014, a sharp increase in the number of messages about telephone conversations took place.
Russian politicians began to talk more and meet less. Operational and urgent tasks require fewer ceremonies.
I wonder what countries and organizations the number of telephone conversations in 2014 increased. I selected the participants with the maximum number of telephone conversations in 2014.
In 2014, we observe unique groups of participants in telephone conversations and an increase in direct contacts with a number of countries. Of the key participants in international relations, China is not listed, we will find out later what this may be connected with.
We plot the number of messages by country, taking into account multilateral telephone calls.
A noticeable increase in telephone conversations with Germany, France and the United States.
What about the meetings? Take the countries leading in the meetings and take a look at the big picture.
The graph is not the most indicative, but the data table shows that on 10/14/2014 there are no reports of Russian meetings with the United States and Israel.
The nature of Russia's interactions with specific countries is interesting. We continue to consider two key events of the meeting and telephone calls by country.
Our eastern neighbor does not like talking on the phone.
Telephone calls for the current year have broken all records.
Already the end of the year and no meetings.
Hopping changes.
In 2009, the year is completely calm. The lack of communications is likely due to the gas conflict between Russia and Ukraine in 2008-2009.
You may have noticed that in the “participants” column we have several types of values: indicating one or several countries separated by commas or countries and organizations.
Meetings between politicians are bilateral and multilateral. It is interesting to look at which countries Russia meets more often in bilateral negotiations, with which in multilateral ones.
To do this, I supplemented the data with another attribute: a coefficient equal to the ratio of the total number of meetings to the number of bilateral. Those countries that are below average are mostly negotiating at bilateral meetings; those above average participate actively in multilateral.
There is nothing surprising in the fact that the CIS countries were closer to the intersection point and above average - they take part in joint forums and summits. But what did France forget in their company? I made a summary table for all events involving France over the entire period, and it turned out that France was a third party in the negotiations to resolve the 2008 Georgian-South Ossetian conflict.
***
Of course, you can still get a lot of interesting things from this data, but I received answers to questions, which means that the goal has been achieved. Even more: now I always have information at hand for a deeper understanding of the current situation in foreign policy. As you can see, if you stop collecting numbers and start asking specific questions, the data answers in the language of useful and interesting conclusions.
In the end I will tell my favorite story about the first place of work of Avinash Koshik. The future world expert in the field of web analytics came to the company where 200 reports were configured. A month after his arrival Avinash Koshik disconnected them all. Two weeks passed, and no one noticed the loss.
upd. Promised files
1. Source
2. Processing
password for opening: habr2014