We connect Arduino to the electric meter
No, this article is not about yet another way to trick this ill-fated device. Here we will talk about how to use Arduino and LabView to turn your electricity meter into a tool for monitoring power consumption or even an ammeter!
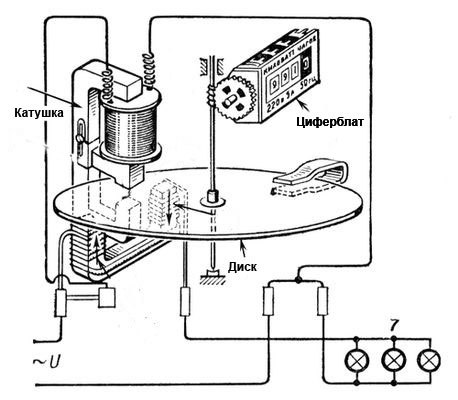
The very first electricity meter was induction. The principle of its operation is ridiculously simple - in fact it is an electric motor, the rotor of which is an aluminum disk that rotates the dial. The more current is consumed, the faster the disk spins. The device is purely analog.
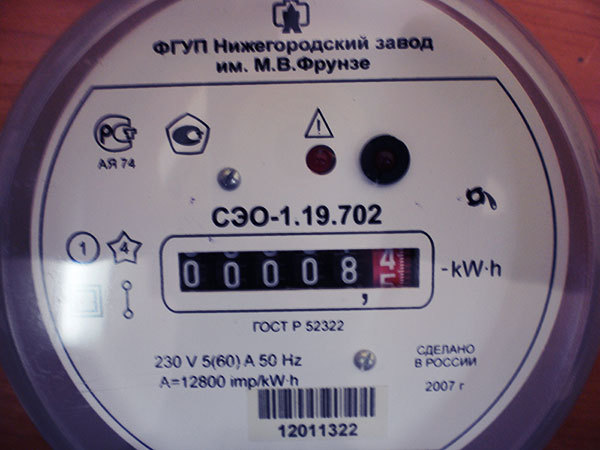
However, today induction meters are losing ground, giving way to their cheaper electronic counterparts. And just one such one will become experimental:
The principle of operation has not changed much - in this case, the disk is replaced by electronics, which generates pulses in accordance with the amount of electricity consumed. As a rule, in most devices these pulses are indicated by an LED indicator. Accordingly, the faster this light flashes, the more precious kW is burned.
In addition, on the front panel of any device there is a gear ratio of counter A - the number of pulses per 1 kW * h. As can be seen from the photo, the experimental A = 12800. The following conclusions can be drawn from this information:
- With each pulse, the meter captures the consumption equal to 1/12800 parts from 1 kW * h. If you turn on the load to the meter and start just counting the pulses, then it is easy to get the amount of electricity consumed by it (kW * h), dividing the number of pulses by the gear ratio.
- Since the indicator changes the speed of its blinking, it is possible to derive the relationship between the power (kW) and the time of one pulse of the counter, which will allow you to obtain data on power / current.
We will not load the article with calculations, but if necessary,
Thus, everything depends on the measurement of the time of one pulse (blinking indicator). In my research, I relied on this excellent project . A certain Italian made an interface in Labview for monitoring power and came up with a circuit for measuring pulses. But in his project there was a huge flaw - it was suitable only for meters with a gear ratio of 1000 imp / kW * h.
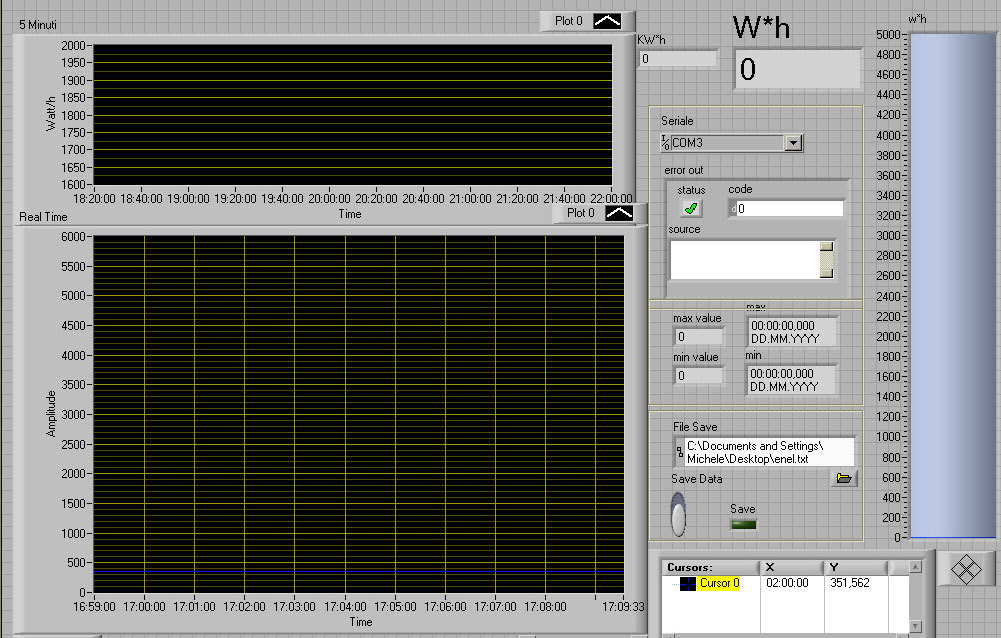
The upper graph is the average power in 5 minutes, the lower one is in real time. The interface is quite flexible and easily modified to fit your needs. If you have not dealt with LabView yet, I recommend that you get acquainted.
To make it work, it turned out to be enough to add one single block to the program algorithm, in accordance with the formula above.
So, if you still decide to implement power monitoring, then there are two options:
1. Your meter is closed and sealed by all means do not mess around. So, you can only read pulses using a photoresistor that responds to a blinking light bulb. It must be attached with a blue electrical tape opposite the LED indicator on the front panel of the meter.
The scheme will look as follows:
The program simply compares the resistance value on the photoresistor and potentiometer. Moreover, the latter allows you to set the sensitivity of such a sensor in order to avoid false triggering and adjust to the brightness of the indicator.
2. You have access to the pulse output of the counter. Many models have a pulse output that duplicates the blinks of a foot. This is done in order to be able to connect the device to an automated metering system. It is a transistor that opens when the indicator is on and closes when it goes out. It is not difficult to connect directly to it - this will require only one pull-up resistor. However, before doing this, make sure that it is a pulse output, and not something else! (there is always a scheme in the passport)
In my case - full access, so I didn’t bother much. Install LabView and go ahead and measure! All graphs represent real-time power (W).
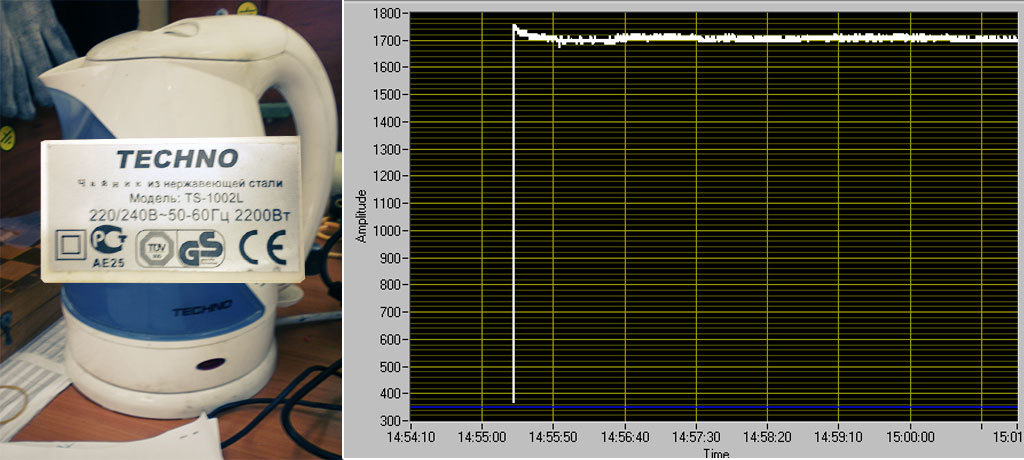
The first to fall was a long-suffering kettle. The lid says that he has a power of 2.2 kW, but judging by the schedule, he regularly consumes only 1700 watts. Please note that consumption is more or less constant over time. This means that the heating element (most likely nichrome) changes its resistance very slightly during the whole boiling process.
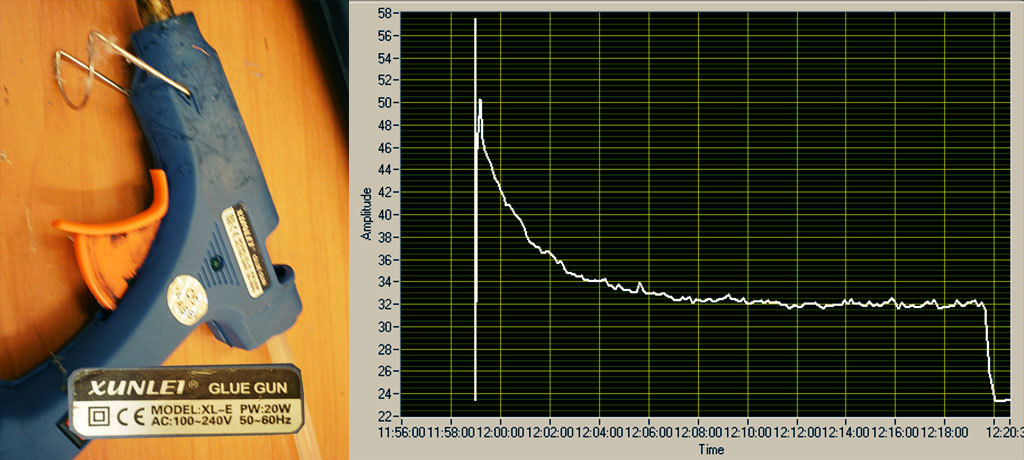
A glue gun is a completely different matter - the declared power is 20 W. It behaves in accordance with the laws of physics - when heated, the resistance of the heater increases, and the current decreases accordingly. Checked with a multimeter - everything is so.
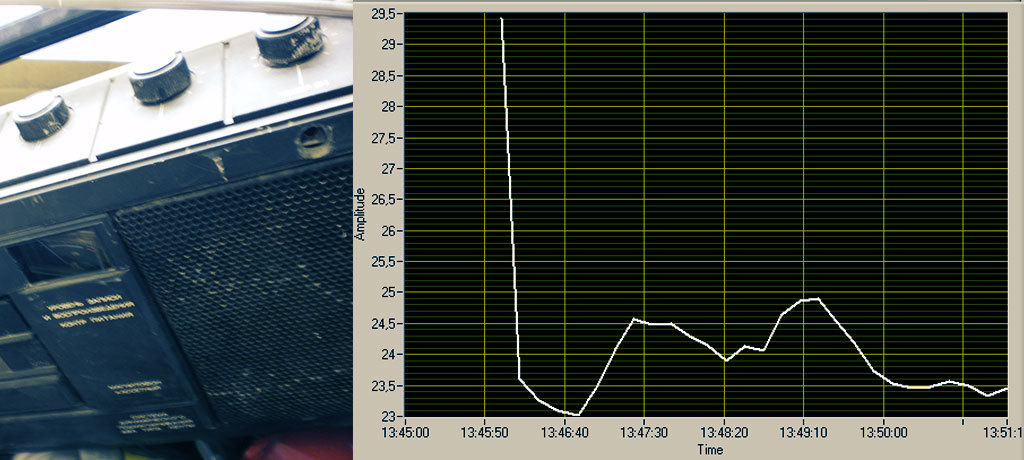
Old radio "Spring". Here, the graph went up at the beginning due to the fact that I started the measurement during the pulse, accordingly, this affected the data. The slides on the graph show how I turned the volume knob. The louder - the more the radio eats.
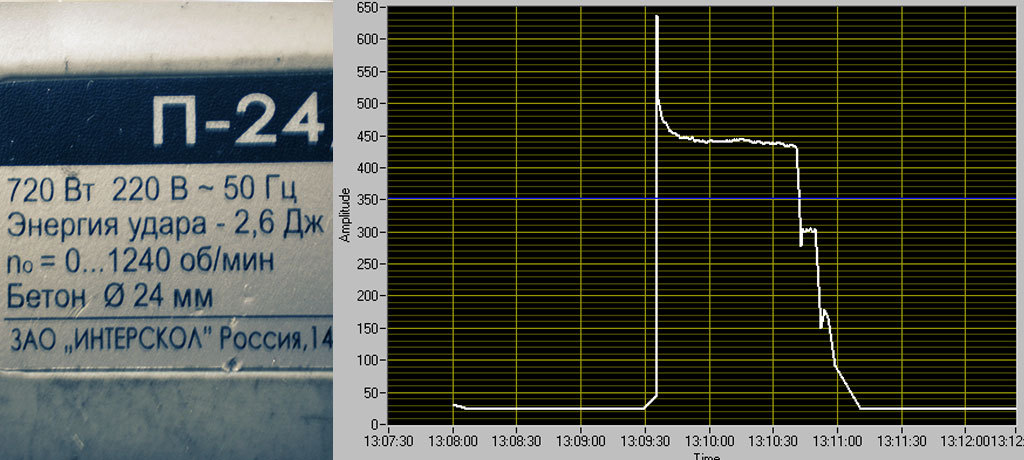
Hammer with declared power of 700 watts. He pressed the button all the way, waited a little and let go, but not smoothly. The graph shows the inrush current when starting the engine. That is why the light blinks when a good neighbor begins to peck his favorite wall.
And now for the fun part. I conducted a small experiment with my old laptop, the result of which is shown in the picture:
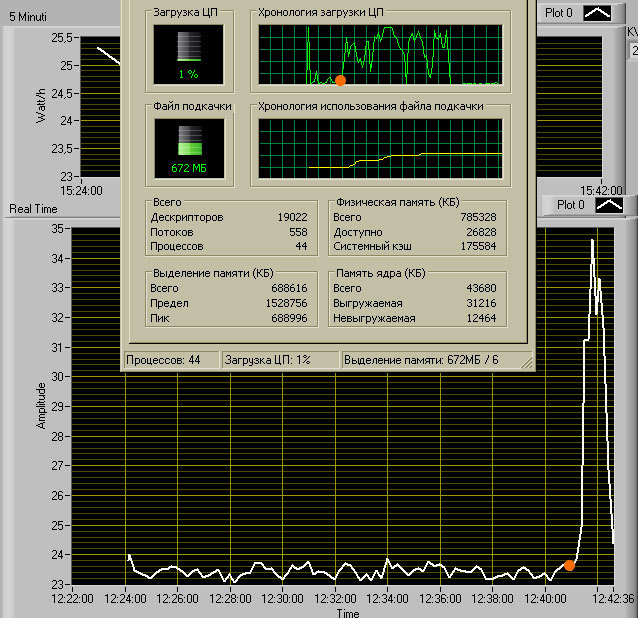
The orange dot marks the time when I launched several “heavy” programs at once. As you can see, processor load schedules and increased consumption have something in common. Recently, there was one interesting article that leads to some thoughts. I'm not sure that using power monitoring, you can merge encryption keys, but the fact is clear.
(Tremble the paranoid!)
In general, from a conventional counter and cheap Arduino, you can make a fairly simple and interesting solution for a home-made “smart home”. Besides, actually, monitoring of electricity consumption, there is quite a good opportunity to organize a control system for switched-on devices, which, based on changes in consumption and its nature, will guess what they turned on. Without any additional sensors.
Sketch sources for Arduino and LabView file can be downloaded on the author’s page . After installation,modify the file to add a block in accordance with the description above.
The very first electricity meter was induction. The principle of its operation is ridiculously simple - in fact it is an electric motor, the rotor of which is an aluminum disk that rotates the dial. The more current is consumed, the faster the disk spins. The device is purely analog.
However, today induction meters are losing ground, giving way to their cheaper electronic counterparts. And just one such one will become experimental:
The principle of operation has not changed much - in this case, the disk is replaced by electronics, which generates pulses in accordance with the amount of electricity consumed. As a rule, in most devices these pulses are indicated by an LED indicator. Accordingly, the faster this light flashes, the more precious kW is burned.
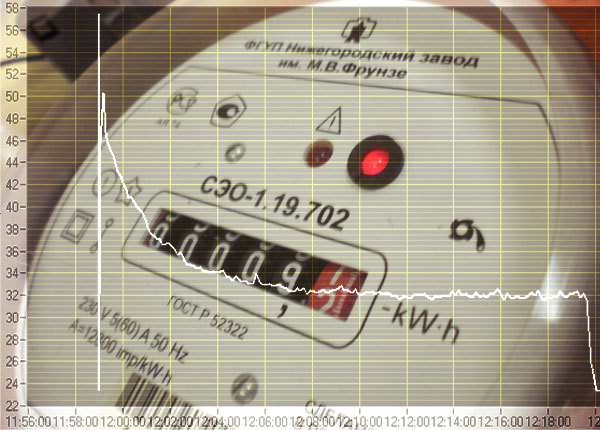
In addition, on the front panel of any device there is a gear ratio of counter A - the number of pulses per 1 kW * h. As can be seen from the photo, the experimental A = 12800. The following conclusions can be drawn from this information:
- With each pulse, the meter captures the consumption equal to 1/12800 parts from 1 kW * h. If you turn on the load to the meter and start just counting the pulses, then it is easy to get the amount of electricity consumed by it (kW * h), dividing the number of pulses by the gear ratio.
- Since the indicator changes the speed of its blinking, it is possible to derive the relationship between the power (kW) and the time of one pulse of the counter, which will allow you to obtain data on power / current.
We will not load the article with calculations, but if necessary,
here they are
Verily, the gear ratio of the meter is a great thing, since knowing it can be expressed both power and current:
We compose the proportion of our gear ratio (A = 12800 imp / kW * h) and the unknown gear ratio, which will be at load X and in time one single impulse (blinking light bulb):
Here X is the unknown power, and t is the time of one impulse. We express the unknown power from here and here it is: The
current is calculated using the following proportion of gear ratios and currents known and unknown at load X .:
Which, in general, leads to an identical formula, but for current (current is measured in Amperes and the indices mean the load at which will be the current):
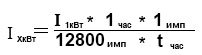
Here you can see the pitfall - you need to know the current at an ideal load of 1 kW. If good accuracy is needed, it is better to measure it yourself, but if not, it can be approximately calculated using the formula (voltage and power are known), but it will be more rude, since the power factor is not taken into account.
We compose the proportion of our gear ratio (A = 12800 imp / kW * h) and the unknown gear ratio, which will be at load X and in time one single impulse (blinking light bulb):
Here X is the unknown power, and t is the time of one impulse. We express the unknown power from here and here it is: The
current is calculated using the following proportion of gear ratios and currents known and unknown at load X .:
Which, in general, leads to an identical formula, but for current (current is measured in Amperes and the indices mean the load at which will be the current):
Here you can see the pitfall - you need to know the current at an ideal load of 1 kW. If good accuracy is needed, it is better to measure it yourself, but if not, it can be approximately calculated using the formula (voltage and power are known), but it will be more rude, since the power factor is not taken into account.
Thus, everything depends on the measurement of the time of one pulse (blinking indicator). In my research, I relied on this excellent project . A certain Italian made an interface in Labview for monitoring power and came up with a circuit for measuring pulses. But in his project there was a huge flaw - it was suitable only for meters with a gear ratio of 1000 imp / kW * h.
The upper graph is the average power in 5 minutes, the lower one is in real time. The interface is quite flexible and easily modified to fit your needs. If you have not dealt with LabView yet, I recommend that you get acquainted.
To make it work, it turned out to be enough to add one single block to the program algorithm, in accordance with the formula above.
It looks like this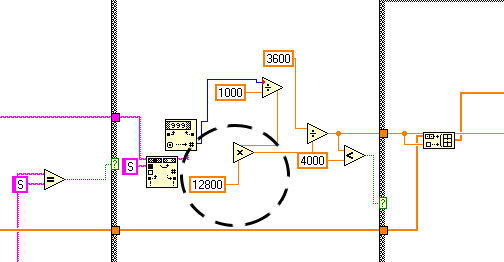
It would seem simple, but we still have to think of it!
It would seem simple, but we still have to think of it!
So, if you still decide to implement power monitoring, then there are two options:
1. Your meter is closed and sealed by all means do not mess around. So, you can only read pulses using a photoresistor that responds to a blinking light bulb. It must be attached with a blue electrical tape opposite the LED indicator on the front panel of the meter.
The scheme will look as follows:
Circuit for non-contact impulse removal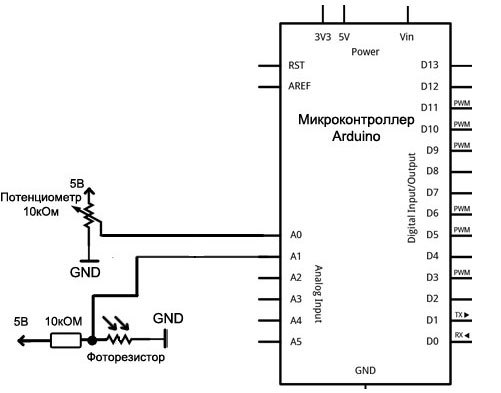
The program simply compares the resistance value on the photoresistor and potentiometer. Moreover, the latter allows you to set the sensitivity of such a sensor in order to avoid false triggering and adjust to the brightness of the indicator.
2. You have access to the pulse output of the counter. Many models have a pulse output that duplicates the blinks of a foot. This is done in order to be able to connect the device to an automated metering system. It is a transistor that opens when the indicator is on and closes when it goes out. It is not difficult to connect directly to it - this will require only one pull-up resistor. However, before doing this, make sure that it is a pulse output, and not something else! (there is always a scheme in the passport)
Circuit for connection to telemetric output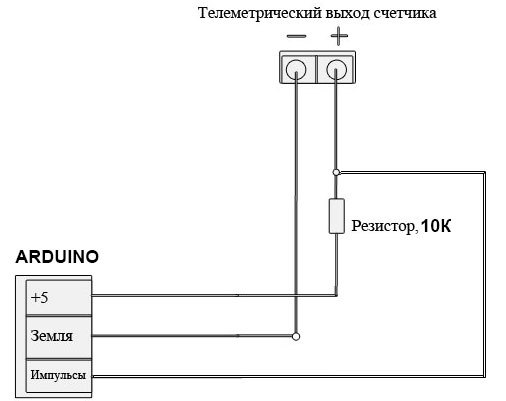
In my case - full access, so I didn’t bother much. Install LabView and go ahead and measure! All graphs represent real-time power (W).
The first to fall was a long-suffering kettle. The lid says that he has a power of 2.2 kW, but judging by the schedule, he regularly consumes only 1700 watts. Please note that consumption is more or less constant over time. This means that the heating element (most likely nichrome) changes its resistance very slightly during the whole boiling process.
A glue gun is a completely different matter - the declared power is 20 W. It behaves in accordance with the laws of physics - when heated, the resistance of the heater increases, and the current decreases accordingly. Checked with a multimeter - everything is so.
Old radio "Spring". Here, the graph went up at the beginning due to the fact that I started the measurement during the pulse, accordingly, this affected the data. The slides on the graph show how I turned the volume knob. The louder - the more the radio eats.
Hammer with declared power of 700 watts. He pressed the button all the way, waited a little and let go, but not smoothly. The graph shows the inrush current when starting the engine. That is why the light blinks when a good neighbor begins to peck his favorite wall.
And now for the fun part. I conducted a small experiment with my old laptop, the result of which is shown in the picture:
The orange dot marks the time when I launched several “heavy” programs at once. As you can see, processor load schedules and increased consumption have something in common. Recently, there was one interesting article that leads to some thoughts. I'm not sure that using power monitoring, you can merge encryption keys, but the fact is clear.
(Tremble the paranoid!)
In general, from a conventional counter and cheap Arduino, you can make a fairly simple and interesting solution for a home-made “smart home”. Besides, actually, monitoring of electricity consumption, there is quite a good opportunity to organize a control system for switched-on devices, which, based on changes in consumption and its nature, will guess what they turned on. Without any additional sensors.
Sketch sources for Arduino and LabView file can be downloaded on the author’s page . After installation,