How do we choose investment funds. Where dreams come from
Using a very useful link in the comments to the first topic “Enlarge your pension size” you can see the results of the work of pension funds for several years. The question for mathematicians is how many observations do we need to draw conclusions based on statistics? thirty? And if we have only 3?
Learning to correctly understand the information provided is a separate task. For example, during the years of stagnation in the economy, when investment opportunities are not particularly visible, the high result of a certain fund leads to its popularity. Knowing the features of the operation of pension funds, it can be assumed that this yield is most likely simply due to the fact that the fund invests, for example, in profitable (risky) bonds, which, in fact, in the current economic situation are the best investment. The problem is that very soon the conditions will change (they tend to change), investments in those bonds will become far from adequate, and then this fund can move from the top of the ranking to the bottom.
What is the focus on the recent result of the foundation’s work, MorningStar agency illustrates in detail:
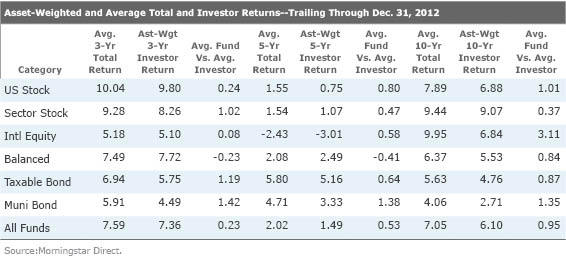
In this plate, the triple columns show the average annual return on funds and the return on investors of this fund for periods of 3, 5 and 10 years. Every third column of numbers is the difference between the results of funds and the results of their investors. Horizontally, the rows indicate the assets on which the funds specialize. Please note that investors consistently manage to get results worse than those funds in which they invest! It is because of focus on past results.
The second important point is that investors in “balanced” funds managed to surpass the results of their funds between 3 and 5 years :) This is very significant in the context of the topic of asset allocation ...
In addition, Morningstar illustrates what exactly happens to investors:
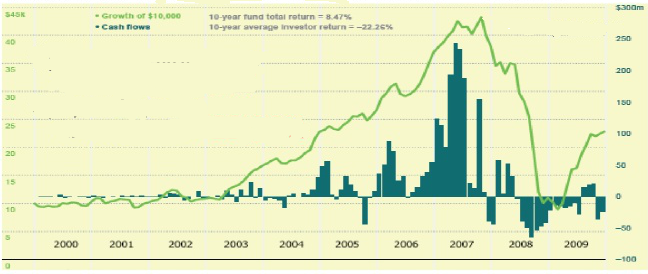
The dark bars represent the inflow / outflow of funds into investment funds, the Green line represents the dynamics of the initial hypothetical investments of 10 thousand dollars. Despite the fact that for 10 years investment funds earned more than 8% per year, investors managed to lose more than 22% of funds per year on average.
For the reason that the inflow of investments in funds increased at maximum growths, and vice versa, investors took funds from drawdowns, which turned out to be temporary. Those. investors bought more expensive shares of funds at maximum prices and got rid of cheaper shares at minimum prices. Rebalancing implies the opposite effect ...
This data can be interpreted in different ways. It seems to me personally that financial markets (as well as the economy) switch between different modes of operation, which helps investors with balanced funds to some extent, but it really hinders those who are trying to adapt to last year’s snow.
Learning to correctly understand the information provided is a separate task. For example, during the years of stagnation in the economy, when investment opportunities are not particularly visible, the high result of a certain fund leads to its popularity. Knowing the features of the operation of pension funds, it can be assumed that this yield is most likely simply due to the fact that the fund invests, for example, in profitable (risky) bonds, which, in fact, in the current economic situation are the best investment. The problem is that very soon the conditions will change (they tend to change), investments in those bonds will become far from adequate, and then this fund can move from the top of the ranking to the bottom.
What is the focus on the recent result of the foundation’s work, MorningStar agency illustrates in detail:
In this plate, the triple columns show the average annual return on funds and the return on investors of this fund for periods of 3, 5 and 10 years. Every third column of numbers is the difference between the results of funds and the results of their investors. Horizontally, the rows indicate the assets on which the funds specialize. Please note that investors consistently manage to get results worse than those funds in which they invest! It is because of focus on past results.
The second important point is that investors in “balanced” funds managed to surpass the results of their funds between 3 and 5 years :) This is very significant in the context of the topic of asset allocation ...
In addition, Morningstar illustrates what exactly happens to investors:
The dark bars represent the inflow / outflow of funds into investment funds, the Green line represents the dynamics of the initial hypothetical investments of 10 thousand dollars. Despite the fact that for 10 years investment funds earned more than 8% per year, investors managed to lose more than 22% of funds per year on average.
For the reason that the inflow of investments in funds increased at maximum growths, and vice versa, investors took funds from drawdowns, which turned out to be temporary. Those. investors bought more expensive shares of funds at maximum prices and got rid of cheaper shares at minimum prices. Rebalancing implies the opposite effect ...
This data can be interpreted in different ways. It seems to me personally that financial markets (as well as the economy) switch between different modes of operation, which helps investors with balanced funds to some extent, but it really hinders those who are trying to adapt to last year’s snow.