Anatomy of an incident, or how to work on reducing downtime
Sooner or later in any project it is time to work on the stability / availability of your service. For some services at the initial stage, the speed of developing features is more important, at this moment the team is not fully formed, and the technologies are not chosen very carefully. For other services (most often b2b technology) in order to gain customer confidence, the need to ensure high uptime arises with the first public release. But let us assume that the moment X has nevertheless arrived and you have begun to worry about how much time your service "lies" in the reporting period. Under the cut, I propose to see what makes up the downtime, and how best to work on reducing it.
Indicators
Obviously, before you improve something, you need to understand the current state. Therefore, if we started to reduce downtime, we should first start measuring it.
We will not talk here in detail about how to do it specifically, the pros and cons of different approaches, but the process looks something like this:
- rely on near-business metrics (errors in the service, service response time, $ / second, signups / second and so forth)
- determine what is good and what is bad
- the transition is good-> bad is the beginning of the incident
- transition is bad-> good - end of the incident
- time from beginning to end - the duration of the incident (cap with us)
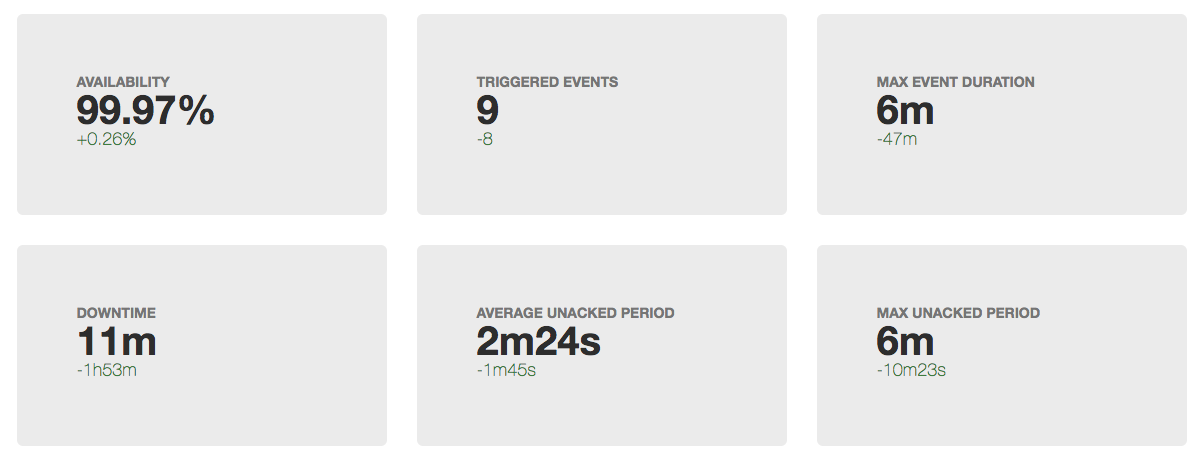
- the sum of the duration of incidents for the period (month / quarter / year) - downtime (downtime)
- (100 - <idle time> / <period duration> * 100) = availability percentage for the period
When talking about uptime / downtime, they often mention another indicator:
MTTR (mean time to repair) - the average time from the beginning of the incident to its end.
Problems with it begin right from the first word in the abbreviation. Considering that all incidents are different, averaging the duration cannot tell us anything about the system.
This time we will not average anything, but just see what happens during the incident.
Anatomy of an incident
Let's see which significant steps can be highlighted during the incident:
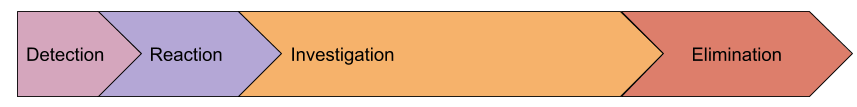
- detection - the interval between the first error that we gave to the user, before the SMS arrived on duty
- reaction - from receiving a problem notification to the moment when a person started solving this problem (usually at that moment the event in the monitoring is transferred to the Acknowledged state)
- investigation - from the beginning of work on the problem to the moment when the cause of the incident is clear and we know what needs to be done to restore the work.
- elimination - recovery time, for example, roll back the release, promote the new
masterprimary database server
Perhaps our model is incomplete and there are some other stages, but I propose to introduce them only after realizing how this will help us in practice. In the meantime, consider each stage in more detail.
Detection
Why do we spend time on detecting an emergency? Why not send a notification on the first error the user received? In fact, I know many companies that tried to do this, but this idea was rejected in just a few hours, for which several dozens of SMS messages were received. I think that there is not a single more or less large service that does not have a constant “background” error stream. Not all of them are a sign that something has broken, there are also bugs in the software, invalid data obtained from the form and insufficient validation, and so on.
As a result, the level of errors (or other metrics) that exceeds daily fluctuations is used as a criterion for opening an incident. This is what leads to the notification of responsible employees after the actual start of the problem.
But back to our original task - reducing the duration of incidents. How can we shorten the detection time? Faster notify? Come up with super logic detection of anomalies?
I propose to do nothing so far, but look at the following stages, since in reality they are interrelated.
Reaction
Here we have a purely human factor. We assume that the monitoring coped with the detection of the problem and we successfully woke up the engineer on duty (the entire escalation also worked at the previous stage).
Consider the "worst" case, we have no on-call duty service, and an alert has caught the admin sleeping peacefully. His actions:
- react to SMS: a wife with sensitive hearing helps here, various phone applications that enhance the effect of receiving an SMS (1-5 minutes)
- decide that he will still get out of bed: if the alerts are configured incorrectly, a person can wait for 2 minutes "and what if the resolve comes?" and fall asleep (1-15 minutes)
- get to the laptop, open your eyes, wake up, get to the monitoring, press Ack: (1-15 minutes)
As a result, in the worst case, we get 35 minutes of reaction. According to my observations, this reaction time seems to be true.
Since at this stage we are dealing with people, it is necessary to act very carefully and thought out. In no case do not need to write a regulation, according to which a person who has just woken up should move! Let's just create the conditions.
Let's first remove the engineer’s doubts that the problem will end on its own. This is done very simply: to make the alert criterion insensitive to minor problems and notify if the incident lasts for any significant time . Yes, we have just increased the duration of the "detection" stage, but let's look at an example:
- increase the detection time by 5 minutes
- the number of incidents decreases: all short bursts of errors usually fit into 1 minute. These short incidents must be recorded, but without notifying people. Often, in total, they give a very long downtime, but you can deal with them during working hours. For this task, you will need a high level of detail in monitoring, since the problem has already ended, and diagnostic tools for the most part do not store history.
- if a person is forced to respond to alerts once a month or less, and not every other day, he will react to it more adequately and not treat it as a routine
- delayed notification allows a person not to think: if the SMS has arrived, then everything is serious and will not correct itself
Potentially, this approach will reduce the total reaction time by 15+ minutes. If this reaction time does not suit you, you should think about the duty service.
Investigation
Perhaps this is the most difficult stage of the accident, when you need to understand what is happening and what to do. In reality, this stage is very often combined with the stage of taking action, since the process usually goes like this:
- We look into monitoring, logs (if monitoring is not enough), we run some other diagnostic tools
- hypothesize
- check hypotheses, either by metrics or by performing some actions (restarts all in a row :)
- we estimate the results of changes
- we communicate with colleagues if your knowledge of a particular subsystem is not enough
and until enlightenment or the end of an incident.
This stage is usually the most significant in the total duration of the incident. How to reduce it?
Here everything is not very clear, there are several vectors:
- Simplify infrastructure : Imagine how fast people who have one database and one service are troubling
- spreading knowledge in a team : ideally, if people’s communication is not going on during the incident, but during their daily work (people’s communication is generally a very long process)
- monitoring : many people think that monitoring only works at the "detection" stage, but in fact it can act as an optimization of the hypothesis testing process ("does the database work properly?", "has my service rested on resources?") and also as a transport spread knowledge in a team. "Seryoga, check if there are errors in the log X about deadlocks?" can be turned into a trigger, the description of which will be a link to the wiki with the instruction .
Elimination
As I said above, this stage often merges with the previous one. But it happens that the reason is immediately clear, but the recovery will be very long. For example, you have a dead server withmaster primary (I won’t get used to it :) for a long time :), and you never prompted a replica, that is, you’ll read the documentation, roll out a new config of applications, etc.
Naturally, after each significant incident, you need to figure out how to prevent this from happening again or greatly speed up the recovery. But let's see which areas we can try to work proactively:
- infrastructure management toolkit : if in order to fix everything you need to roll out a new config, but this is done in at least 20 minutes - this is your limitation. Try to come up with scenarios that could happen and a way to urgently accelerate some processes. For example, in ansible you have configured serial (parallel execution of tasks) = 3, but if you are still lying, you can roll with serial = 30, you need to teach everyone to redefine it (similarly about rolling update strategy in kubernetes).
- teachings : if you know the probable failure and recovery scenarios you do not have automated, you must have an instruction that must be tested . Schedule downtime (if needed), hold the exercises. Often, at this stage, such cases are automated, since the process of the exercise reveals most of the pitfalls of even the most complex at first glance procedures.
- interaction with contractors : you must know in advance what you will do if your hoster becomes ill. Often, an awareness of the likelihood of a problem and the cost of closing risks leads to the conclusion - “we’ll just wait for recovery”. But on the other hand, engineers and business will be ready for such a scenario. For example, you can work through the issue of switching your traffic to a pre-prepared stub, notify users of a pre-prepared letter, and so on. Or vice versa, you make an instruction, according to which we give the hoster 30 minutes to recover, and then we start moving to another DC, where we already have a replica of the database, but we need to expand everything else. And here again, the teachings, note the time to move and so on.
MTBF (Mean Time Between Failures)
Another common indicator that is mentioned when discussing uptime. I propose again not to average anything, but simply to talk about the number of incidents that occur during the time interval.
Here comes to the fore the question of how you have taken care of the resiliency of your service:
- is there a single point of failure (SPOF) in the infrastructure, what is the probability of failure?
- How confident are you that there are no SPOFs that you do not know about? (this is exactly the problem that is solved with the help of chaos monkey )
- Do load balancers work well for failures? ( my balancing report )
- How resilient is the network?
- How reliable is the datacenter?
Sometimes, in order to calculate / predict all this, a “risk map” is made, where each scenario (which could naturally be assumed, always contains those that we do not yet know) has the likelihood + effect (short / long downtime, data loss, reputational loss). , etc). Then, according to such a map, they systematically work, closing, in the first place, highly probable and serious scenarios.
Another technique that can be used is the classification of past incidents. Now there is a lot of talk about the fact that it is very useful to write "post mortem" incidents, where the causes of the problem, the actions of people are analyzed, and possible future actions are worked out. But in order to quickly look at the causes of all accidents over the past period, it is convenient to sum up their duration with grouping into “problem classes” and where downtime is most likely to take action:
- human errors : reduce the number of manual actions in production, different protection against operator error
- unsuccessful releases : it is worth improving testing (including load)
- application errors : repair leaks, crashes and other “freezes”
- network : buy equipment, set up, hire networkers, change contractor
- database : hire a DBA, take care of fault tolerance, buy better hardware
- DC : think about the reserve or move
- external influences (ddos, locks, certificate reviews, domains): buy antiddos, stock up with proxy, monitor domains / certificates, have several certificates from different CA.
That is, if you do not even try to predict possible scenarios of problems, then it is definitely worth working with incidents that have already happened.
Total
All incidents are different:
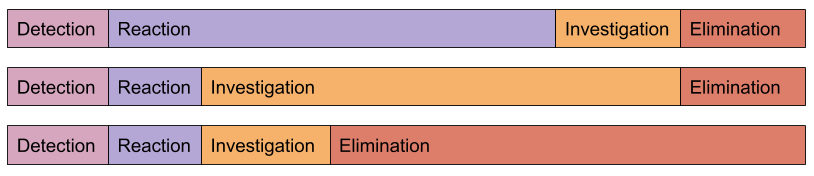
The algorithm for working on increasing uptime is very similar to any other optimization:
измеряй -> анализируй -> пробуй улучшить -> оценивай результатFrom my own experience I can say that in order to significantly improve uptime, it’s enough just to start following him and analyze the causes of incidents. It usually happens that the most simple changes bring the most significant effect.
Our monitoring service helps not only with the "detection" stage, but also greatly reduces the "investigation" (customers will confirm)