Log4j 1.x performance in synchronous and asynchronous mode
Good day, harazhiteli!
I am currently working on improving the performance of a large enterprise solution. Its specificity allows many users to perform similar actions, and accordingly, behind the scenes, the application server works with the same code. And now, at one point in the long path to speeding up the application, it was noticed that log4j takes the top places in the top of the lowest performing sections. The first thought was - excessive logging, but subsequent analysis denied it. Moreover, this is extremely important data for support engineers, and if you remove it now, then either the code will be returned back or the analysis of server production problems will be significantly more difficult.
This prompted me to this study - is there a way to optimize the logging process?
Disclaimer: due to the abundance of diagrams in this article causing psychedelic associations (like this: this is not a comparison of synchronous and asynchronous logging modes, the dragon kills a snake here!), it is not recommended for minors, people with an unstable psyche and pregnant women whose code is already in production and the issue of the next patch is not this year.
Caution, traffic under the cut.
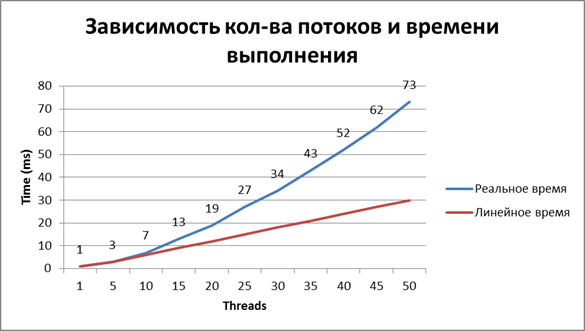
As usual, the reason is commonplace - “competitive access”. After several experiments with a floating number of parallel threads, it became clear that the working time of the logging call is not linear, so the output is that the hard drive loses a lot.
Here are the measurement results:
Look for other ways of logging, upgrade libraries, you can do all this, but the task is to achieve maximum results with minimum efforts. I can tell you about the log4j 2 library too, but this will be a separate article. Now we will consider the means provided to us “out of the box” in log4j 1.x.
Among the appenders supplied with the library, there is AsyncAppender, which allows using the intermediate buffer to accumulate logging events to organize asynchronous work with the file system (if the final appender is just a file system, because it was originally intended for the SMTP logger). When generated, logging events accumulate, and only when a certain level of buffer fullness is reached, they get to the file.
Now that the approach is defined, we need to understand how effective it is, for this we will carry out the appropriate measurements.
We will measure it this way:
0) I warn you in advance, “I didn’t make beautiful data,” in places it’s clear that the processor switched to another job, and I left these places as it was. This is also part of the real work of the system.
1) We divide the tests into 3 groups:
- 10 logging events (from 1 to 10 in increments of 1)
- 550 logging events (from 10 to 100 in increments of 10)
- 5500 logging events (from 100 to 1000 in increments of 100)
2) B each group will have 3 subgroups of tests - depending on the size of the buffer (try to find the optimal one):
- 500 events
- 1500 events
- 5000 events
3) Tests will be performed synchronously and asynchronously.
4) The tests themselves are simple logging calls interspersed with “random operation” (duration from 1 to 15 ms, in order to be able to alternate access to the file).
Both results (plus intermediate, so as not to lose the thread), synchronous and asynchronous, we will visualize with diagrams, for clarity.
So, let's begin.
Here are the results:


Now I think you can clearly see the acceleration in asynchronous mode.
But before drawing conclusions, let's repeat our tests on 5 and 10 threads.

The conclusion, as they say, on the face.
Since now we can definitely talk about the advantage of the asynchronous method of logging, then let's try to increase the volume of tests by another 10 times. Add a test for 55,000 logging events (from 1000 to 10000 in increments of 1000). We take the buffer equal to 500 (since it at first glance, and later it will be proved, is the most optimal in our tests).
Total - 500 events , it is our buffer that allows us to work most efficiently in asynchronous mode.
And now if we even compare the total (or average) runtime of all the tests, then you can get a constant that displays the winning order of the asynchronous mode before the synchronous one, I have it - 8.9 (times) .
The above material makes it clear that the asynchronous logging strategy gives a performance gain. Then the question begs - why not use it always? In order to make a choice in favor of a particular method, you need to imagine the mechanisms that are hidden inside. Below I give a few theses taken from the offsite:
1) AsyncAppender operates with its own thread (while FileAppender itself runs in the context of the current thread), therefore, when using it, it is desirable to increase the limit of application server threads.
2) When using AsyncAppender, memory overhead occurs, since the logging events are not dumped to the file instantly, but by first filling the buffer.
3) The lock of the log file lasts longer than when using the synchronous approach, since the message buffer contains much more information for recording.
In principle, everything is prosaic, but here you need to understand that synchronization itself is also a lock, so it is important to transfer it from one place to another does not make it worse.
Use asynchrony where it is really needed:
- long-playing appenders - SMTP, JDBC
- general resource blocking - FTP, Local File Storage
But first of all, be sure to profile your code.
Excel version of this article:
docs.google.com/spreadsheet/ccc?key=0AkyN15vTZD-ddHV0Y3p4QVUxTXVZRldPcU0tNzNucWc&usp=sharing
docs.google.com/spreadsheet/ccc?key=0AkyN15vTZD-ddVhjdjjdjjdjjdjjjdjjdjjdjjjdjjjdjjdjjjdjjjdjjjdjjjdjjjjdjjjjjjjdj
Thanks for attention. I hope the article will be useful to you.
Have a productive week!
I am currently working on improving the performance of a large enterprise solution. Its specificity allows many users to perform similar actions, and accordingly, behind the scenes, the application server works with the same code. And now, at one point in the long path to speeding up the application, it was noticed that log4j takes the top places in the top of the lowest performing sections. The first thought was - excessive logging, but subsequent analysis denied it. Moreover, this is extremely important data for support engineers, and if you remove it now, then either the code will be returned back or the analysis of server production problems will be significantly more difficult.
This prompted me to this study - is there a way to optimize the logging process?
Disclaimer: due to the abundance of diagrams in this article causing psychedelic associations (like this: this is not a comparison of synchronous and asynchronous logging modes, the dragon kills a snake here!), it is not recommended for minors, people with an unstable psyche and pregnant women whose code is already in production and the issue of the next patch is not this year.
Caution, traffic under the cut.
What is the reason?
As usual, the reason is commonplace - “competitive access”. After several experiments with a floating number of parallel threads, it became clear that the working time of the logging call is not linear, so the output is that the hard drive loses a lot.
Here are the measurement results:
What is the solution?
Look for other ways of logging, upgrade libraries, you can do all this, but the task is to achieve maximum results with minimum efforts. I can tell you about the log4j 2 library too, but this will be a separate article. Now we will consider the means provided to us “out of the box” in log4j 1.x.
Among the appenders supplied with the library, there is AsyncAppender, which allows using the intermediate buffer to accumulate logging events to organize asynchronous work with the file system (if the final appender is just a file system, because it was originally intended for the SMTP logger). When generated, logging events accumulate, and only when a certain level of buffer fullness is reached, they get to the file.
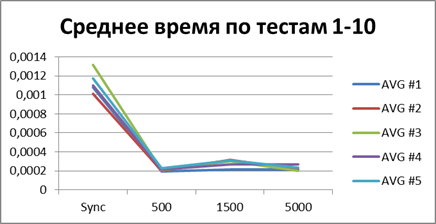
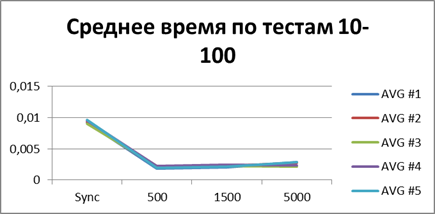
Measurements
Now that the approach is defined, we need to understand how effective it is, for this we will carry out the appropriate measurements.
We will measure it this way:
0) I warn you in advance, “I didn’t make beautiful data,” in places it’s clear that the processor switched to another job, and I left these places as it was. This is also part of the real work of the system.
1) We divide the tests into 3 groups:
- 10 logging events (from 1 to 10 in increments of 1)
- 550 logging events (from 10 to 100 in increments of 10)
- 5500 logging events (from 100 to 1000 in increments of 100)
2) B each group will have 3 subgroups of tests - depending on the size of the buffer (try to find the optimal one):
- 500 events
- 1500 events
- 5000 events
3) Tests will be performed synchronously and asynchronously.
Synchronous Logger Configuration
Asynchronous Logger Configuration
4) The tests themselves are simple logging calls interspersed with “random operation” (duration from 1 to 15 ms, in order to be able to alternate access to the file).
Test source code
package com.ice.logger_test;
import org.apache.commons.lang3.time.StopWatch;
import org.apache.log4j.Logger;
import java.util.Random;
public class SimpleTest {
    private static Logger logger = Logger.getLogger(SimpleTest.class);
    private static double NANOS_TO_SEC = 1000000000.0d;
    private static String LOG_MESSAGE =
            "One hundred bytes log message for performing some tests using sync/async appenders of log4j library";
    public static void main(String[] args) throws InterruptedException {
        //performTest("Single thread");
        ThreadRunner t1 = new ThreadRunner();
        new Thread(t1).start();
        new Thread(t1).start();
        new Thread(t1).start();
        new Thread(t1).start();
        new Thread(t1).start();
        new Thread(t1).start();
        new Thread(t1).start();
        new Thread(t1).start();
        new Thread(t1).start();
        new Thread(t1).start();
    }
    private static void performTest(String message) throws InterruptedException {
        logger.info("Warm-up...");
        logger.info("Warm-up...");
        logger.info("Warm-up...");
        StopWatch timer = new StopWatch();
        Random ran = new Random();
        for(int i = 1; i <= 10000; i += getIncrementator(i)) {
            timer.reset();
            timer.start();
            int iterations = 0;
            for(int j = 1; j <= i; j++) {
                timer.suspend();
                Thread.sleep(ran.nextInt(15)+1); // some work
                timer.resume();
                logger.info(LOG_MESSAGE);
                timer.suspend();
                Thread.sleep(ran.nextInt(15)+1); // some work
                timer.resume();
                iterations = j;
            }
            timer.stop();
            System.out.printf(message + " %d iteration(s) %f sec\n", iterations, (timer.getNanoTime() / NANOS_TO_SEC));
        }
    }
    private static int getIncrementator(int i) {
        if(i >= 0 && i < 10) return 1;
        if(i >= 10 && i < 100) return 10;
        if(i >= 100 && i < 1000) return 100;
        if(i >= 1000 && i < 10000) return 1000;
        if(i >= 10000 && i <= 100000) return 10000;
        return 0;
    }
    static class ThreadRunner implements Runnable {
        @Override
        public void run() {
            try {
                performTest(Thread.currentThread().getName());
            } catch (InterruptedException e) {
                e.printStackTrace();
            }
        }
    }
}
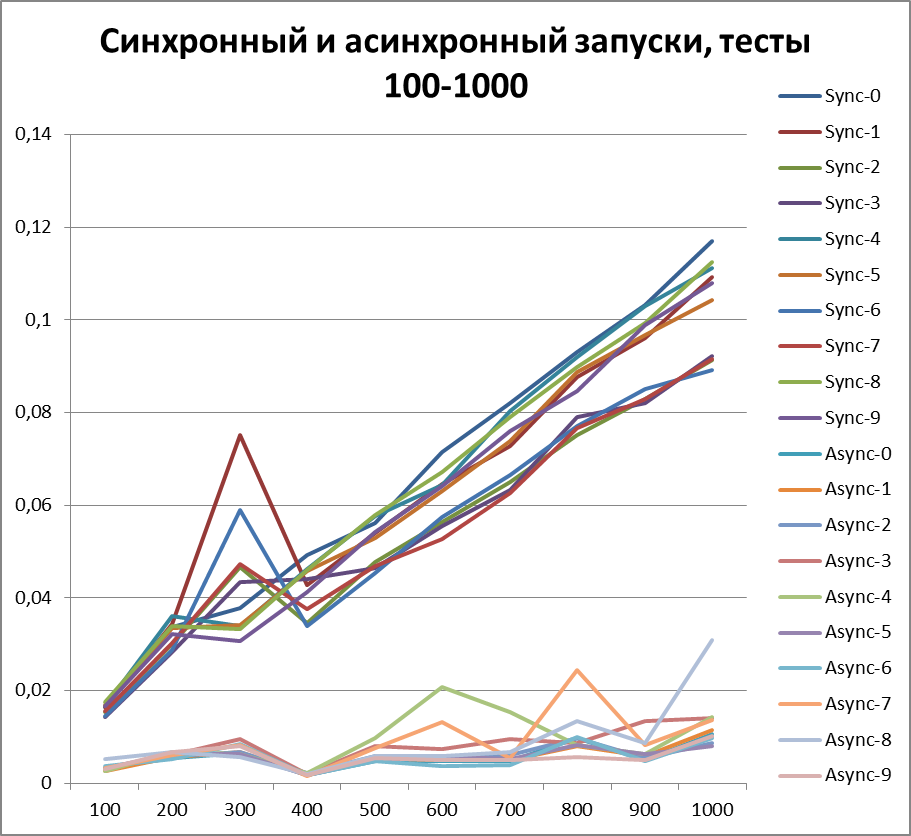
Both results (plus intermediate, so as not to lose the thread), synchronous and asynchronous, we will visualize with diagrams, for clarity.
So, let's begin.
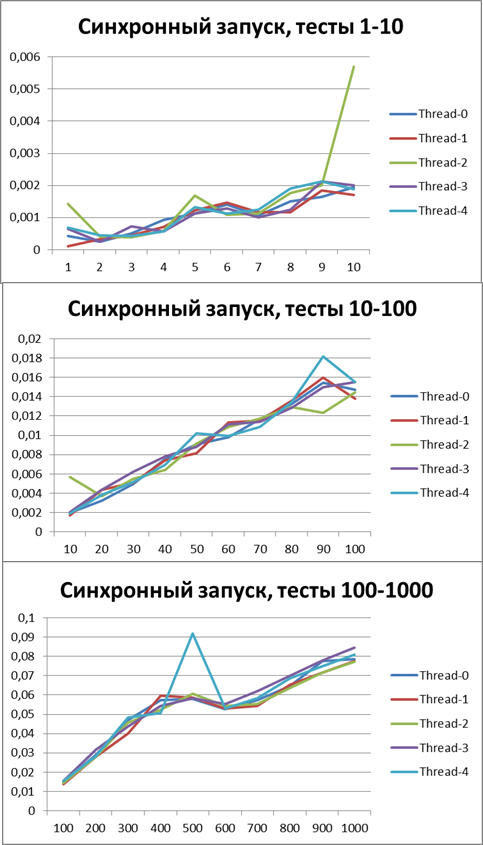
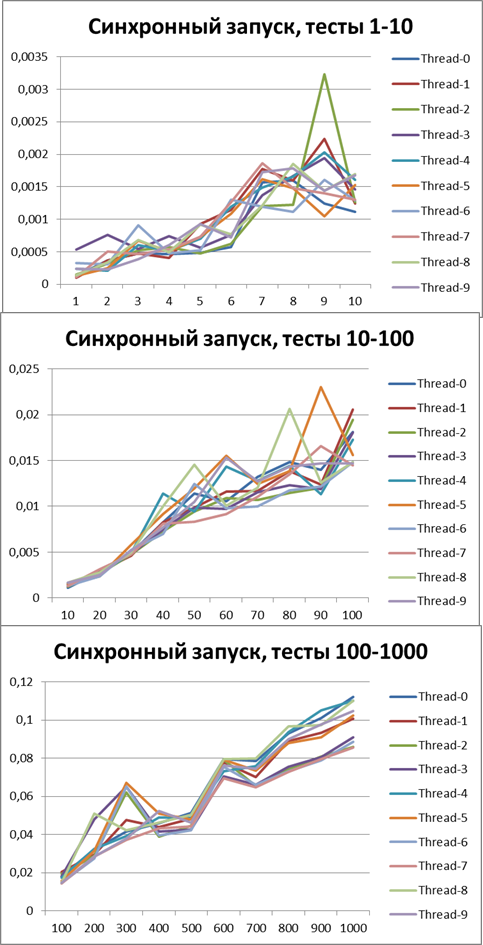
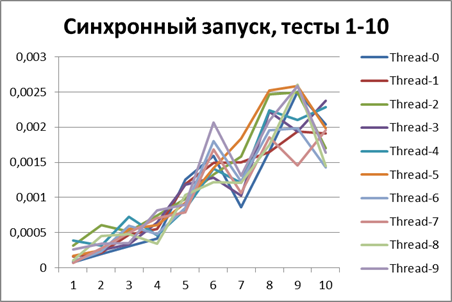
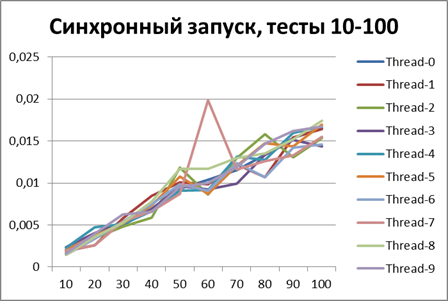
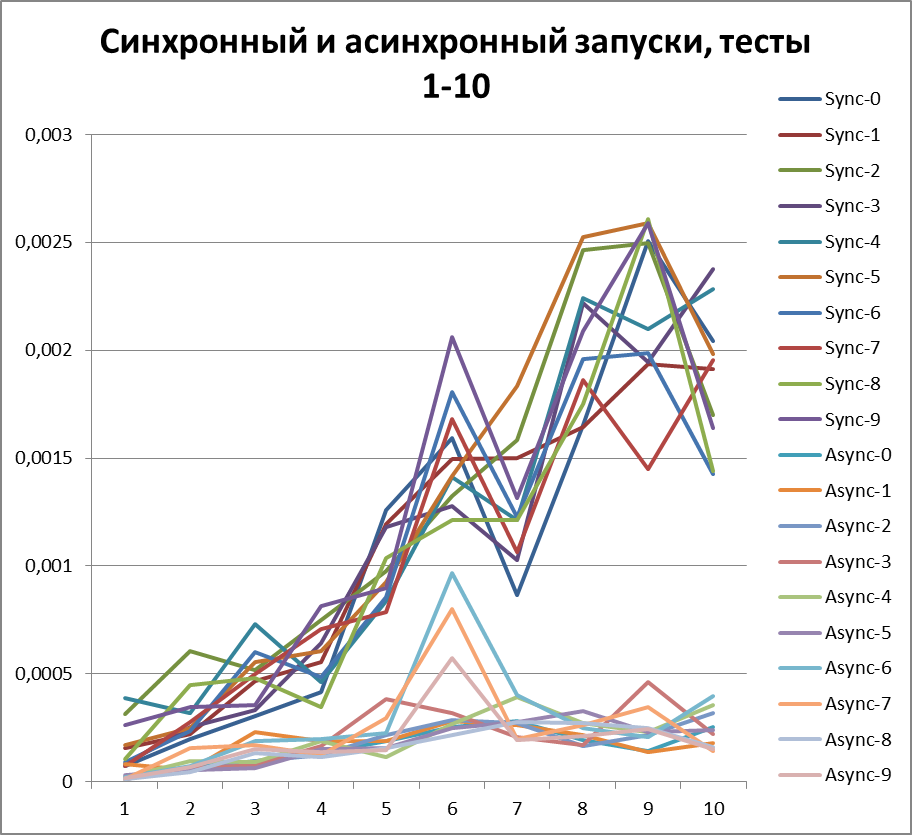
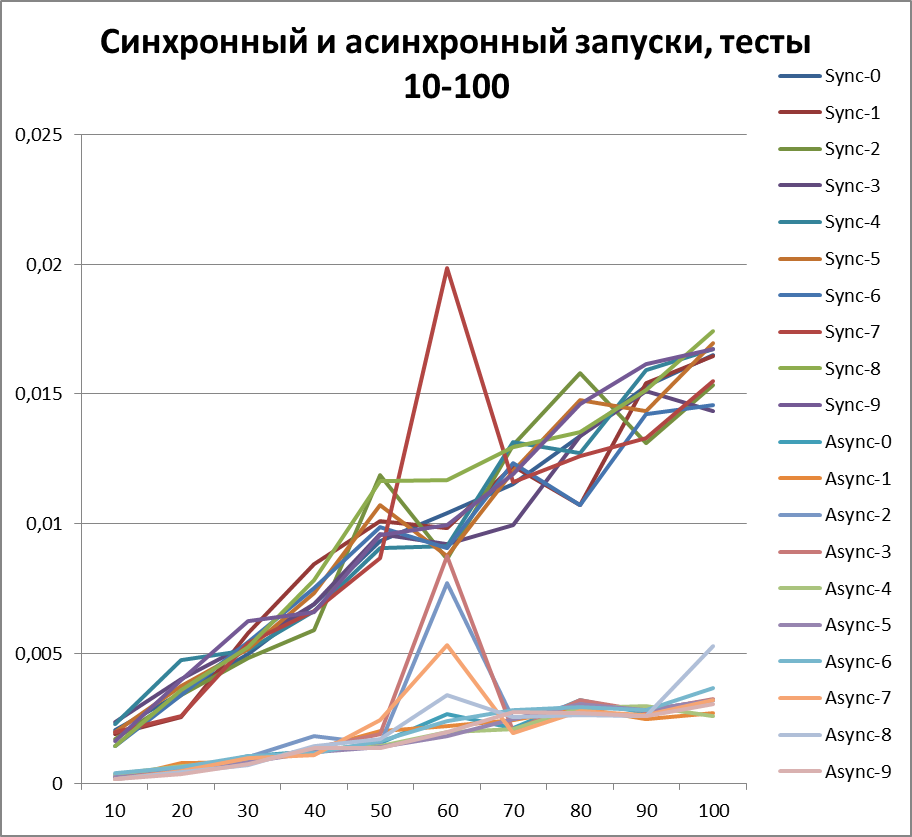
Synchronous start, 2 threads
First, let's see how the logger behaves in a synchronous configuration. Run all the scripts on 2 threads.Here are the results:
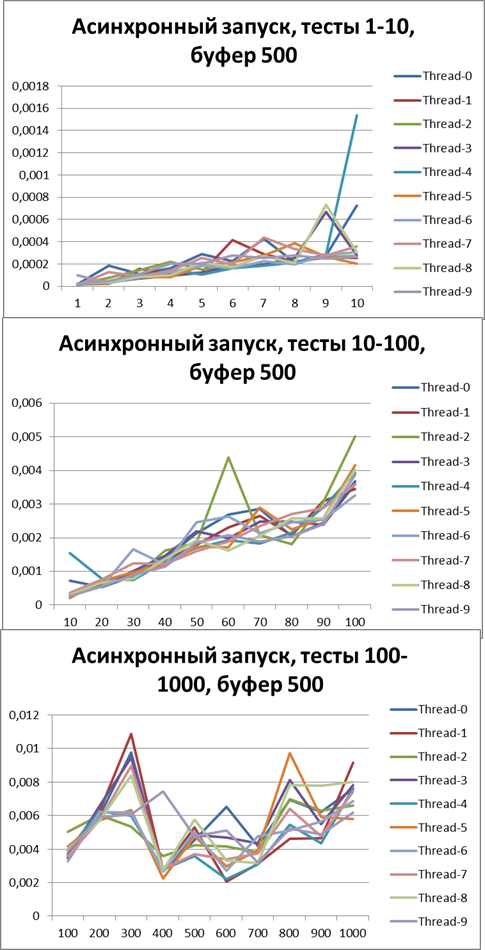
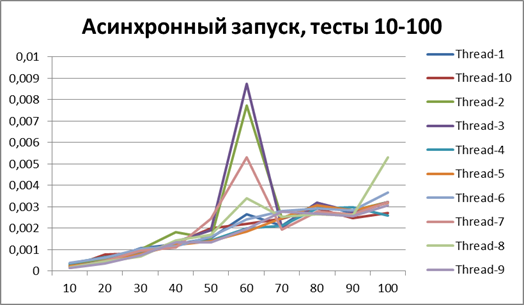
Asynchronous start, 2 threads
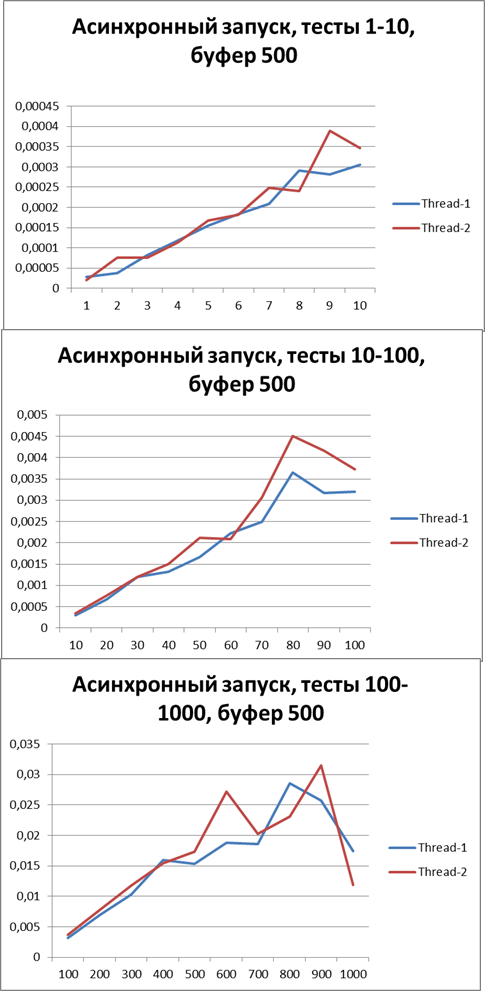
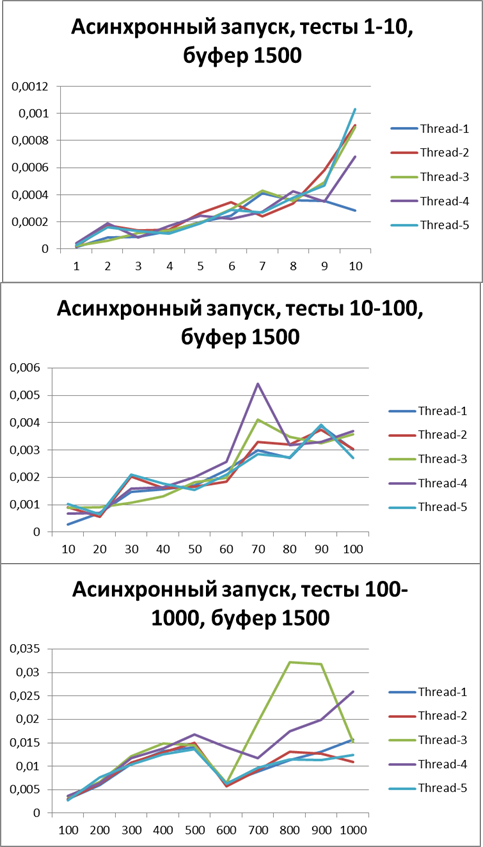
Buffer = 500
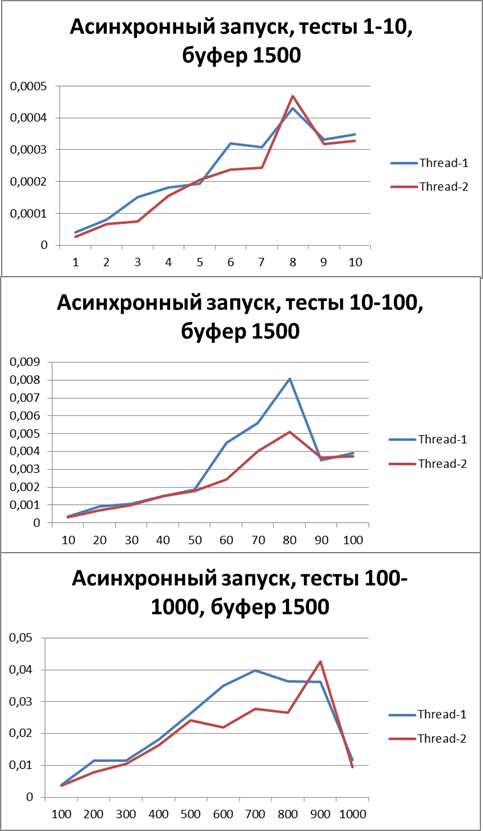
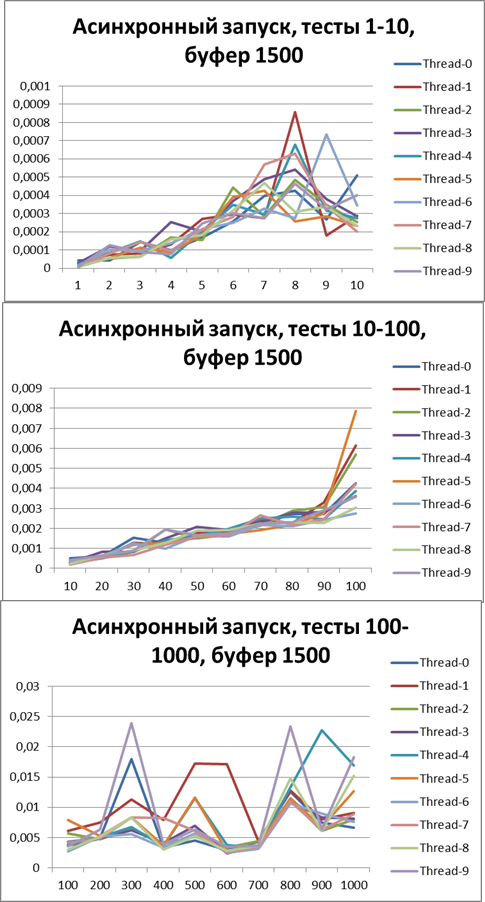
Now switch to asynchronous mode and at the same time try to find the optimal buffer, start with 500Buffer = 1500
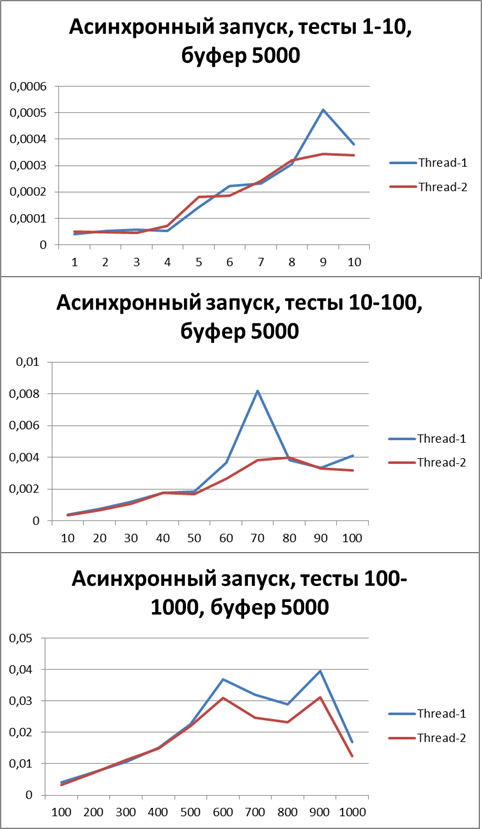
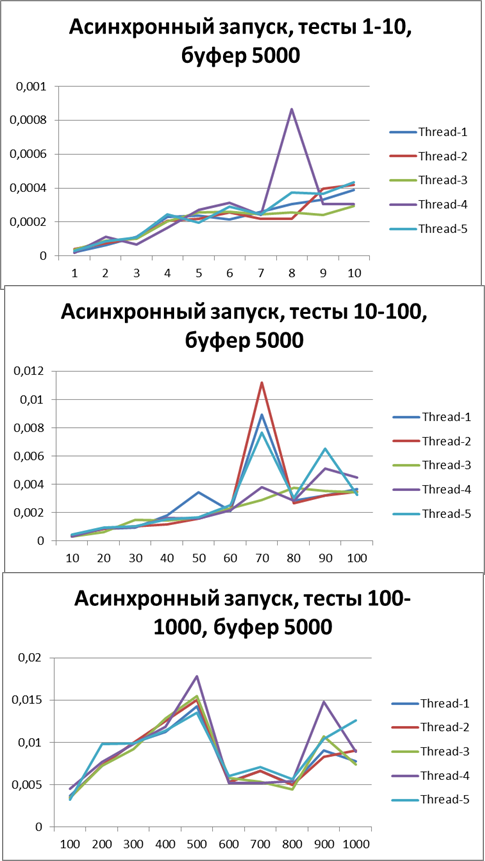
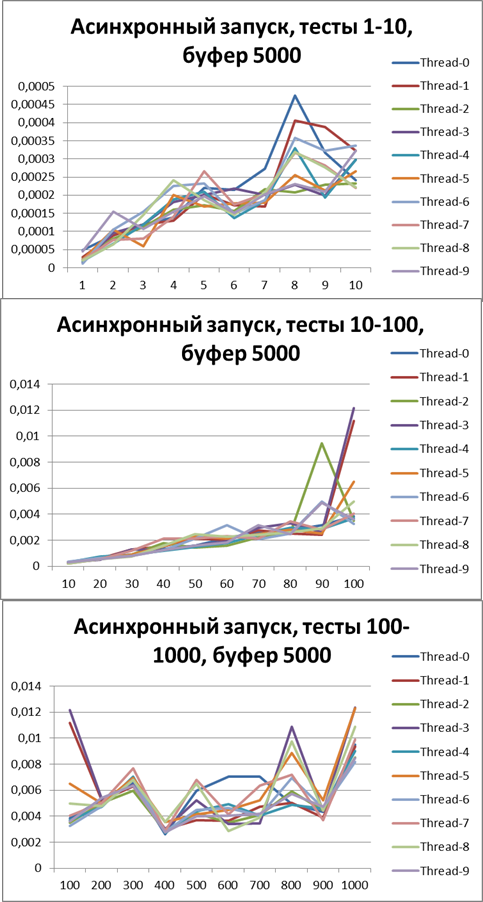
Let's increase the buffer 3 times and carry out the same tests:Buffer = 5000
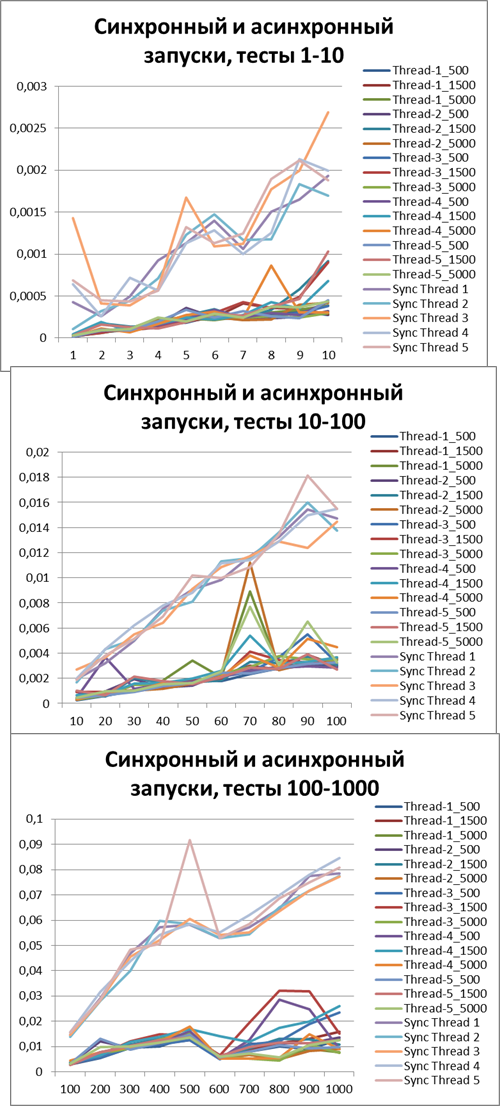
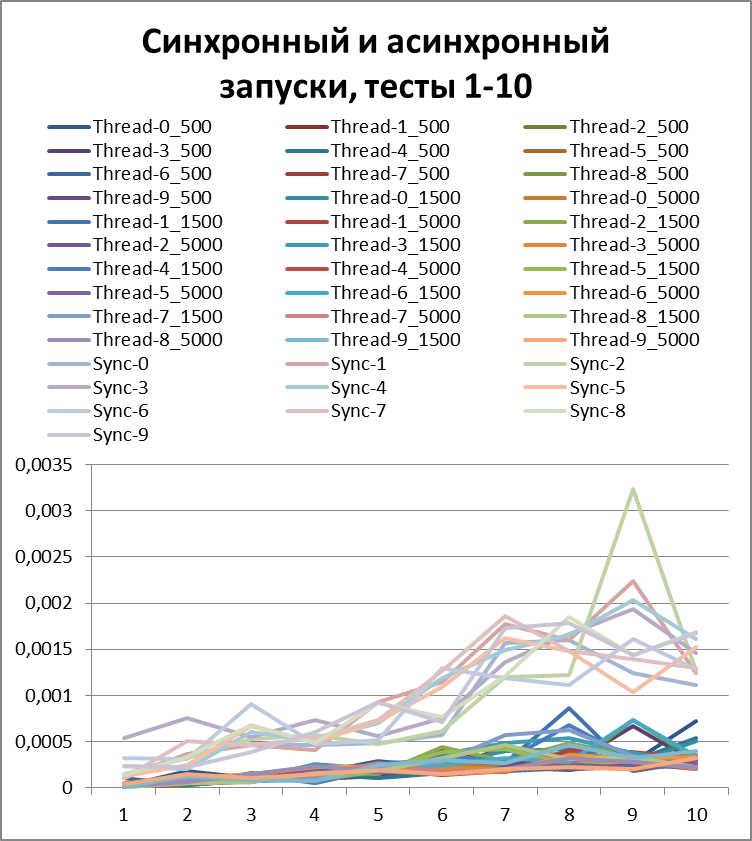
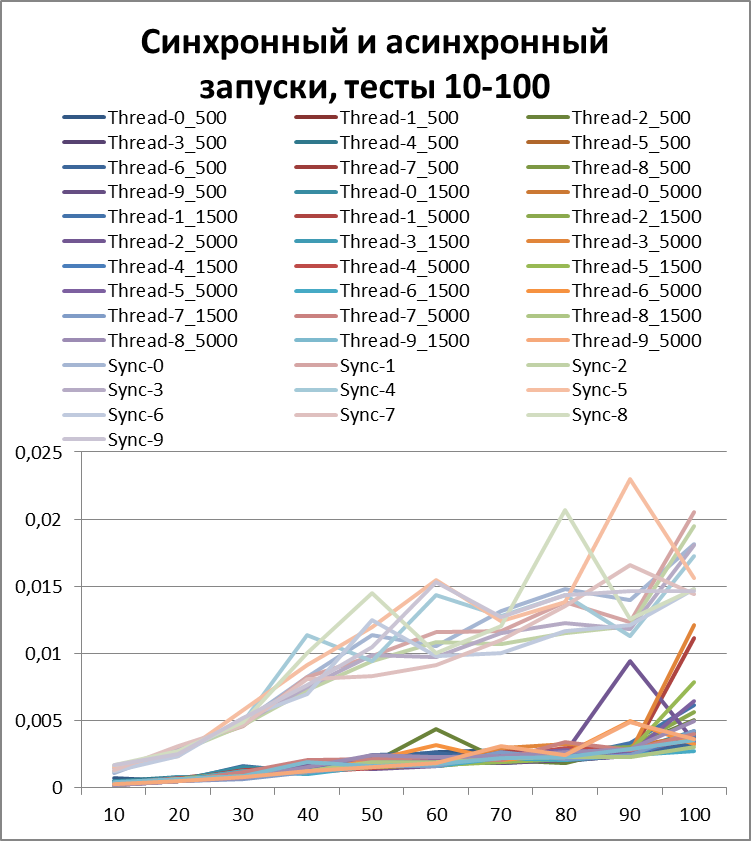
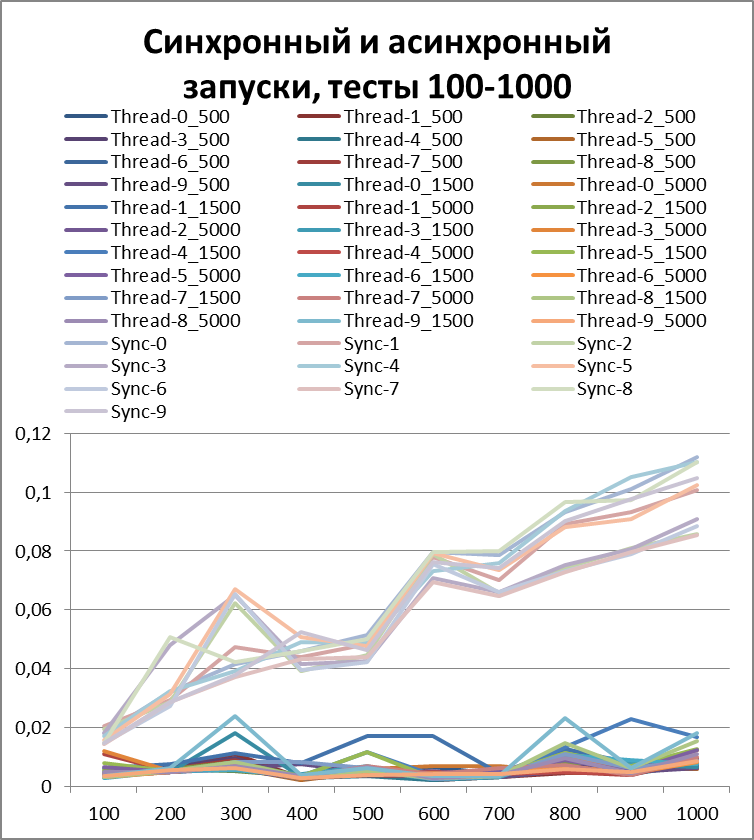
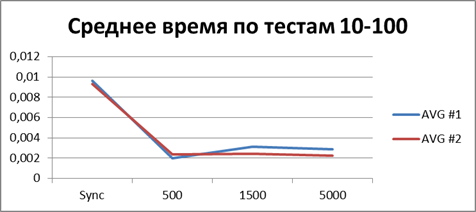
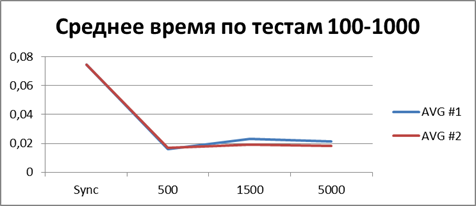
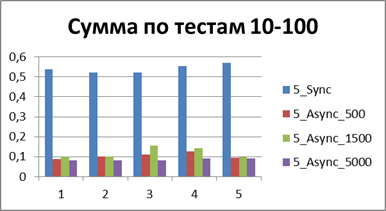
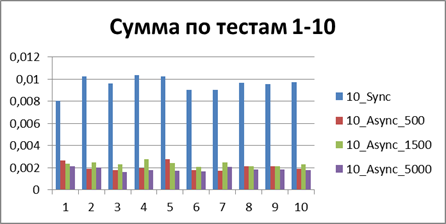
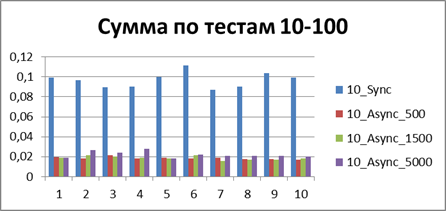
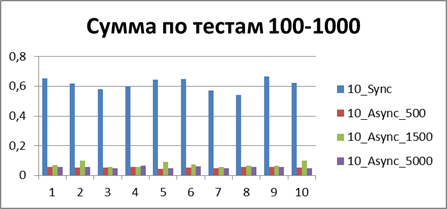
Let's increase the buffer by 10 times and carry out the same tests:Total for 2 threads
Now, for clarity, I will collect all asynchronous (to try to determine the optimal buffer) and synchronous (for clarity, I wonder who won) tests in one diagram:Now I think you can clearly see the acceleration in asynchronous mode.
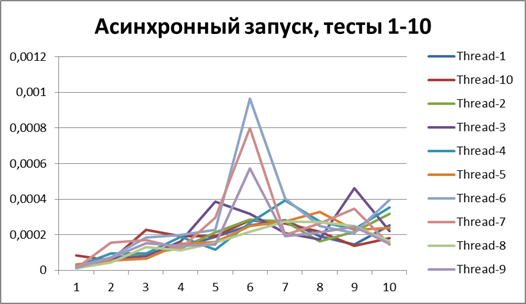
But before drawing conclusions, let's repeat our tests on 5 and 10 threads.
Synchronous start, 5 threads
Asynchronous start, 5 threads
Buffer = 500
Buffer = 1500
Buffer = 5000
Total for 5 threads
Synchronous start, 10 threads
Asynchronous start, 10 threads
Buffer = 500
Buffer = 1500
Buffer = 5000
The result for 10 threads
The conclusion, as they say, on the face.
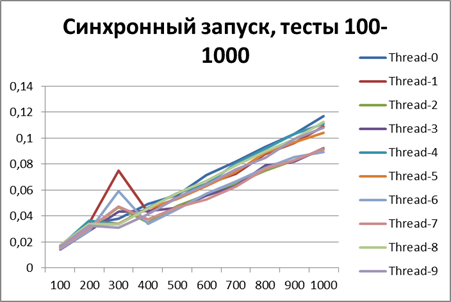
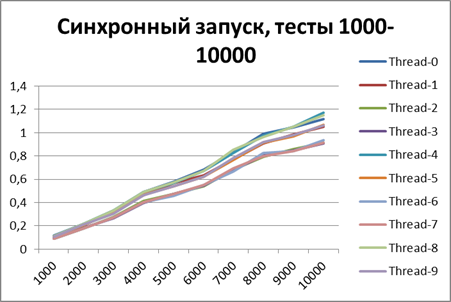
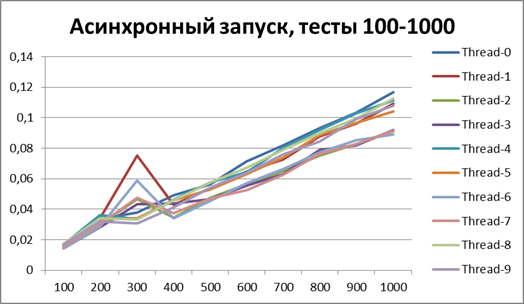
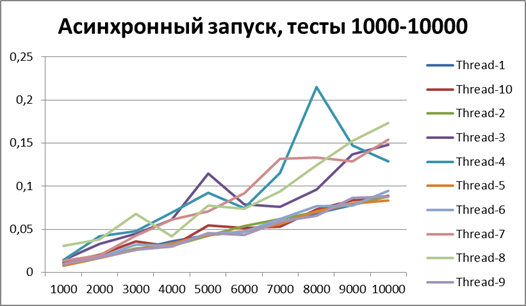
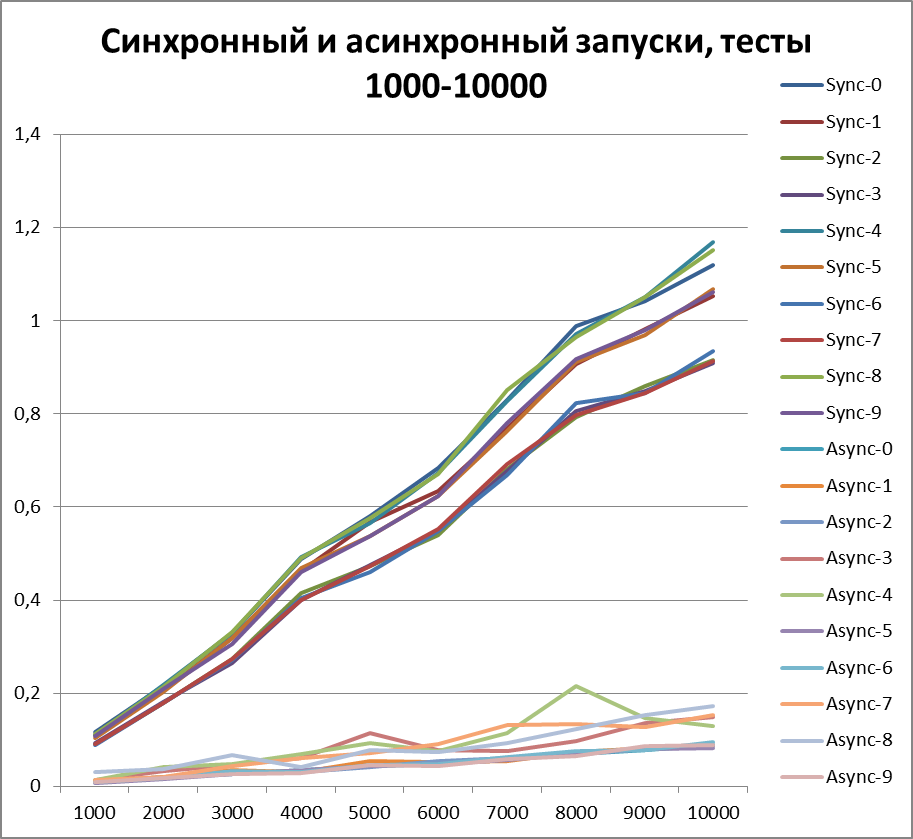
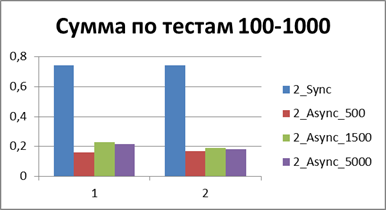
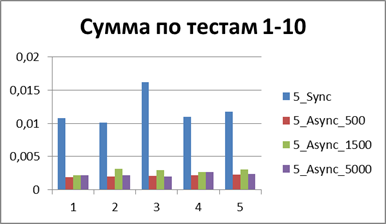
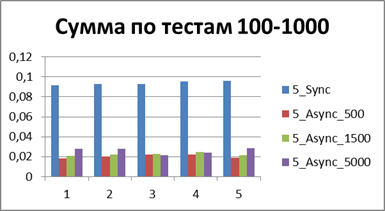
Since now we can definitely talk about the advantage of the asynchronous method of logging, then let's try to increase the volume of tests by another 10 times. Add a test for 55,000 logging events (from 1000 to 10000 in increments of 1000). We take the buffer equal to 500 (since it at first glance, and later it will be proved, is the most optimal in our tests).
Synchronous start, 10 streams on large volumes of data
Asynchronous start, 10 threads on large amounts of data
The result for 10 threads on large amounts of data
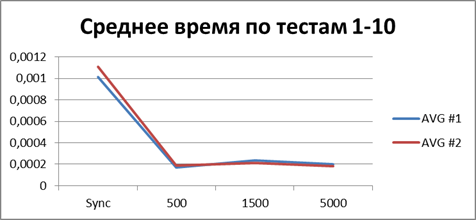
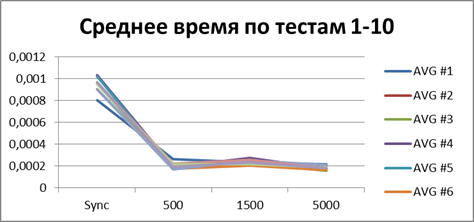
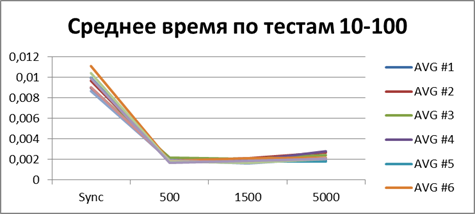
Optimal buffer
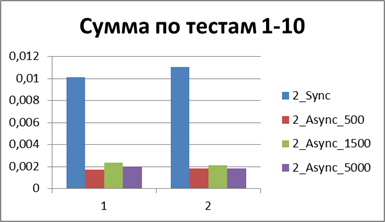
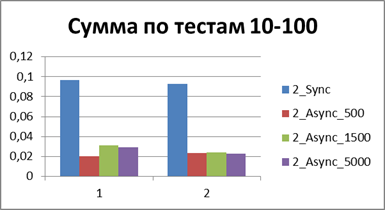
At the moment, we have already accumulated quite a lot of statistics, so let's average them all and see what kind of buffer is most suitable.| 2 Threads | |
   |    |
| 5 Threads | |
   |    |
| 10 Threads | |
   |    |
| 10 Threads, a large volume of tests | |
 | 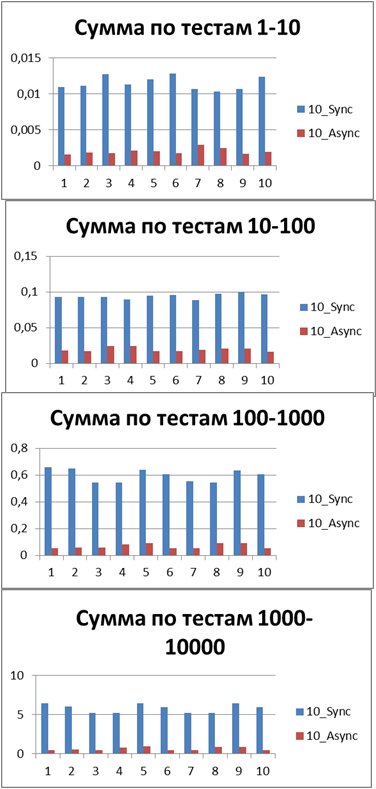 |
Total - 500 events , it is our buffer that allows us to work most efficiently in asynchronous mode.
And now if we even compare the total (or average) runtime of all the tests, then you can get a constant that displays the winning order of the asynchronous mode before the synchronous one, I have it - 8.9 (times) .
Conclusion
The above material makes it clear that the asynchronous logging strategy gives a performance gain. Then the question begs - why not use it always? In order to make a choice in favor of a particular method, you need to imagine the mechanisms that are hidden inside. Below I give a few theses taken from the offsite:
1) AsyncAppender operates with its own thread (while FileAppender itself runs in the context of the current thread), therefore, when using it, it is desirable to increase the limit of application server threads.
2) When using AsyncAppender, memory overhead occurs, since the logging events are not dumped to the file instantly, but by first filling the buffer.
3) The lock of the log file lasts longer than when using the synchronous approach, since the message buffer contains much more information for recording.
In principle, everything is prosaic, but here you need to understand that synchronization itself is also a lock, so it is important to transfer it from one place to another does not make it worse.
Use asynchrony where it is really needed:
- long-playing appenders - SMTP, JDBC
- general resource blocking - FTP, Local File Storage
But first of all, be sure to profile your code.
Excel version of this article:
docs.google.com/spreadsheet/ccc?key=0AkyN15vTZD-ddHV0Y3p4QVUxTXVZRldPcU0tNzNucWc&usp=sharing
docs.google.com/spreadsheet/ccc?key=0AkyN15vTZD-ddVhjdjjdjjdjjdjjjdjjdjjdjjjdjjjdjjdjjjdjjjdjjjdjjjdjjjjdjjjjjjjdj
Thanks for attention. I hope the article will be useful to you.
Have a productive week!
Only registered users can participate in the survey. Please come in.
Do you need a similar article about log4j 2.x?
- 23% Yes, only about log4j 2.x 36
- 60.2% Yes, about log4j 1.x compared to log4j 2.x 94
- 16.6% No 26