Aggregates of multidimensional OLAP cubes in RAM
Staging
The problems of Business Intelligence solutions (Business Analytics) consist in providing interested persons with statistical, analytical information on the results of an automated process or a set of processes.
For example, there is a business process for fixing purchases made by people in an electronic store. In the relational model of the business process, there will naturally be sellers, buyers, goods, and other entities. Moreover, if the business process is successful, i.e. there is a fairly intense flow of data, there is a need for analysis of this data to solve various problems, including economic ones. For financiers, this will be a collection of data reflecting:
- The number of goods sold for the 1st quarter of this year
- The amount of goods sold by sellers for the past year
- Dynamics of sales of a certain type of product in a monthly slice
- And many others
Moreover, if we are talking about a holding, which includes shops, restaurants, and other types of activities, the amount of data increases, which also sometimes leads to an increase in the types of representations of analytical data.
Thus, the developer faces the problem of providing the broadest, most effective and convenient tool for data analysis. OLAP solutions offered by various brands such as Oracle, SAP, Microsoft, MicroStrategy, Pentaho and many others come to the rescue.
I want to make a few reservations in advance:
- The article proposes a method for storing multi-parameter data in RAM without using specialized repositories (DBMS), which are the main for business intelligence solutions (Business Intelligence)
- The article will not discuss OLAP cubes, the principles of their construction in the classical form of MOLAP, ROLAP, HOLAP. For an introductory review of them, I recommend the following articles:
habrahabr.ru/post/66356 - Multidimensional cubes, OLAP and MDX
habrahabr.ru/post/187782 - Starting a Pentaho-based OLAP server using the steps
habrahabr.ru/post/67272 - Create an OLAP cube Part 1
habrahabr.ru/company/eastbanctech/blog/173711 - 6 practical tips for beginners when building a simple BI solution.
Suppose that the solutions offered by brands are not entirely suitable for a specific task (it happens that they are not at all suitable), or the company's budget does not allow the use of a particular brand.
Model design
In view of my activity over the past 3 years, I have been creating business dashboards to provide multi-parameter data to end users using HTML technologies and libraries such as DevExpress, HighCharts, ExtJS. A feature of aggregate storage is intensive data reading and block updating. In the framework of the work, various types of relational data models were tested for storing aggregates, however, none of these types gave the desired effect - high read speed. This led to the solution described in this article - storing all aggregated data in RAM, which entails the following tasks:
- The economical use of RAM
- Effective algorithms for extracting data according to specified criteria
- Storage and reading of data from file storages
First of all, it is necessary to determine the entities with which we will operate:
- An indicator is a named entity defined by quantitative and qualitative characteristics. For example - “income” or “expense”
- A unit of measure is a named entity that defines the measure in which a measure is calculated. For example - “dollar” or “ruble”
- The directory and elements of the directory is a named entity that defines the qualitative characteristics associated with the indicator. For example, the “Sex Guide”, which contains the elements “male” and “female”
- Period - a named entity that defines the time period for which measurements were taken. For example - “year”, “quarter”, “month”, “day”
- Value - a named entity that defines the aggregated value in numerical form
The following examples of data that should be stored in the repository are as follows:
- The indicator "Income" of the enterprise, in the period "2011" in the context of "female" had a value of 300 "dollars"
- The indicator "Consumption" of the enterprise, in the period "1 quarter of 2013" had a value of 100 "rubles"
Having thus defined entities, it is necessary to determine the object model of classes that determines their relationship.
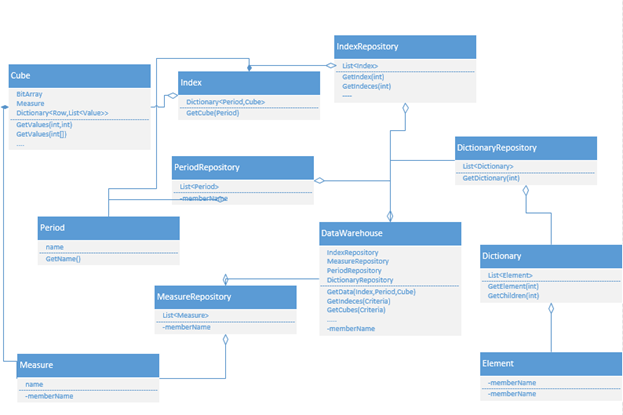
As you can see from the figure, in the class diagram there are utility classes such as ObjectName Repository, DataWarehouse. These classes are convenient to use when working with data collections and it is necessary to define the main interfaces that provide objects according to a given rule.
Index class - describes the essence of the “Indicator”, which includes such characteristics as the name of the indicator, the visibility attributes of the indicator and other attributes necessary for a particular application. The Index class includes the Cube class.
The Cube class is a repository of the qualitative characteristics of indicator values and the values themselves (aka Data Cube). Each set of characteristics is a point at the intersection of all dimensions of the cube. For example - if we have a cube of 3 characteristics, such as, for example, “weight”, “color”, “size”, then each point in this 3-dimensional space will constitute established criteria for each of these dimensions . Any data cube can be represented in the form of a two-dimensional matrix - where the columns of the matrix will contain directories, and the lines are the specified characteristics. For example, row 1 in such a matrix can have the values “Weight - 100 kg”, “Color - red”, “Size - small”. Then, for storing data aggregates, it is necessary to have a matrix describing all possible combinations of characteristics.
- Use one-dimensional data array using offset
- Use a bitmap. In this case, it is proposed to analyze each column of the matrix for its diversity. For example, for the column "Directory of the sexes", you need only three values - "total", "male", "female". Then the maximum amount of data that may occupy a value in this column is only 3 bits. And so for each directory
The Cube class includes the Measure class, which defines a common unit of measure for the entire set of quality characteristics. This allows you to store the values of indicators in various units of measurement depending on the available characteristics. Those. the same indicator in different cubes may have a unit of measure corresponding to the cube. For example, this may be the indicator “Sales of products”, which will be measured in physical terms - “thing” and in monetary “ruble”. This article provides only simple types of indicators, the unit of measurement of which can be only one for one cube. In practice, there are such indicators, the unit of measurement for which varies depending on the quality characteristics in the cube. Then you need to move to a new level of abstractions, and introduce classes,
The Cube class should also include the values themselves - Value sets. Those. each set of characteristics - should and will have values expressed by a number. At this stage, you can apply data classification methods to optimize their storage in RAM. For example, working with a database and choosing a storage or field for a numerical value - in most cases you choose the maximum possible floating point number. However, this is very resource intensive, especially when it comes to RAM. In practice, not all indicators need such accuracy. For example - the indicator "Percentage of the plan", may need only integer values from 0 to 100. For which one byte is enough. Thus, it is possible to implement a preliminary analysis of the data for each indicator to determine the maximum required type - from BYTE to DECIMAL. Then you can go to the level of abstractions Value - and generate everything from this class, all the necessary types for implementing the application. In practice, this analytics yielded significant data compression, for example, when the value in the database was 100 million, only 5% of them required the DECIMAL data type.
In this case, when modeling such a storage, it is necessary to implement methods for saving all data to the hard disk and reading them. I strongly recommend that you avoid standard serialization and write your own based on BinaryWriter and BinaryReader. And I also recommend intensively using MemoryStream classes. Those. The processes of reading and writing to the hard drive are divided into several stages:
- Reading to a stream in memory
- Stream compression with standard algorithms
- Record Stream to Hard Disk
And vice versa:
- Read from hard disk to memory stream
- Flow decompression
- Reading data
This approach makes it possible to optimize the process of compressing and reading data using several cores of the central processor without loading the hard drive. Those. reading and writing from the hard drive is performed sequentially, and reading and writing from streams in memory can be parallelized. So, in practice, reading 100 million values from a hard disk (approximately 2 GB of compressed data), and decompressing them in memory and generating classes (up to 35 GB) takes about 5 minutes using a 32-core Xeon server. The extraction of similar data from a relational DBMS took about 5 days.
This article does not discuss options for updating data in such a repository. But with the main task of the repository, such as reading data, this model copes 100%. To update data in such a storage, it is necessary to provide exclusive access to memory modes. And also, in order to develop the system in view of the technical limitations on RAM, it is necessary to develop the system to distributed RAM (Sharding).
This article assumes that the data aggregation procedure takes place in the external environment and that aggregates already enter the system.
This article also does not show application codes in view of their triviality, especially in view of the use of LINQ technology, where in most cases there are operations of comparing the characteristics for the similarity of objects or their differences.
Conclusion
For all the beauty and versatility of relational databases, there are tasks that cannot be solved using pre-prepared templates. On the example of aggregate data storages - an alternative approach to designing BI systems is shown. And as you can see - this approach is guaranteed to virtually eliminate the process of reading data from hard drives during intensive extraction, which is the bottleneck of any information system. Having excluded the process of reading from the hard drive, we solve the main problem of limiting the speed of access to data given by the technical capabilities of the hard drives.
In fact, when working with aggregate storage data, a limited set of functions arises that must be implemented, for example, as:
- Get the values for the "indicator" in the given "characteristics" for the given type of "period"
- Get “residuals” (that is, all remaining available characteristics by indicator) by cube when a part of “characteristics” is defined
- Combine data from multiple indicators
- Search for indicators by given characteristics
The data outputs in most cases are filled matrices according to the given criteria, which are the same RecordSets and DataTable s obtained from relational databases.