How I made an optimizer tester to find profitable strategies on the exchange
- Tutorial
- Recovery mode
Introduction
In algorithmic trading, when creating mechanical trading systems (MTS), the question of the lifetime of trading algorithms is very important. Yes, and in principle it is quite difficult to find them. In an ever-changing market, sooner or later there comes a moment when even the most advanced and profitable algorithm starts to bring losses. And it is necessary, as they say, to “tighten up” or optimize it under the current market conditions. One of the most common are trading systems (TS) that work with candlestick charts with their variety of indicators for technical analysis.
To build strategies based on indicators, various parameters are used, such as timeframes, periods, parameter weights, etc.And if several different indicators are used in the trading strategy at once, then the number of input parameters for the same strategy increases by an order of magnitude and it becomes quite difficult to choose the most optimal values for the current market.
To solve these problems, there are various optimizer testers.
Strategy Optimization Methods
The most obvious solution seems to be to take all the possible strategies, test them by sorting on historical data and select the most profitable ones. But when the number of modifiable parameters becomes more than two, three, and the number of possible strategy options in the ranges of these parameters begins to number in the thousands and tens of thousands, then the enumeration method becomes sometimes simply impossible because of the length of such testing.
There are ready-made strategy optimizers in other software products such as Wealth-Lab , AmiBroker. But they use their own scripting languages and, as a rule, there are some other restrictions, and it is not possible to test the strategies completely. How to translate your strategies into them? Can this tester all we need? Will the tests reflect reality? And many other questions arise when you start to study this topic in more detail.
Moreover, these are “black boxes” and no one knows how they actually do the calculations. And when it comes to money, there should be no place for any accidents and uncertainties. “On the word” I do not believe the creators of such software. How many times have I come across all sorts of glitches and bugs, letters and technical support calls in the most serious products. At the same time, we become dependent on completely unnecessary people. In general, I have no confidence in them. All these problems greatly slow down the implementation of algorithms, and accordingly take our time and money.
And I asked myself: “Why not write your own optimizer? Is it really that hard? ” It turned out to be difficult, but quite real. In addition, there is confidence in the results and freedom in the settings and upgrades and modifications of the program. Actually with these thoughts I got to work.
Based on stochastic optimization. Stochastic optimization is a class of optimization algorithms that uses randomness in the process of finding the optimum. Stochastic optimization algorithms are used if the objective function is complex, multi-extreme, with discontinuities, with noise, etc. Moreover, they allow one to study only a part of the range of strategy options and, based on the data obtained, make an idea of space as a whole.
I got acquainted with the main applied stochastic optimization methods - genetics, Monte Carlo, a swarm of particles, their varieties and other methods. In general, there are a lot of varieties of stochastic methods. For example, the “Swarm of Particles” method or the so popular “Genetic Algorithms” . There are also elegant solutions such as the "Simulated Annealing" algorithm (a beautiful GIF on the right, I advise you to look).
The latter method, for example, with a high degree guarantees finding a global extremum. Since with this method he periodically deviates from the path and additionally studies neighboring areas. But the research speed is not the highest. The essence of the methods is the same - we select random values and somehow analyze them. Only two parameters change from method to method - the speed and accuracy of the study. And inversely proportional. The higher the testing speed, the worse the quality of the results and vice versa. When choosing a method, everyone decides for himself what he is willing to sacrifice.
Search for extremes
For example, the method of "Simulated Annealing" allows you to find a global extremum. However, if you think about it, then the global extremum itself is useless to us if there is no convergence to it. That is, if the neighbors around the extremum conditionally do not decrease uniformly, then it is very likely that this global extremum is random and we will not benefit from it because it is inadequate, and it will ruin our calculations. Therefore, it is so important to study the parameters around the extremum. If there is convergence, then there is a system and this strategy can be studied further.
All stochastic optimization methods have one common drawback - they can run into some local extremum, and miss the very optimal one. To avoid this, it is necessary to maximize the areas of samples and the number of iterations. But the speed of calculations suffers from this. So you should always look for a middle ground.
Due to the complexity and non-obviousness of the calculations, I set aside the methods of "Simulated Annealing" and other "Swarms of Particles". As a result, I came to the conclusion that the most affordable and convenient way in my case is Monte Carlo optimization.
The first version of the tester-optimizer "Monte Carlo"
Classic maximum search
I decided to take the logic from the article “Nonlinear stochastic optimization by the Monte Carlo method” from the collection of St. Petersburg State University as the basis for my first optimizer tester . Who is interested in this direction, I advise you to read their collections. A lot of interesting versatile articles about optimization in various fields. Where these stochastic methods just do not apply!
So here. The essence of the method is that we create a multidimensional matrix consisting of varieties of strategies with different parameters. We randomly select strategies from this matrix, test them and determine the most profitable strategy. For the criterion of profitability, so far I have taken the expectation. And so you can make a complex parameter. We take a point from this strategy in the matrix as the epicenter and cut the edges of the matrix as far as possible from the epicenter to the depth we set. Thus, we reduce the sample area and test random strategies from the resulting reduced area in a new way, repeat the iteration. So continue until we converge to the extreme.
There are many ways to determine the magnitude of the reduction in the sample area. Statistical, where they study the change in the gradient of the objective function or empirical, where they look at how quickly the extremum itself changes from iteration to iteration. And on the basis of these data they decide whether to continue the investigation further or to stop the iteration, and accept that we have already found the maximum with a given error. The so-called stopping criterion.
But as I already noted above, it is important to study the area around the extremum, and therefore, I decided to converge to the end, and at the last iteration, check all the neighboring strategies completely. I didn’t get smart with gradients and made the convergence static as a percentage of the initial sample. That is, how much to cut the multidimensional matrix after each iteration by 1% or 20%, we decide at the very beginning. Also, immediately, taking into account our time capabilities, we decide how many strategies we will take from the matrix at each iteration for testing. Thus, the size of the matrix is not important to us at all, we know exactly how many iterations and in what volume we will carry out! This is the beauty of stochastic methods.
Based on the foregoing, I wrote a program to search for the best parameters of strategies.
Initial data for optimization:
- test trading instrument
- range of history
- candlestick timeframes (at least everything, from 5 seconds to several hours),
- ranges of considered strategy parameters,
- step in these ranges,
- percentage reduction in the sample area after iteration,
- the number of elements in the sample,
- The number of strategies sent for testing.
Console testers (I have several of them, completely load the processor) receive the parameters of the strategies as input, test them and save the results in binary files at the end. This is done for the intermediate storage of test data in case of an error, as well as protection against memory leaks and other glitches. And in general, diversification of the risk of failure of something. The program itself transfers all the data, shares the load so that the testers work at the same time at full power and at the end of one, the other starts immediately. I suffered for a long time how to synchronize everything, but everything turned out autonomously, quickly and conveniently!
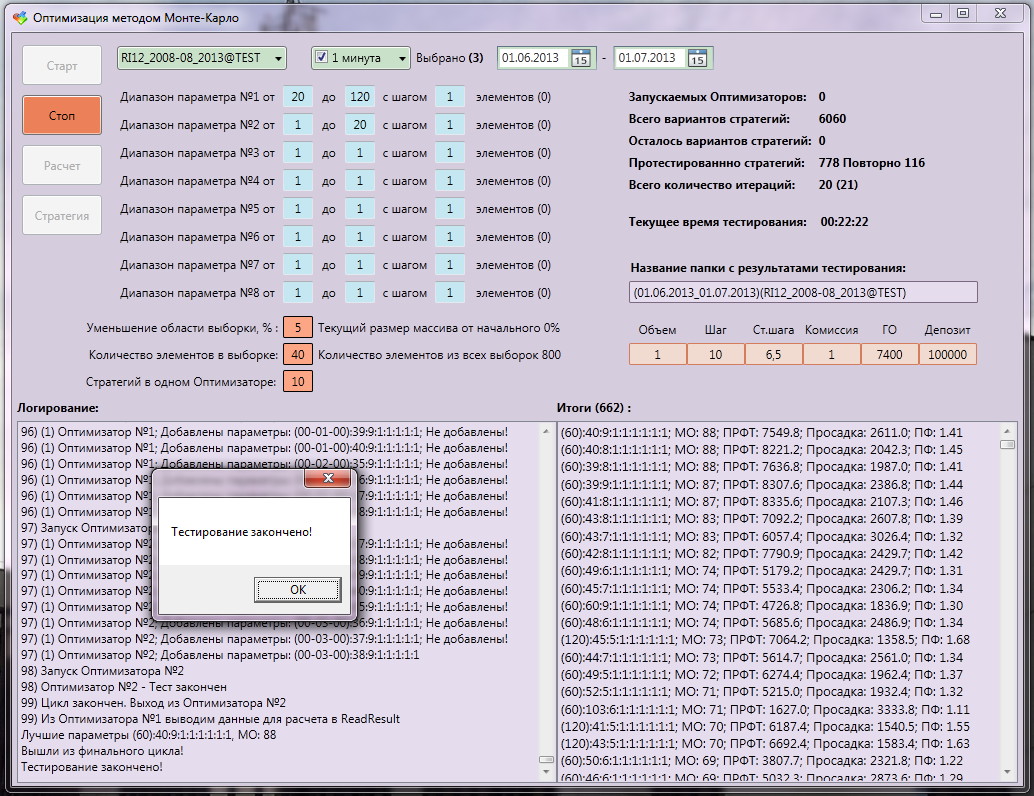
In this case, all parameters and results are displayed on the main window of the Monte Carlo program. So, everything that happens there is visible and understandable. There is a logging window and a window with the results of testing. After each iteration, the program opens the serialized files, calculates statistics on them, sorts and displays on the screen.
Monte Carlo Optimizer Tester Interface:
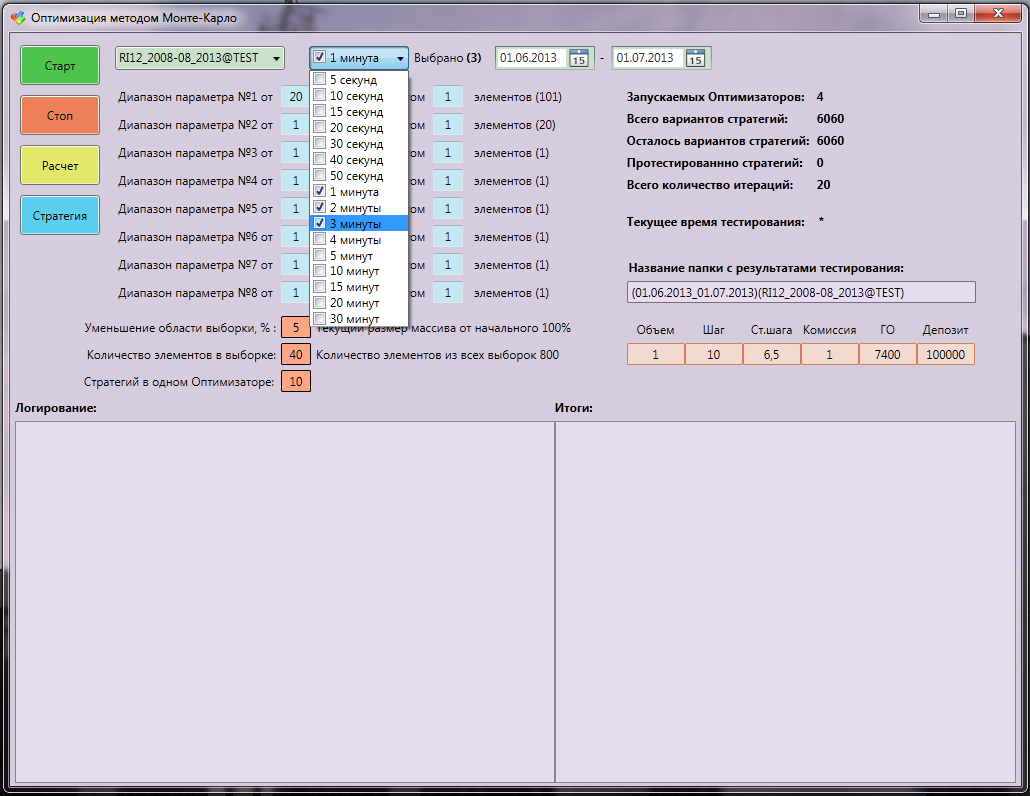
In:
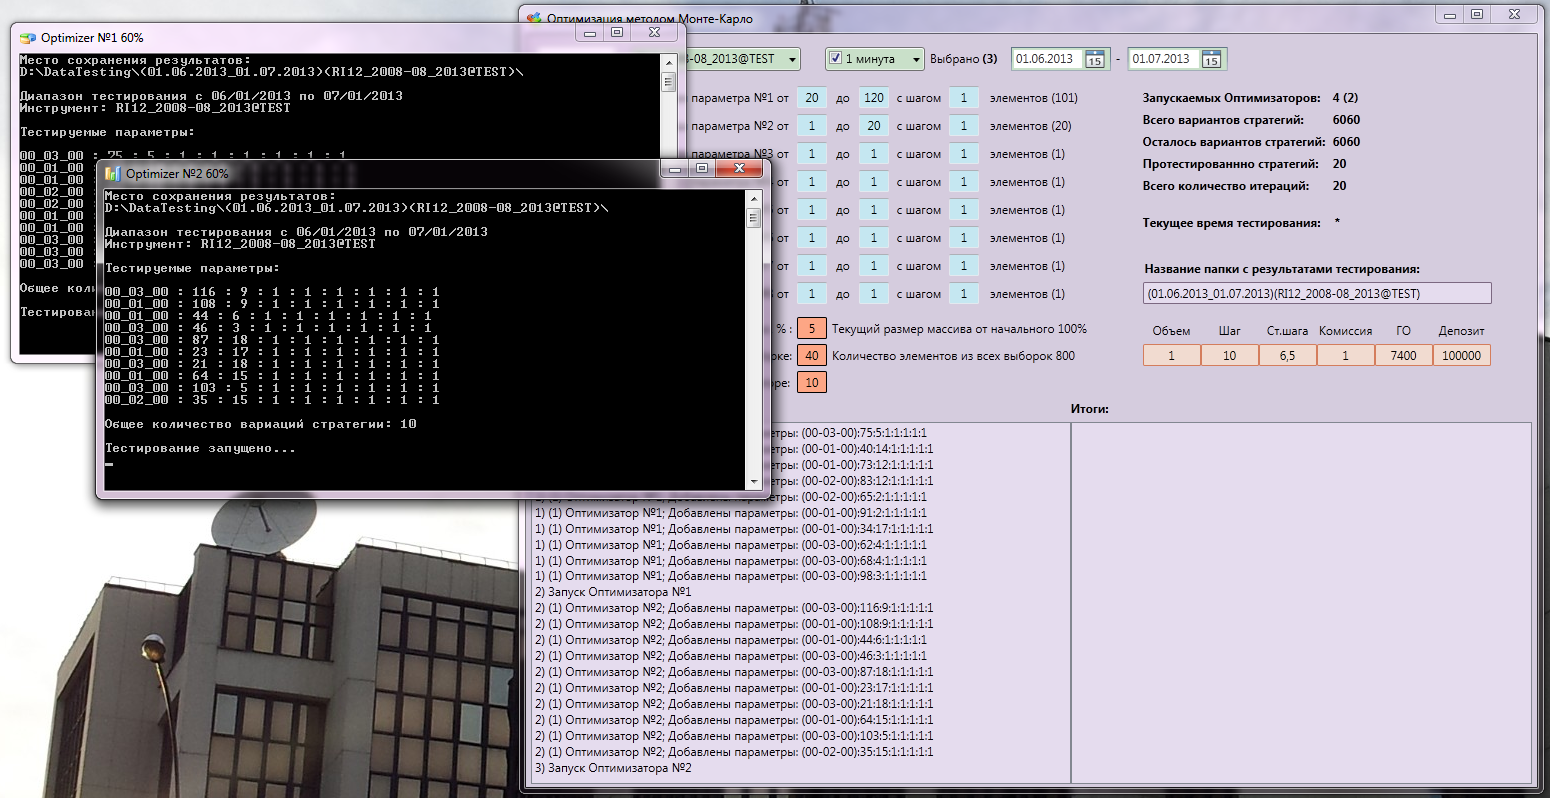
End, testing. The best result was with an expectation of 88%. Moreover, out of 6060 options, only 778 were tested, of which 116 were repeated.
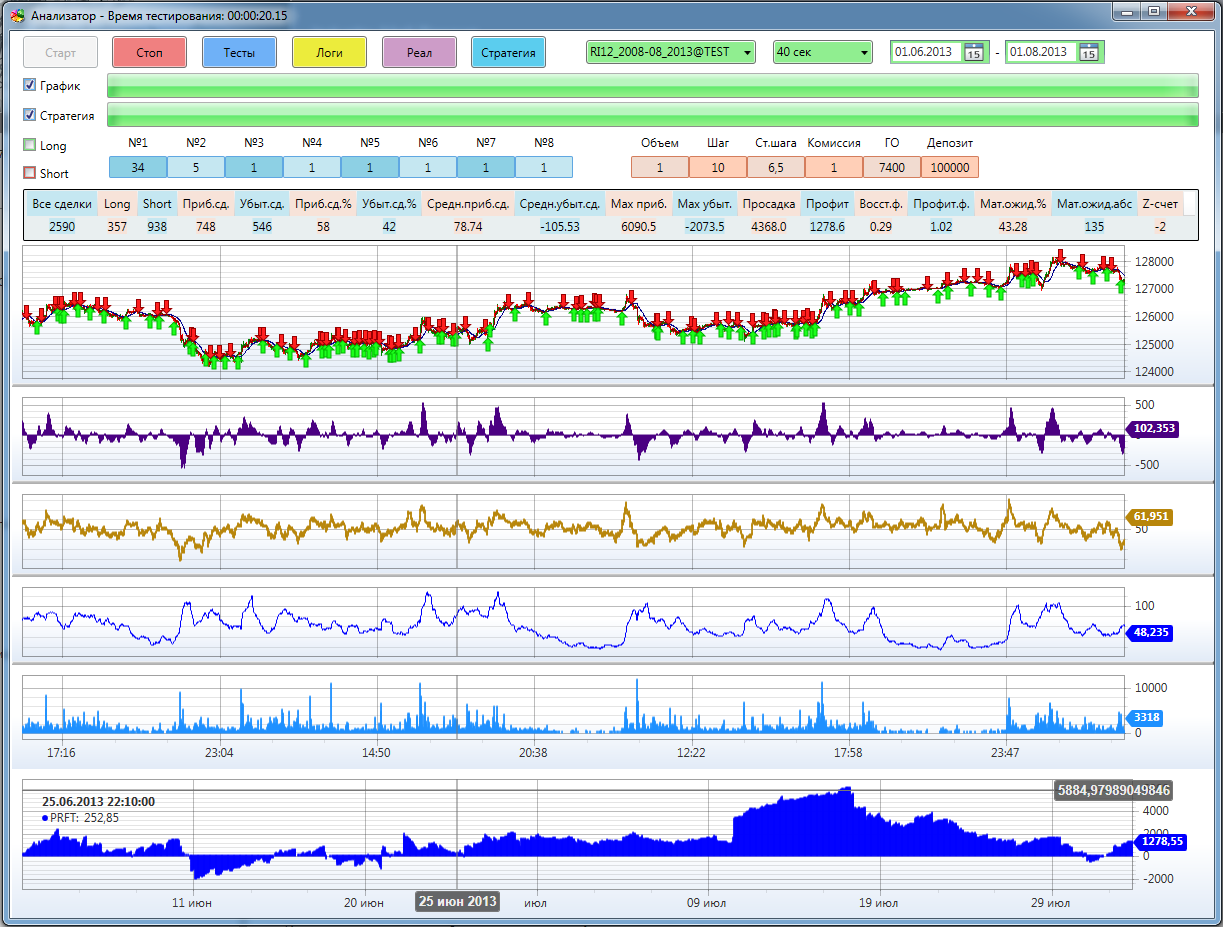
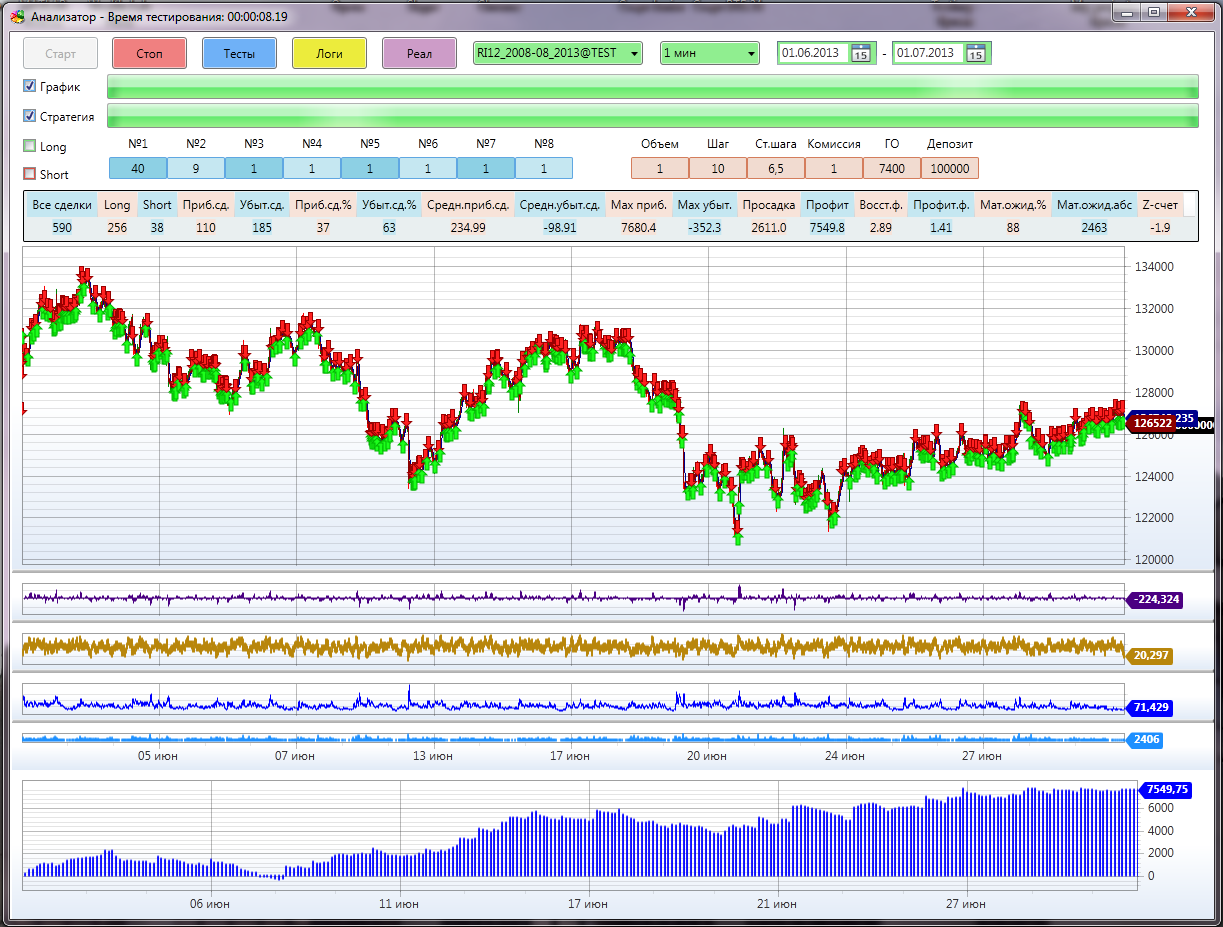
Strategies before testing are checked to see if they have been tested before, because towards the extreme, the density increases and at the end the area around the maximum is completely covered. And we will not test the same thing again. All test results are processed without problems by the program for visualization of the Analyzer strategies. You can always manually correct GO (guaranteed security), commission, or change the starting deposit:
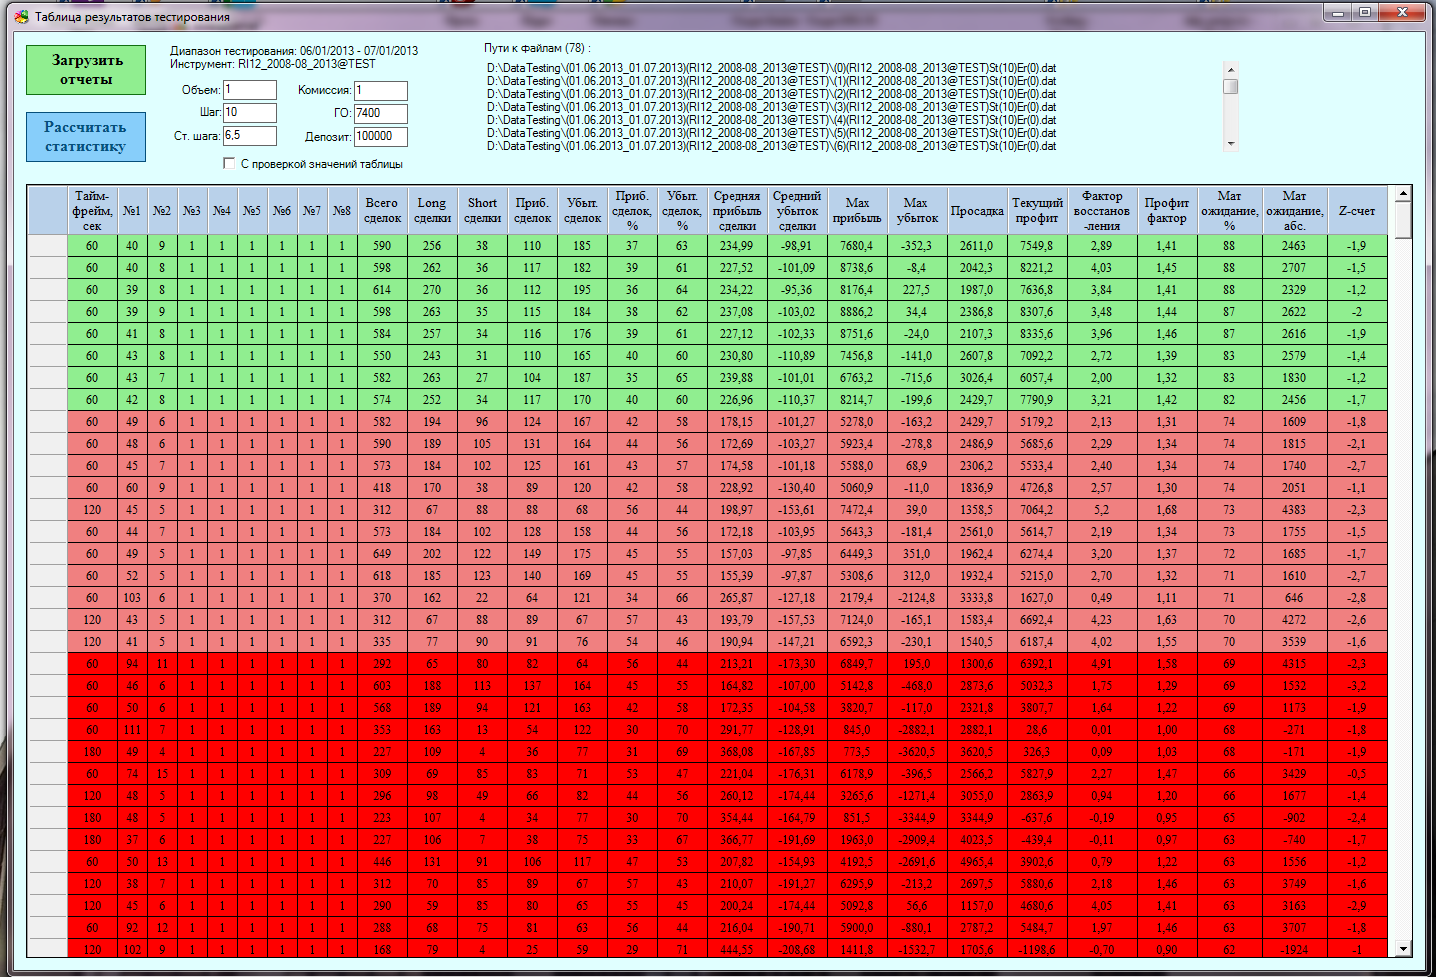
A large statistical table is displayed in the window of test results for all test and optimization results. Any parameter can be sorted by column. When you double-click on any line, all parameters go to the visualization window, so you don’t need to hammer anything into the cells (I’m not overjoyed myself)!
Test Results Window:
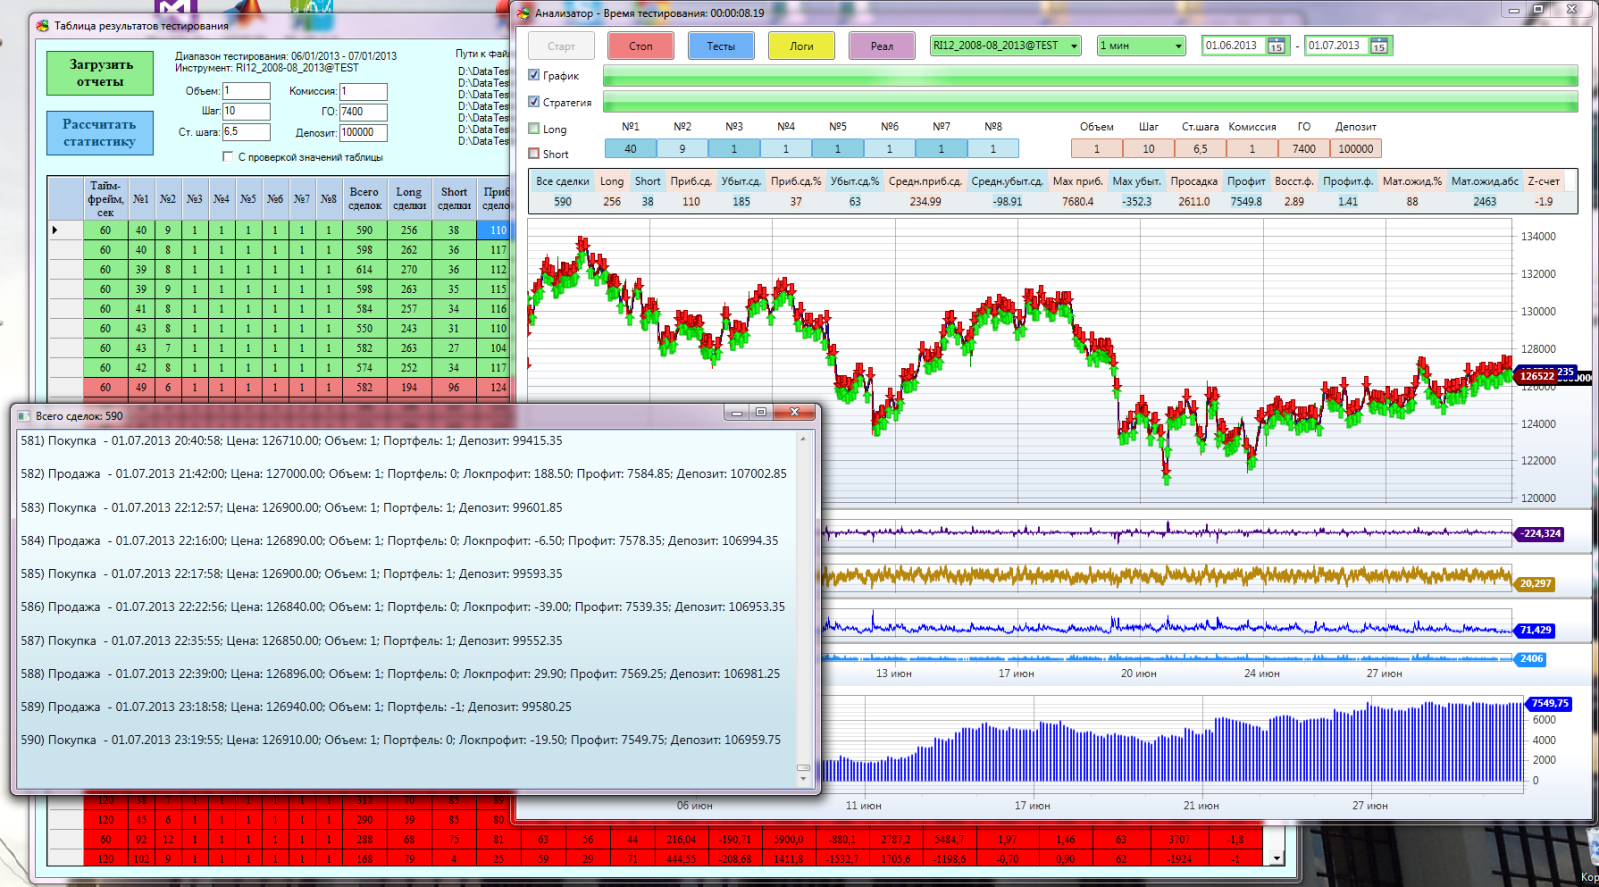
All Together:
However, after implementing the first Monte Carlo optimizer tester and examining its work, I came to the conclusion that he was fulfilling his task, but not in the quality I wanted. In the classical optimization methods, in each new iteration, the best value is sought and further research is already being carried out around it. In my case, I cut off the matrix of strategy options regarding it.
The conditional scheme of the stochastic maximum search algorithm by the Monte Carlo method:
Advanced algorithm
After the first iteration, when we carried out the most first exploration of space, we must somehow reduce the area of research for the next sample. But so far we know almost nothing about this space and, it seems to me, it is rather reckless to cut off unknown areas. In general, the algorithm is designed to search for a global maximum, and we are interested in all local and global maximums.
We need to know all the parameters where a strategy can be profitable. Perhaps the strategy with some parameters brings good profit, but more risky, and with other parameters it makes a little less profit, but it turns out to be more stable and less risky, and if we follow our algorithm, we can lose sight of it. At the same time, we cannot investigate space in great detail, and it’s quite costly to do a exhaustive search.
What to do in this case? I decided to move away from the classical scheme and act as in trading: "You can’t control your profit, you can only control your risks." Therefore, I decided not to take risks and take measures so as not to accidentally remove a good strategy from the study.
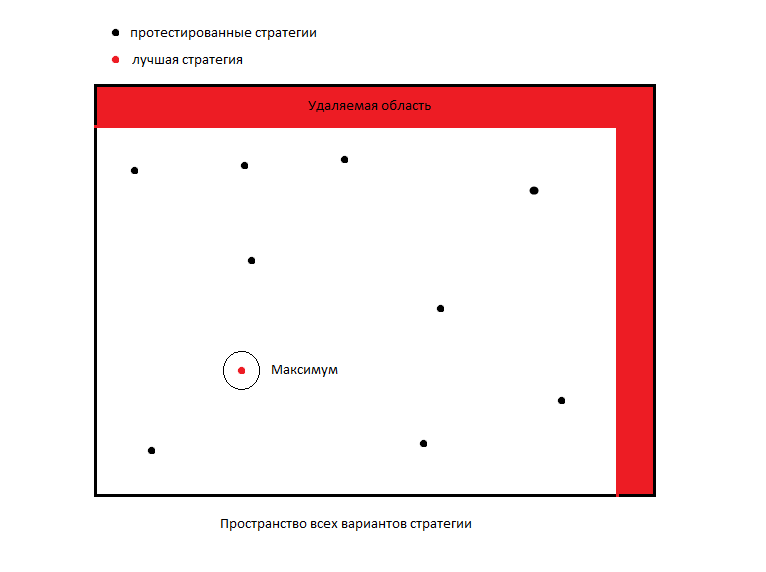
How then to crop the matrix? We will cut only those areas that have been investigated! That is, we will remove micro areas around the worst investigated strategies. The essence of the algorithm is that we do not explore the good areas of strategies, we do not explore the bad. And we can additionally research the best strategies at the end of optimization.
The operation of such an algorithm is shown here:
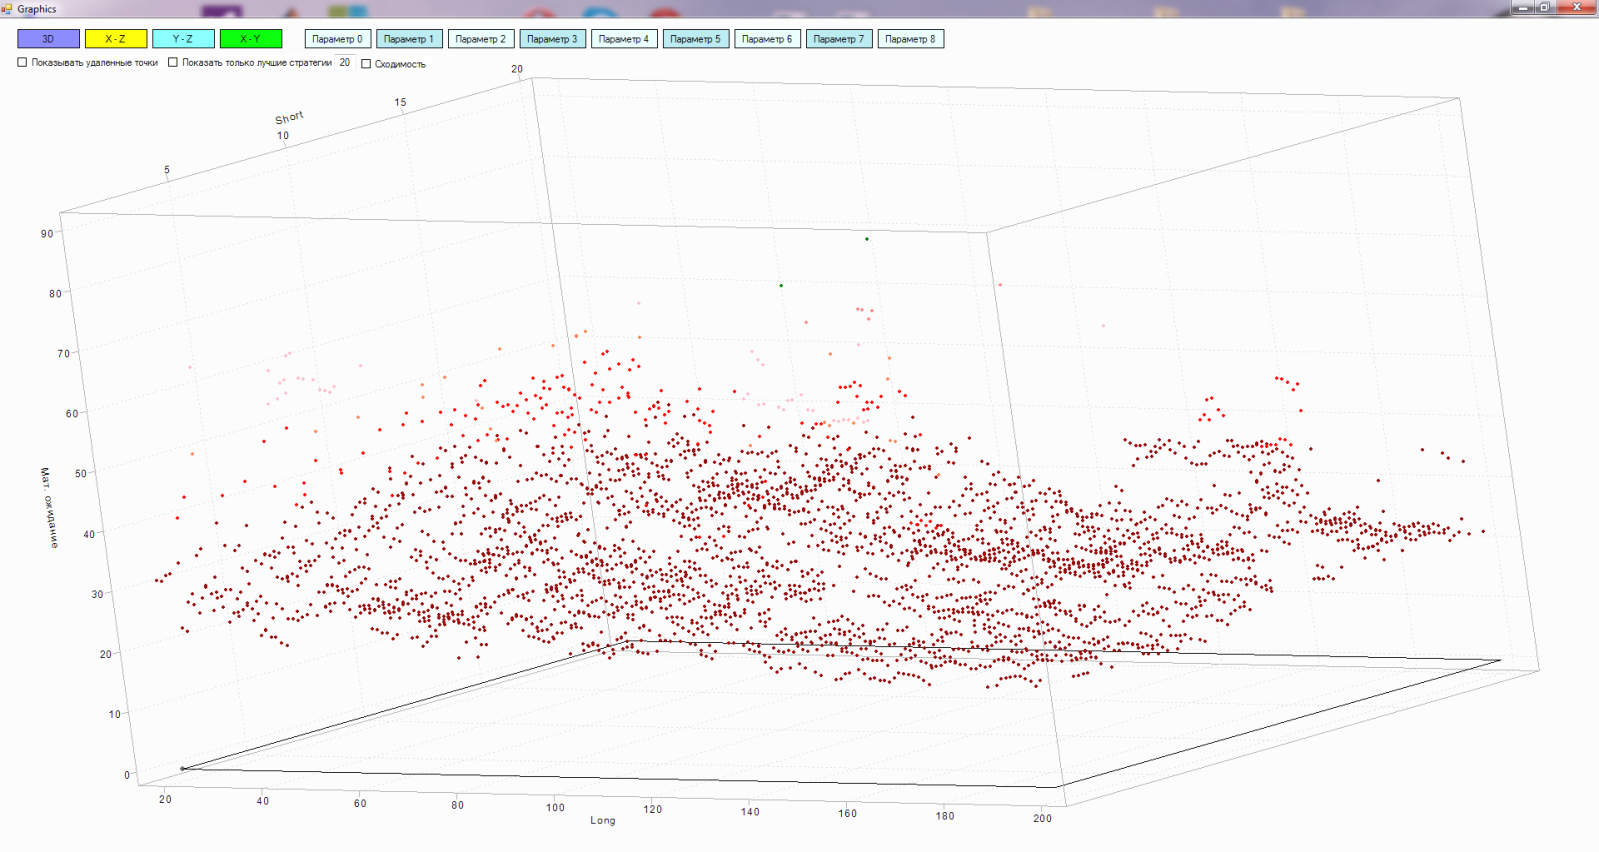
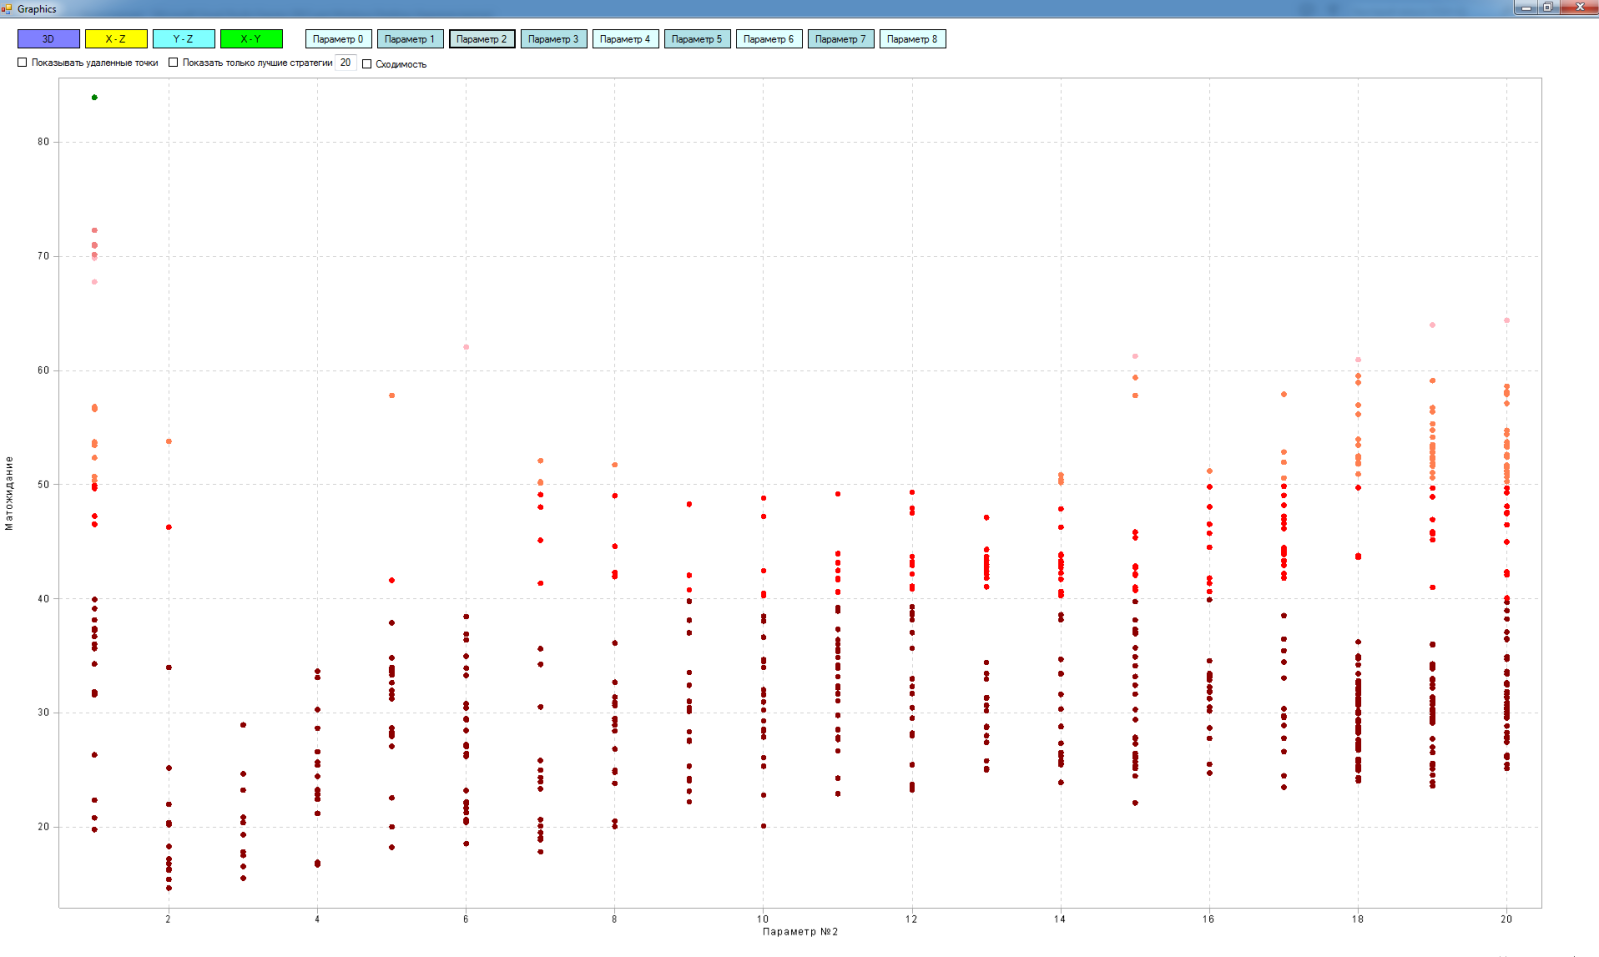
In fact, the matrix is multidimensional (in my case, a maximum of 9 dimensions), but to explain the principle of operation, we will use all three of our favorite dimensions:
- X axis - parameters of the "long" moving average
- Y axis - parameters of the "short" moving average
- The Z axis is the result of testing the strategy of intersecting the “short” and “long” moving averages, in this case I took the expectation mat
Points in this space are already tested versions of strategies with different values of “long” and “short” moving. The lighter the point, the better its expectation.
In principle, this could be depicted in two coordinates:
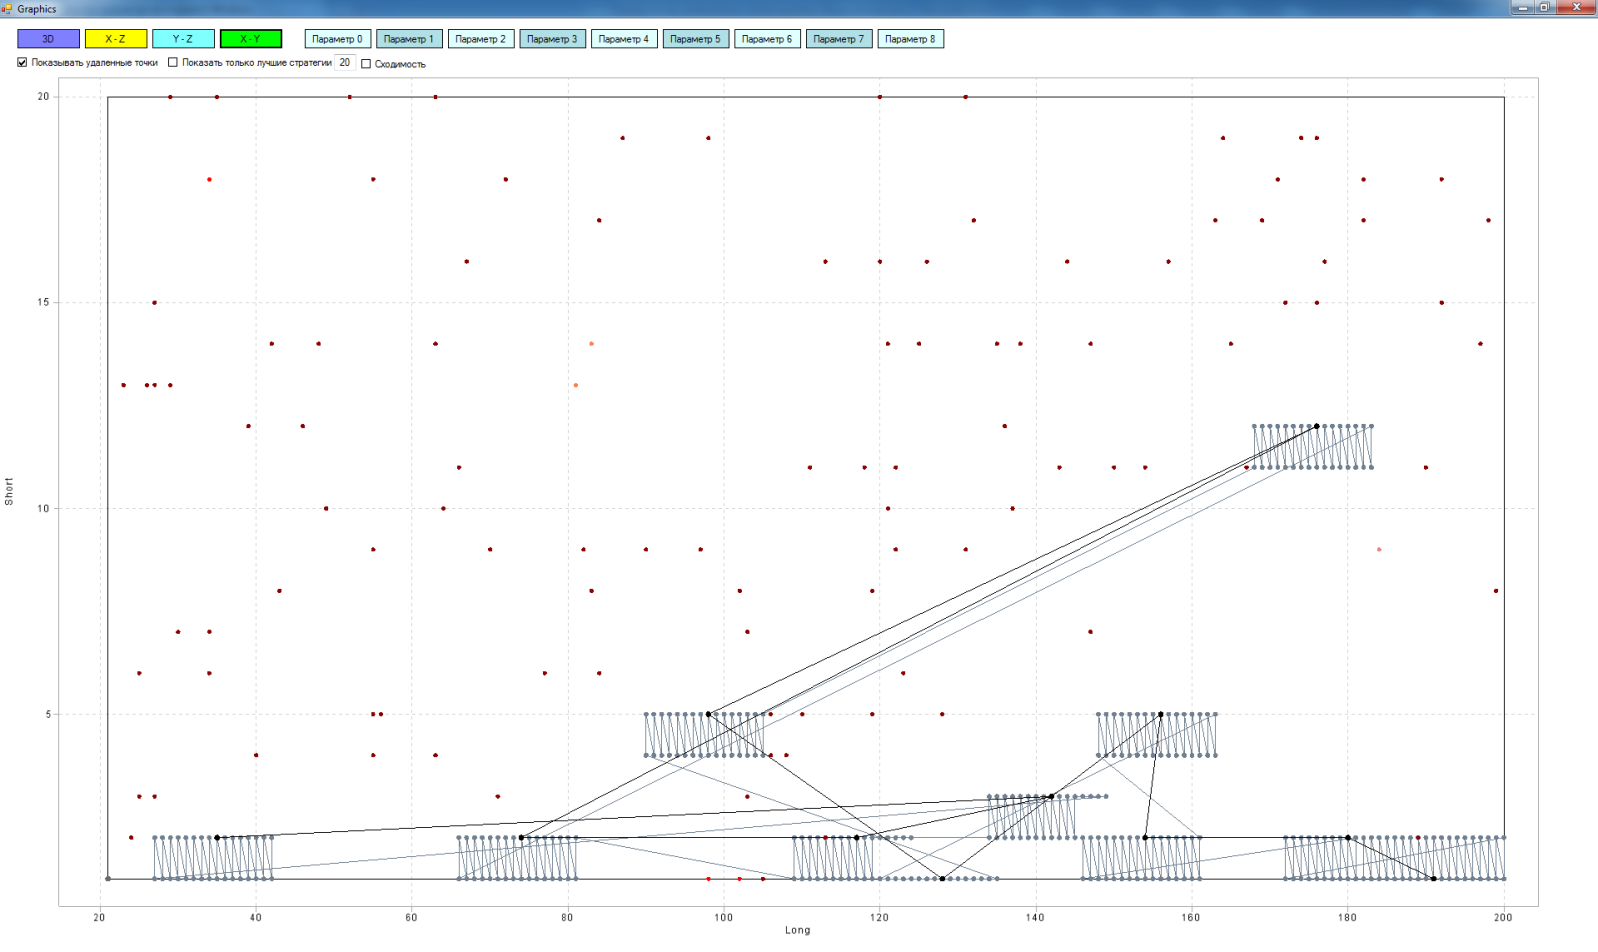
But in three coordinates I like it more - more clearly.
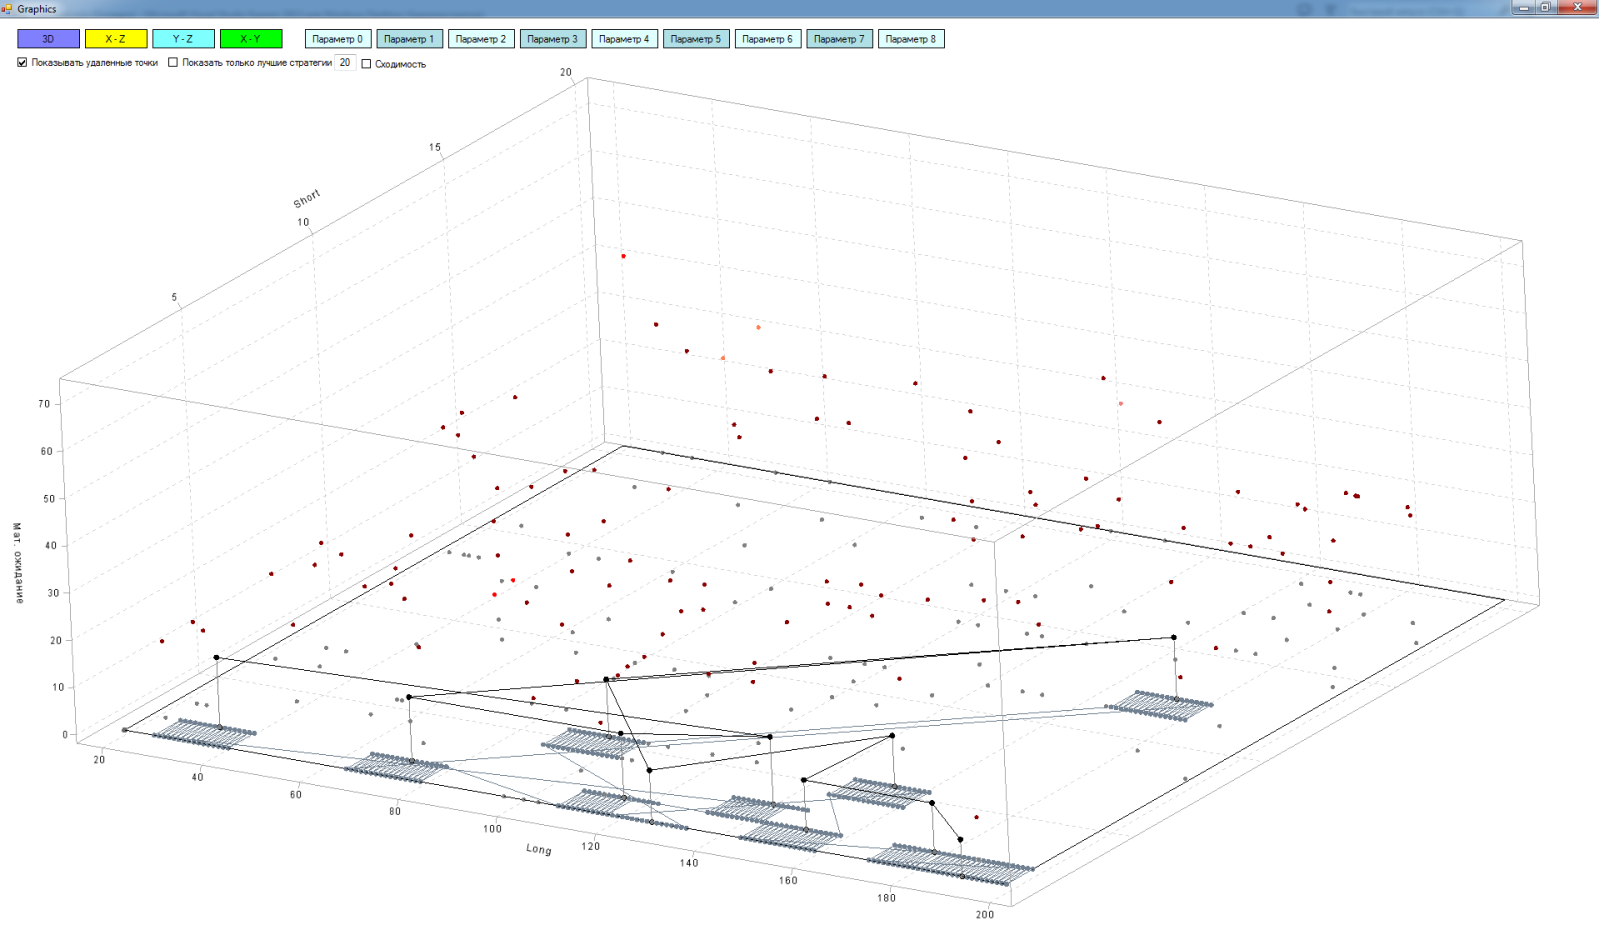
So, black dots in space are the worst strategies according to the test results. Their lines connecting the path of the algorithm from point to point. The gray dots in the plane are the strategies that we remove from the study area. The lines between them are the path of the algorithm for removing strategies from the matrix. The lines between black dots and gray are the projection of the worst strategy onto a plane. Single gray dots on a plane are projections of strategies already tested on a plane.
Here you can see how the algorithm goes from one worst strategy to another, starting with the worst:

Advantages of the algorithm:
We deliberately remove the worst strategies from the research space. Thus, at the next iterations, we explore areas with more profitable strategies and do not spend valuable testing time on studying areas that we do not need. Ultimately, our area of research converges to all the maxima of space.
As a result, we get something like this: I
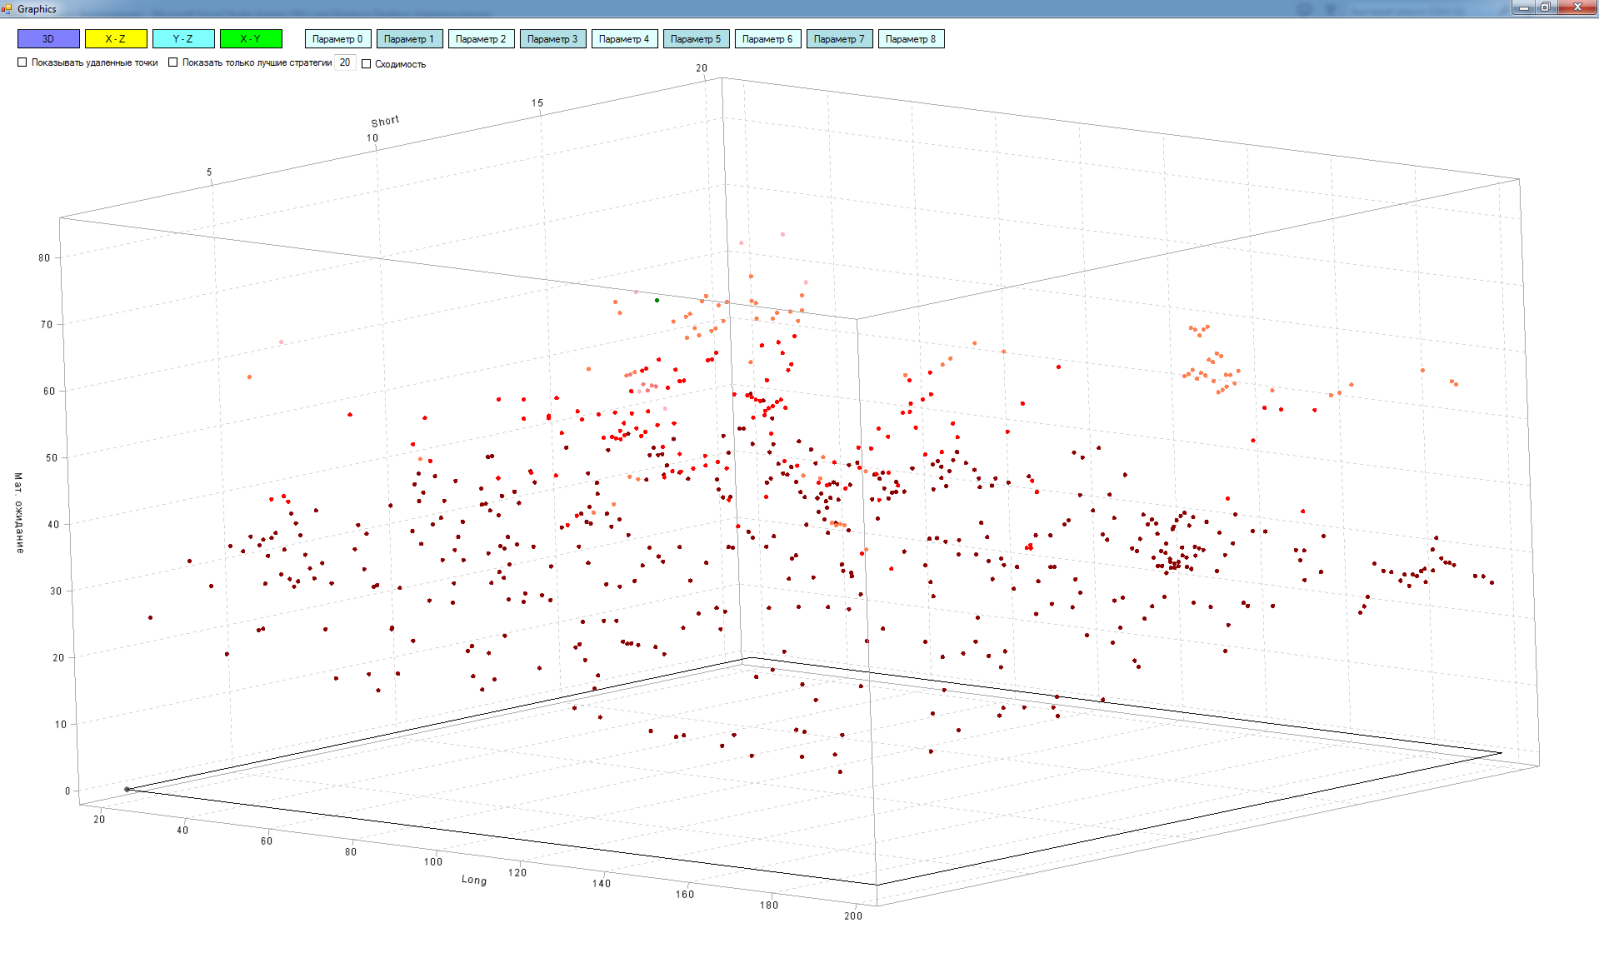
have not yet succeeded in screwing the interpolation, so there is no surface, I am satisfied with the points.
In a multidimensional matrix, you can see the cross sections for measurements:
“Long - expectation”

“Short - expectation”
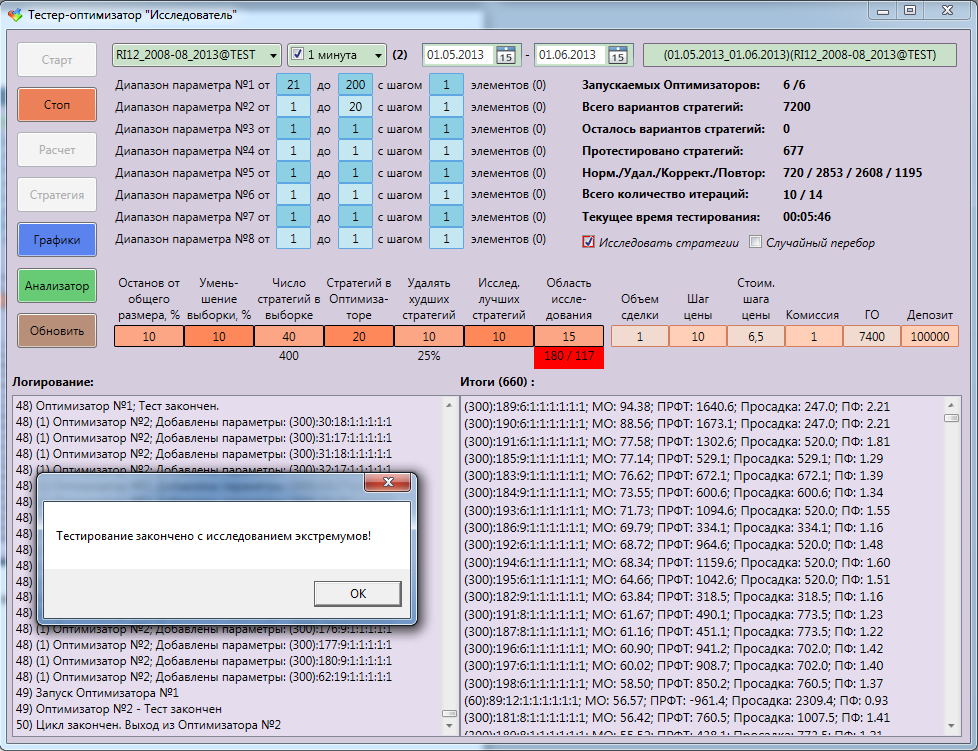
Appearance of the tester-optimizer “Researcher”:

All applications were written entirely in C #. Before starting the optimization, we configure the following parameters:
- ranges of strategy parameters, as well as the step of these parameters,
- what timeframes we’ll investigate (you can select several at once),
- range of history
- tool,
- way to save optimization results,
- commission calculation parameters, etc.
- test stopping criterion as a percentage of the initial matrix size,
- by how many% we will reduce the sample area after each iteration. The total number of iterations and the accuracy of optimization depend on this.
- how many random strategies will we explore from the sample area at each iteration,
- how many strategies we will send to the testers (several visits are possible). Depends on the power of the PC, the amount of RAM, the depth of historical data.
- around how many worst strategies we’ll remove local areas,
- how many best strategies we will examine for convergence,
- the size of the local area around the best strategies that we will explore further.
Instead of optimizing, you can run "random search". Here, strategies are tested not on a grid, but in a random order. That is, we can stop the study at any time and evaluate the result. Of course, the more strategies we test, the clearer we get the idea of space.
Suppose we explored space and roughly imagine how many maxima are there. And what does this give us? So far, almost nothing ...
We need to investigate these maxima, to understand whether they are random or systemic. To do this, the tester-optimizer provided the opportunity to choose the best strategies and additionally, in more detail explore the areas around them. Explore the strategies that we missed during optimization. Now we know almost everything about the extrema of space! The data obtained can be further investigated for clustering, re-optimization, and more. But that's another story!
PS Not a lot about yourself. I met trading about a year ago, at first I traded manually, then I realized that this was not mine. I came to the conclusion that it is better to trade according to clear rules and automated. The first algorithm was written in the scripting language of the Quik terminal, but this language (qpile)turned out to be incredibly wretched. Then he began to get acquainted with C # and write his first trading robots on it. At the moment I am creating a multifunctional platform for algorithmic trading.
Good luck to all! Regards, Alexey.