Process memory card
Have you ever wondered how exactly the memory available to your program is used, and in general, what exactly is located in these two or three gigabytes of virtual memory that your software works with?
Ask why?
Well, for a 32-bit application, 2-3 gigabytes is your limit beyond which you can’t get out without using AWE, but it’s still desirable to control your own resources. But even without it, just to figure it out ...
In previous articles, I described the work of the debugger, where the memory of the application under debugging was modified. This article is a continuation of this material. And although it will not be related to the debugger, but to the debugging process - the most direct ...
Let's see how the programmer works with memory during debugging (especially when debugging a third-party application, in other words, when reversing):
1. As a rule, the most frequent operation is to search for a value in the application’s memory and, unfortunately, this functionality is for some reason not provided in the Delphi debugger (in fact, as in MS VC ++).
2. Modification of system structures (PEB / TEB / SEHChain / Unwind / directories of PE files etc ...) will be much simpler when the fields of structures are unmapped to the addresses they occupy and presented in a readable form.
3. Tracking changes in the process memory (almost no functionality provided, implemented as plugins for popular debuggers). Indeed, why trace to a bluish blue when it is enough to compare two snapshots of a memory card to see if the data modification we need is happening or not?
Yes, in fact, there are many use cases.
However, if without lyrics, there are very few utilities that display more or less sane information about the process memory card that can be used for debugging.
The most convenient implementation is from OllyDebug 2, but, unfortunately, it does not display data on 64 bits (we are still waiting).
VMMap from Mark Russinovich performs purely decorative properties, yes beautifully, yes, signed by Microsoft, but it’s hard to practically apply the data displayed to her.
ProcessHacker is a good tool, but its author did not set itself the task of working with the output of memory data, so the information he displays can be said to be generally the simplest.

Well, I’m still not used to the IDA Pro memory card for so many years of working with it (I’m not comfortable) :)
However, debugging is not everything where a valid memory card can come in handy. In particular, for work, I use a memory card to analyze the error log sent to us by users along with a dump of critical sections, integrating information about it in EurekaLog.
In this article, I will try to tell you step by step how to independently create a process memory card and place in it information about the data needed for debugging and analysis.
All virtual process memory is presented in the form of pages.
Pages are small (4096 bytes) and large. ( For more information, see MSDN )
In most cases, pages in a row have the same attributes.
What is a region?
Roughly ( based on MSDN ) is a set of all pages that have the same attributes that start with the address passed to the VirtualQuery function.
In the simplest form, you can get a list of regions of our process with this code:
For example, we initially passed the address nil as the first parameter. After calling the function, the MBI variable will take the following values:
The size of the region is $ 10,000 (64 kb), this corresponds to 16 pages in a row, starting from address zero, whose state (State) is MEM_FREE ($ 10,000) and the security attribute PAGE_NO_ACCESS (1) is set in the Protect parameter.
If you rewrite the code like this:
... then you can clearly see the principle of regionalization with the VirtualAlloc function:

For example, the second and third regions have the same access attributes (read record), but different AllocationBase. AllocationBase is assigned to pages when allocating memory through VirtualAlloc, thus combining them in a separate region.
The time has come to start filling out the regions we received with information about what they store, and we will start with the flows (threads — whatever you like).
The code to get the list of threads is simple - through CreateToolhelp32Snapshot.
The steps:
The NT_TIB declaration looks like this:
Well, or like this, if you describe a little more:
The remaining fields are not needed.
Well, however, how aren't needed?
We need, of course, but so far they are redundant for us.
By the way, here is a link where you can see a slightly outdated description of this structure: Thread Environment Block .
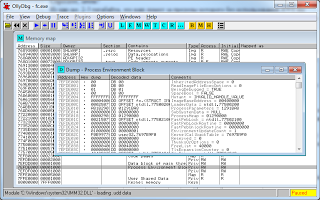
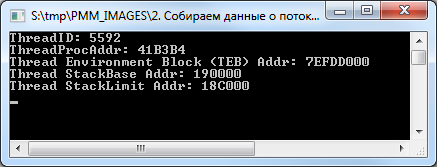
This code will display us the following picture:
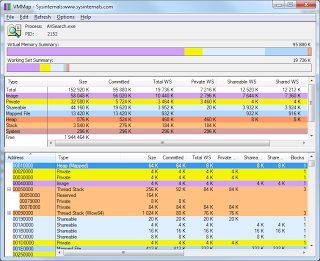
And so it will be seen in VMMap.
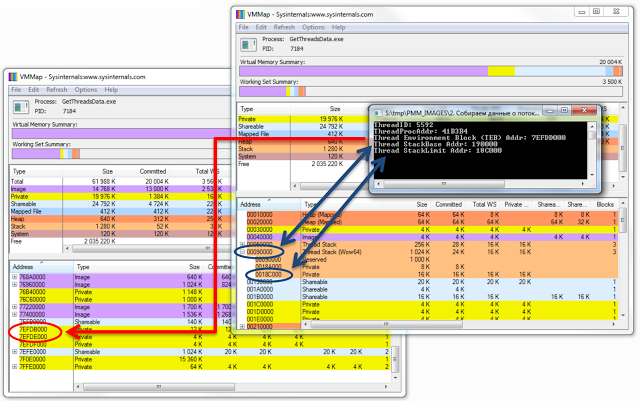
The picture shows that VMMap did not display information about TEB.
By the way, some functions and structures from the above code are not declared in the standard Delphi sources, you can see their declaration in the demo examples that are part of this article. But this does not mean that they are not documented in MSDN :)
If we want to work with the TEB of our stream, the code will be greatly simplified due to the fact that we do not need to use the ToolHelp32.dll functions, but rather use the segment register FS (or GS for x64).
For example, very often there is such a function to get the TEB address:
In this case, the parameter NtTIB.Self of the TEB structure is accessed, which is located at offset 0x18 (or 0x30 in the case of 64-bit TEB) from its beginning.
However, we continue ...
Some of the data received, but this is not all the information available to us.
On the stack of each thread are SEH frames, which are generated automatically when you enter the try..finally / except block, as well as a stack of procedure calls. It would be nice to have these data on hand and display them in a more visual form - with reference to the region.
We will deal with the promotion of SEH frames with such a simple procedure:
Having received the TEB.TIB.ExceptionList value, which points to the first EXCEPTION_REGISTRATION structure, as a parameter, it runs along the chain of these structures, focusing on the prev value of this structure, which contains the address of the previous EXCEPTION_REGISTRATION structure. And the handler parameter contains the address of the exception handler if it suddenly happens.
Everything looks like this:
Well, CallStack will receive the following procedure:
True, unlike the Delphi debugger, it will output data about the procedures for which the stack frame is generated; it will skip the rest.
The StackWalk (or StackWalk64) function is responsible for listing information about stack frames.
Now the caveat: if we apply this code to ourselves, then it will be able to trace only one stack frame, after which there will be an exit (you can check on the demo application ).
This will happen for the following reason: for the StackWalk function to be properly traced, it is necessary to specify the parameters of the current stack frame (EBP and ESP / RBP and RSP for x64) and, in fact, the current code address (EIP or RIP register for x64). If we take this data from ourselves, then this will happen the moment we call the GetThreadContext function, and we will begin to spin the stack after we exit this function, where all three parameters become, to put it mildly, not valid. For this reason, it will not work to trace itself by calling this function.
It’s advisable to consider this moment ...
I’ll stop a bit later on getting information about the threads of a 32-bit process under a 64-bit OS, including 32 and 64-bit versions, but now ...
The Delphi application itself, as a rule, does not use heaps, this is more the prerogative of C ++ applications, but still heaps are present here. Usually they are created and used by various third-party libraries for their needs.
The nuance in receiving heap data is that the HeapEntry elements that make up each heap can be several thousand, and the second nuance is that the Heap32Next function rebuilds the entire list with each call, creating a fairly sensitive delay (up to tens of seconds). I already wrote
about this unpleasant feature . True, in that article, the code was quite approximate, just to demonstrate the principle itself, and it will not work for us, but its more combed version will quite suit:
In short, by calling the RtlQueryProcessDebugInformation, RtlCreateQueryDebugBuffer, and RtlQueryProcessDebugInformation functions, a buffer is created that contains information about the current process heaps. Then, knowing the structure of the data stored in it, we obtain this data in a loop.
pDbgBuffer ^ .Heaps - stores heap lists (analogue of THeapList32), and the records themselves are stored in pDbgBuffer ^ .Heaps ^ .Heaps [N] .Entries (analogue of THeapEntry32).
This code will output the following information:
In principle, I use heaps quite rarely when debugging, but sometimes this information can come in handy.
Now it's time to get information about executable files and libraries loaded into the address space of the process. There are several ways to do this (for example, by analyzing PEB.LoaderData), but let's do it easier.
As a rule, a separate region is allocated for the PE file (well, at least I haven’t encountered such that the PE image was loaded without alignment with the top of the region), therefore, taking the code from the first chapter and checking the data of the first page of the region as a basis for compliance with the PE file, we get a list of all loaded libraries and executable files.
The following code detects the presence of a valid PE file at the specified address:
Well, more precisely, he just checks for the presence of ImageDosHeader and ImageNTHeader, focusing on their signatures. In principle, for 99% of cases this is enough.
The third parameter is just informative; it shows whether the PE file is 64-bit.
You can get the path to the downloaded file by calling the GetMappedFileName function:
And now let's try to see what we are loading into a regular console application:
You get the following picture:
64-bit library in a 32-bit application? Yes, it's easy :)
I have a 32-bit application, the operating system Windows 7 x64. Judging by what is shown in the picture, four 64-bit libraries live and work quietly in our 32-bit process, however, there is nothing unusual here - this is the so-called Wow64 ( Win32 emulation in 64-bit Windows ).
But it immediately becomes clear where 64-bit analogues of 32-bit streams and heaps come from.
Now, in a good way, you need to get the addresses of the sections of each PE file so that you can show them more clearly. All sections are aligned at the beginning of the page and do not intersect with each other.
Let's do it like this:
Here we use a call to the MapAndLoad function, which, in addition to loading the file and checking its headers, also performs section alignment by calling NtMapViewOfSection.
For its own process, of course, calling this function is redundant, because the required PE file is already loaded into the address space of the process, but since If we need a more universal code for working with other processes, we will use this approach.
MapAndLoad is also good because it allows 64-bit processes to load 32-bit PE files (though this does not work for 32-bit processes), and this feature will come in handy later on.
The essence of the code is this: after executing MapAndLoad, we will have a filled TLoadedImage structure on hand, the Sections parameter of which points to an array of TImageSectionHeader structures. Each of these structures has a VirtualAddress field, which is the offset from the library load address. Adding the value of this field to the hInstance library, we get the address of the section.
The IsExecute and IsWrite functions check the characteristics of the section and return True if the section contains executable code (IsExecute) or data available for modification (IsWrite). They look as follows:
As a result of this code, we will see the following:
True, with this code there is another small nuance.
As seen in the previous picture, the GetMappedFileName function returns the path to the downloaded file in the following form: "\ Device \ HarddiskVolume2 \ Windows \ System32 \ wow64cpu.dll", and the MapAndLoad function requires a normalized path of the form "C: \ Windows \ System32 \ wow64cpu. dll. "
The following code is responsible for bringing the path to the familiar look:
This is already quite old code, which I constantly use to bring to the normal path. Its essence is that of the following types of paths:
... get the fixed "\ Device \ HarddiskVolume1 \ WINDOWS \ system32 \ ntdll.dll".
This is done by calling ZwOpenFile + NtQueryObject, after which all disks in the system are simply sorted and for each QueryDosDevice is called, which returns the path in the same format. After that, the paths are compared and (if they coincide), the corresponding drive label is substituted for the transferred path.
But this is lyrics.
To be completely satisfied with yourself, it is advisable to display the directories of the PE file as well, so that it is immediately clear where to look, for example, the import table, where UNWIND sits, etc.
This is done with fairly simple code:
Having the TLoadedImage structure on hand, we can simply call the ImageDirectoryEntryToData function to get its address, however, it will be bound to the address at which the PE file is displayed. To translate it into a real one, you need to subtract from the current address the address at which the image is displayed, thus obtaining the offset from the beginning of the file, and already add it to the ImageBase library.
The result is this picture:
It is immediately clear that, for example, in the ".text" section of msctf.dll library there are import / export / pending import directories, etc.
The resource directory sits in the ".rsrc" section, and the relocs are also where they should be, however, the "bound_import" directory drops out of the scheme.
Yes, indeed, this directory is not located directly in any of the sections of the library, such is its peculiarity. It usually goes immediately after the PE heading (although it can sometimes be found in between sections). This directory serves to provide a mechanism for “tied import”, which is found mainly in programs and libraries that are part of the OS.
Its essence is that all addresses of imported functions are sewn into the executable file at the compilation stage, so you do not need to perform unnecessary gestures by running through the regular import table in search of the address of the function.
But the overhead is also appropriate, because as soon as any of the libraries declared in the linked import section changes, the application must be recompiled.
Having data on streams, heaps and executable files on hand, right now you can make a small utility that displays information in a readable form, but what else can be added?
At a minimum, it is highly desirable to receive and output information from the process environment block.
Access to it can be obtained by calling the NtQueryInformationProcess function with the flag ProcessBasicInformation (constant equal to zero). In this case, the hands will have a PROCESS_BASIC_INFORMATION structure, in which the PebBaseAddress field will contain the PEB address.
But this will be relevant only if the bits of the processes (of the requesting and of which we are requesting information) match. If we call this function from a 64-bit application as applied to a 32-bit one, we will get the address of the 64-bit PEB, and not the native 32-bit one.
In order to access Wow64PEB from a 64-bit application (let's call it that), you must call the NtQueryInformationProcess function with the ProcessWow64Information parameter (constant equal to 26) and the buffer size equal to SizeOf (ULONG_PTR). In this case, instead of the PROCESS_BASIC_INFORMATION structure, the function will return a pointer to a 32-bit PEB, from which we will read out the information we need using ReadProcessMemory.
What is PEB?
Roughly speaking, this is not a well-documented structure, most of which is designed to store data used directly by the system. But this does not mean that it is not interesting to the developer of a regular application. In particular, this structure contains a number of interesting fields, such as: BeingDebugged flag indicating whether the debugger is connected to the process; Pointer to PEB_LDR_DATA, which contains information about the modules loaded into the process; and a lot of the rest is quite useful information for the programmer, especially for someone who knows how to use it for their own purposes :)
This structure looks something like this (declaration for Windows7 x86 / 64):
By the way, compare this structure with that which is officially available in MSDN .
For Window 2000 / XP / 2003 there will be small changes, but not very critical.
I will not paint each field, those who work with PEB already know? what exactly they need, but in some fields I will draw your attention.
So:
Well and so on - you can continue for a long time.
Most of these fields occupy their pages in the process address space. For example, ProcessParameters usually sits in one of the heaps created by the loader, environment variables are also located somewhere in that area.
If we want to visualize all this (and I’m leading to this), we must have this data on hand so that there is something to display in the final application.
Agree, it’s much nicer to have something in the form of this instead of a certain block of binary data:
But there is also KUSER_SHARED_DATA.
This is also the structure used by the system, and you constantly meet with it, calling the same GetTickCount or IsProcessorFeaturePresent.
For example, NtSystemRoot sits in it, and, again, why list everything, it's easier to see:
However, perhaps, we will stop here for now ...
On this the theoretical part ended and it was time to put it all into practice.
First of all, you need to decide how to store information about the regions. Preparing for the article, I wrote a set of classes allocated to the common namespace “MemoryMap”, you can find them as part of the demo examples .
Information for each region will be stored by the TRegionData class, implemented in the "MemoryMap.RegionData.pas" module.
It looks approximately as follows (in the process of developing a project, the class declaration may change).
In order:
Each region, as a rule, stores in itself data of one type.
Those. for heaps, stacks of streams, PE files, its own region of pages is allocated.
The RegionType property is responsible for storing the region type. This is an enumerated type declared as follows:
Region settings obtained by calling VirtualQueryEx are stored in the MBI field.
A brief description of the region is stored in Details. You can store anything in it, for example, the path to the displayed PE file, if any, a string description of the stream ID, etc. ...
The following three parameters are used to organize the tree structure.
One of the regions is the root node (root), the rest are child ones.
The RegionVisible flag indicates whether the region is the root node.
The HiddenRegionCount property contains the number of subregions (AllocationBase of which is equal to the BaseAddress root).
Well, the Parent parameter stores a link to the root.
It’s not done optimally, it would be possible to organize a classic tree, but at the moment there is no time to redo it, maybe sometime later :)
TotalRegionSize contains the total size of all subregions, including the root one.
If the region contains a heap, data about its first element is placed in the Heap parameter, which is the following structure:
The remaining heap elements located within the region are placed in the Contains field.
In general, the Contains field can contain many types of data.
Next is the Thread field, it stores information about the thread that the region uses to store its own data.
If there is a lot of data about a stream within a region (for example, a list of SEH frames or a CallStack stream), they are also placed in the Contains field.
Data from system structures (fields of PEB / TEB structures, etc.) are placed in the SystemData field, which is a record from the data address and its description.
Also, this data can be placed in the Contains field.
If the region belongs to one of the sections of the PE file, the section data is placed in the Section parameter. Well, the list of file directories is located in the Directory field.
Something like this in a nutshell. Now, to present data on the process memory card, we need to get a list of regions, create an instance of the TRegionData class for each of them, and initialize the fields of the created object with the required information.
The TMemoryMap class is responsible for this ...
This class is implemented in the module "MemoryMap.Core.pas".
Its task is literally reduced to three main stages:
In practice, everything looks a little more complicated.
The basic procedure for collecting information is as follows:
I gave the sample code of the GetAllRegions / AddThreadsData / AddHeapsData and AddImagesData procedures in the first four chapters and I will not focus on it, but I would like to deal with the rest.
The very first step after opening a process is to determine the bitness of the process.
This is necessary for the reason that if the bit sizes of the processes (current and for which we receive information) do not match, then some additional steps need to be taken.
The general scheme is as follows:
If everything is clear with the first two points, then the other three will be considered in more detail.
The reason that a 32-bit process cannot get data on a 64-bit one is simple: the size of the pointer will not allow it, plus ReadProcessMemory will periodically throw an error ERROR_PARTIAL_COPY.
But getting data from a 32-bit process in a 64-bit OS is much trickier.
As I said earlier, in a 32-bit application, four 64-bit libraries are loaded that create their heaps / threads.
If we get a list of heaps and streams from a 32-bit application, we will see data only related to 32 bits; data on 64-bit analogs cannot be obtained.
The same will be the case when requesting data about a 32-bit process from a 64-bit one, only data relating to 64 bits will be returned. Although in this case there is an option to get them partially.
In particular, access to a 32-bit PEB is made by calling this function:
Access to the 32-bit TEB can be obtained by reading the address from the 64-bit TEB, which is stored in the NtTIB.ExceptionList parameter.
You can get the context of the 32-bit stream for the CallStack promotion using this code:
Or by calling the Wow64GetThreadContext function.
But I don’t know how to get data about 32-bit heaps from a 64-bit process in a legal way. The only option that I am applying now is sending a command to a 32-bit process, which collects data about 32-bit heaps and sends it back to 64-bit (this is what the handler in the AddWow64HeapsData function does).
Now that we’ve figured out the definition of the process bit and what it is for, let's go further, namely, to call the SuspendProcess function.
In a good way, this is only necessary so that the data in the remote process does not change to become irrelevant at the time of reading. However, usually I use this set of classes in two cases, for my own application or for an application under the debugger. In both cases, it is not necessary to freeze the threads, but if some third-party application is being analyzed, then why not?
After freezing a remote process, three helper classes are created.
In essence, TWorkset stores a list of structures of the form:
These structures are stored in a dictionary and each is associated with a specific page address.
The parameters are simple:
This data is obtained in the following way, in which it all boils down to calling the QueryWorkingSet function:
This function returns an ULONG_PTR array, each element of which stores data as follows: the first five bits store page security attributes; the next three bits are the number of processes to which this page is available; one more bit indicates the accessibility of the page; Well and then comes the address of the page itself.
More details can be found here: PSAPI_WORKING_SET_BLOCK .
In fact, this is just an information class, no more, no less.
However, back to our code.
The next steps are:
As you can see, I already told you everything interesting (almost) :)
The remaining steps are not interesting, except for calling UpdateRegionFilters.
It performs a utilitarian function, namely, it excludes regions that are currently unnecessary from the list (well, for example, removes regions with unallocated memory, etc.).
This procedure will be called constantly when the filter is changed through the Filter property.
However, you can see all this from the code of the class itself if you wish.
Working with him is quite simple:
As they say, I wrote for myself, therefore, working with this class is as easy as shelling pears :)
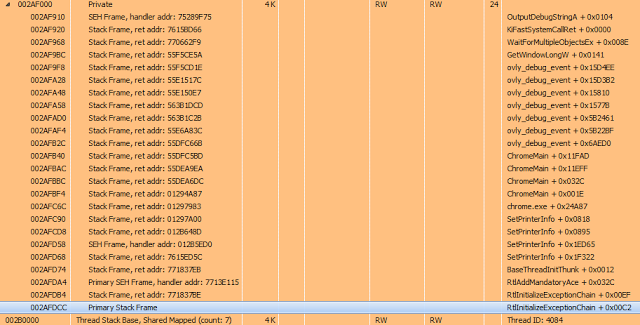
The essence of this class is to obtain more detailed information about the address in the process. Well, for example, in the second chapter, we received a CallStack stream (or SEH frame handlers) and these were just some addresses. But it’s much more interesting to see something like this picture instead of dry numbers:

This is done very simply - just calling the SymGetSymFromAddr function is enough, but there are several nuances.
Let's look at the code first:
To correctly obtain a description of the name of the function to which the address belongs, you need to know the path to the library to which the function belongs, or the address to which this library is loaded (both parameters are used in the code). These parameters are required for the SymLoadModule function.
The second caveat is that the call to the SymGetSymFromAddr function can sometimes fail. The reason is not clear to me, but the Internet periodically describes this situation and how to solve it is to call the SymLoadModule function again without calling SymUnloadModule. I did not understand such strange behavior - but it really helps.
The last nuance is that this function will return a valid description of the address only when this information is present (characters from an external file are loaded or they are part of the desired module).
This information is not very important for debugging, but it simplifies it a bit.
Here, for example, looks like the standard Chrome browser thread stack (CallStack + SEH frames):
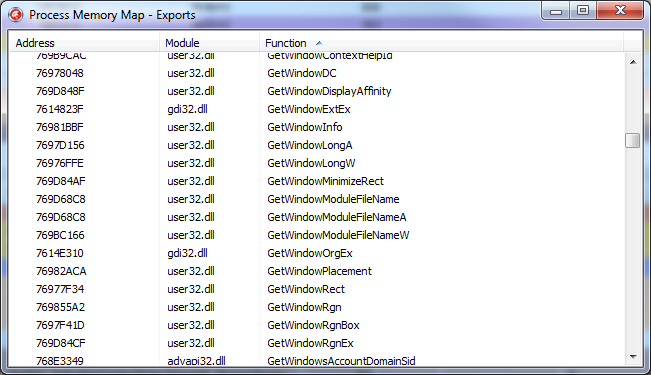
More useful information that symbols can provide is a list of exported library functions and their current addresses.
In the TSymbols class, this information is obtained by calling the GetExportFuncList procedure and looks like this:
It all comes down to calling SymEnumerateSymbols, which passes the address of the callback function.
When it is called, the SymbolName parameter will contain the name of the exported function, and SymbolAddress its address.
This is enough to display the following sign to the user:
You can see the implementation of this class in more detail, including the omitted calls to SymSetOptions and SymInitialize in the module "MemoryMap.Symbols.pas".
Well, here we come to the final part of the article.
As I said earlier, I use the MemoryMap set of classes in two ways:
1. Integrating it into the EurekaLog output by overlapping its OnAttachedFilesRequest handler, where I add the current process map that was current at the time the exception occurred, and dumps of all Private regions (pages not associated with defined data that has the MEM_PRIVATE flag) and stream stacks, plus some of the information from the PEB. Usually this is enough to analyze the causes of the error.
2. I use it as an alternative tool for analyzing a debugged application.
For the second option, a separate utility was implemented that works directly with the MemoryMap classes, plus it adds some additional functionality.
I will not describe its source code, I will walk only a little on the functionality.
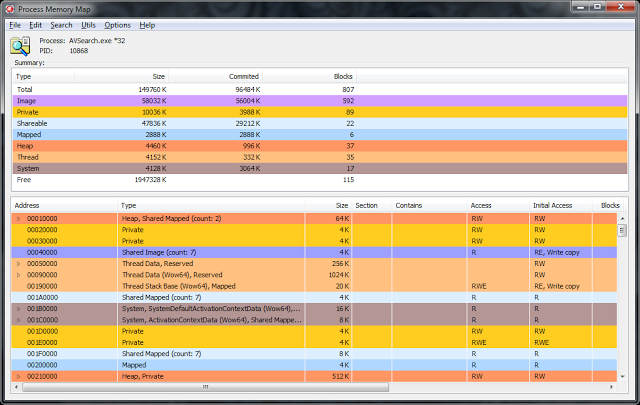
From the front end, it is almost one-on-one reminiscent of VMMap. However, this was originally planned, because such an interface is most convenient for analysis.
In the upper part there is a list with general information on the regions grouped by their types, it is also a filter.
At the moment, it represents the following functionality:
1. View the contents of memory at the specified address (Ctrl + Q).
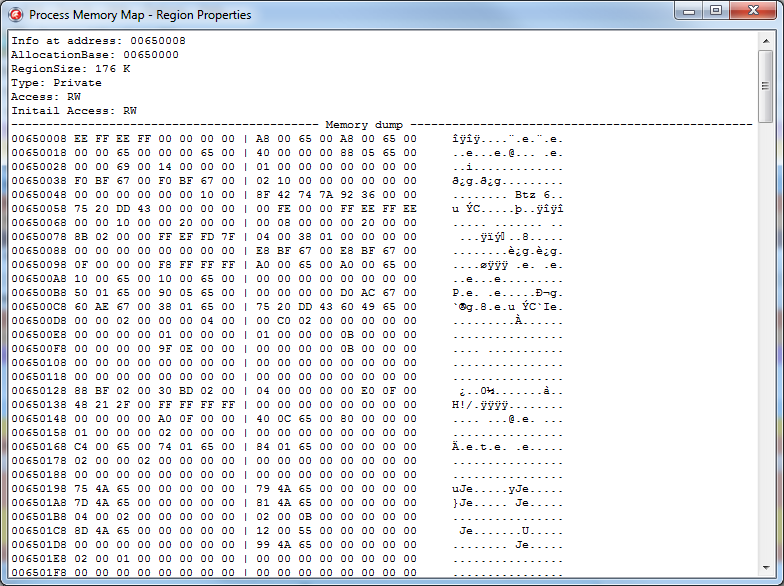
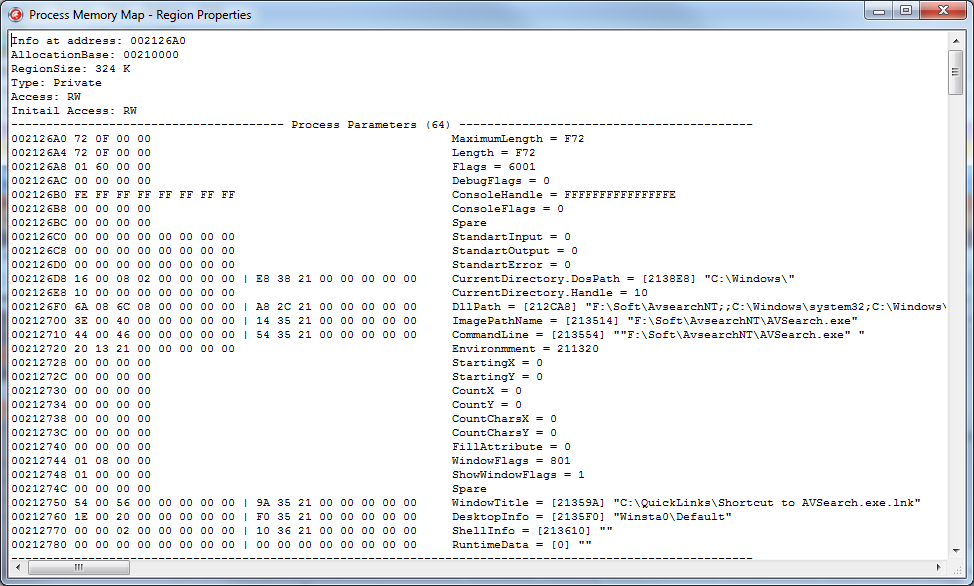
This functionality, in principle, is present in the Delphi debugger in the CPU View window, but this mode has much more possibilities. For example, if you look at the PEB field, the data will be displayed in a different form:
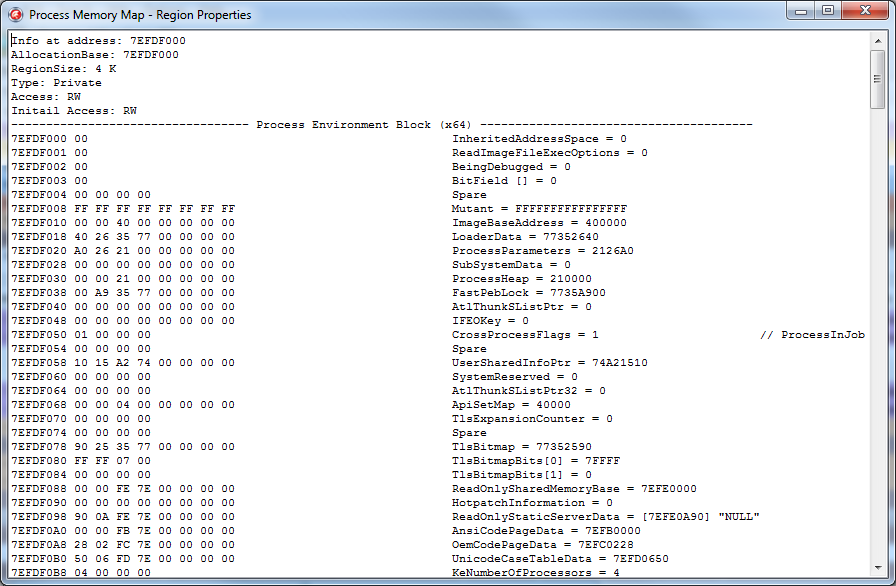
This is what the process parameter block will look like:
Well and so on. In total, at the moment, the utility can display demapsed data for the following structures:
This list is not final, periodically new structures will be added to it.
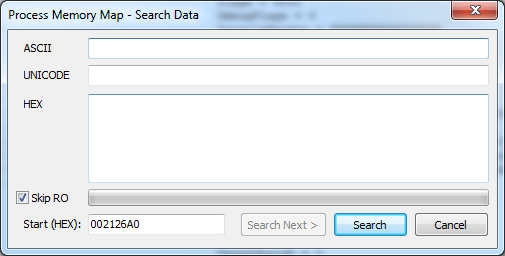
2. Search for data in the process memory (Ctrl + F):
Unfortunately, this functionality is missing in the Delphi debugger.
You can search by Ansi, or by Unicode string, or simply by abstract HEX buffer. When searching, you can specify the address of the start of the search, as well as a flag indicating the need to search the pages, access to which is possible only for reading.
The result is displayed as a window with a memory dump, shown above.
3. Comparator of two memory cards. It is included in the settings.
Allows you to find the differences between the two memory cards and displays them as text.
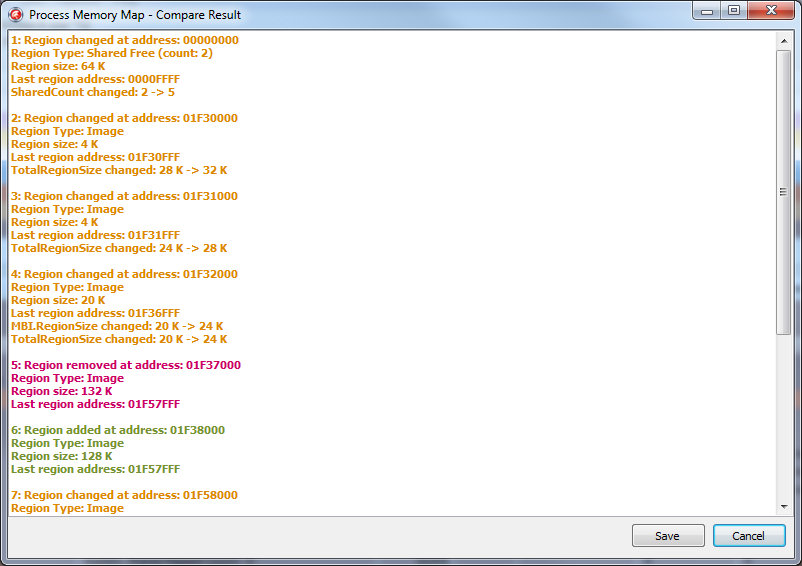
Only the cards themselves are compared, not the data. Those. if 4 bytes have changed at some address, this change will not be displayed. But in the event that the size of the region has changed, a bunch has gone, the file has been uploaded / downloaded, etc. - All this will be displayed in the comparison results.
You can compare both the current picture of the map with that previously saved, or when updating the picture using the F5 hotkey.
4. A memory dump.
Also missing functionality in the Delphi debugger. Allows you to save to disk the contents of the memory of the specified region or data from the specified address.
5. The output of all available exported functions from all libraries loaded into the analyzed process (Ctrl + E).
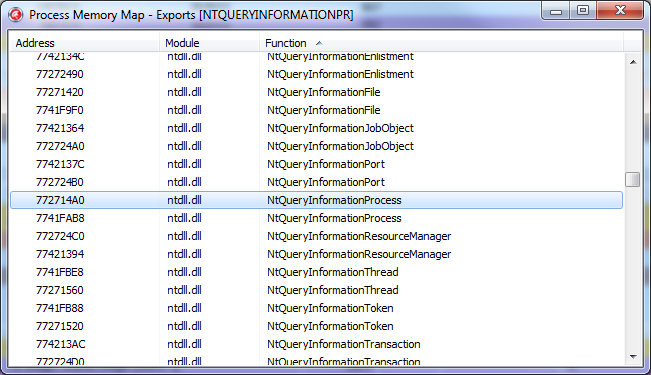
As well as a quick search for a function by its name or address.
So far, the current functionality is enough for me personally, and I have not added new, but in the future this utility will develop.
ProcessMemoryMap is an OpenSource project.
Its latest stable release is always available at the link: http://rouse.drkb.ru/winapi.php#pmm2
GitHub repository with the latest code changes can be found here: https://github.com/AlexanderBagel/ProcessMemoryMap
Direct link to the source code : https://github.com/AlexanderBagel/ProcessMemoryMap/archive/master.zip
Direct link to the latest build: http://rouse.drkb.ru/files/processmm_bin.zip
Self-assembly requires an installed package of components of Virtual TreeView version 5 and higher: http://www.soft-gems.net/ .
The assembly is carried out using Delphi XE4 and higher in the "Win32 / Release" mode, and the 64-bit version of this utility will be automatically assembled and connected (as a resource).
Under older versions of Delphi, ProcessMemoryMap was not tested.
Well, I hope this material will be useful to you. Of course, I went only to the very tops, because if you disclose all the material in more detail, the volume of the article will increase enormously.
Therefore, here are a few links where you can find out a little more information.
Information about the TEB / PEB system structures, etc. can be found here:
http://processhacker.sourceforge.net/
http://redplait.blogspot.ru/
http://www.reactos.org/en
Information about PE files:
http://msdn.microsoft.com/ en-us / magazine / ms809762.aspx
SEH information:
http://msdn.microsoft.com/en-us/library/ms680657(v=VS.85).aspx
http://www.microsoft.com/msj /0197/exception/exception.aspx
http://qxov.narod.ru/articles/seh/seh.html
The source code of all demo examples can be taken from this link .
Many THANKS to the Delphi Masters forum for their repeated assistance in preparing this article.
Personal thanks for the proofreading to Dmitry aka “Ptiburdukov’s brother”, Andrey Vasiliev aka “Inovet”, and also to Sergey aka “Cartman”.
Good luck.
Ask why?
Well, for a 32-bit application, 2-3 gigabytes is your limit beyond which you can’t get out without using AWE, but it’s still desirable to control your own resources. But even without it, just to figure it out ...
In previous articles, I described the work of the debugger, where the memory of the application under debugging was modified. This article is a continuation of this material. And although it will not be related to the debugger, but to the debugging process - the most direct ...
Let's see how the programmer works with memory during debugging (especially when debugging a third-party application, in other words, when reversing):
1. As a rule, the most frequent operation is to search for a value in the application’s memory and, unfortunately, this functionality is for some reason not provided in the Delphi debugger (in fact, as in MS VC ++).
2. Modification of system structures (PEB / TEB / SEHChain / Unwind / directories of PE files etc ...) will be much simpler when the fields of structures are unmapped to the addresses they occupy and presented in a readable form.
3. Tracking changes in the process memory (almost no functionality provided, implemented as plugins for popular debuggers). Indeed, why trace to a bluish blue when it is enough to compare two snapshots of a memory card to see if the data modification we need is happening or not?
Yes, in fact, there are many use cases.
However, if without lyrics, there are very few utilities that display more or less sane information about the process memory card that can be used for debugging.
The most convenient implementation is from OllyDebug 2, but, unfortunately, it does not display data on 64 bits (we are still waiting).
VMMap from Mark Russinovich performs purely decorative properties, yes beautifully, yes, signed by Microsoft, but it’s hard to practically apply the data displayed to her.
ProcessHacker is a good tool, but its author did not set itself the task of working with the output of memory data, so the information he displays can be said to be generally the simplest.
Well, I’m still not used to the IDA Pro memory card for so many years of working with it (I’m not comfortable) :)
However, debugging is not everything where a valid memory card can come in handy. In particular, for work, I use a memory card to analyze the error log sent to us by users along with a dump of critical sections, integrating information about it in EurekaLog.
In this article, I will try to tell you step by step how to independently create a process memory card and place in it information about the data needed for debugging and analysis.
1. Get a list of available regions
All virtual process memory is presented in the form of pages.
Pages are small (4096 bytes) and large. ( For more information, see MSDN )
In most cases, pages in a row have the same attributes.
What is a region?
Roughly ( based on MSDN ) is a set of all pages that have the same attributes that start with the address passed to the VirtualQuery function.
In the simplest form, you can get a list of regions of our process with this code:
program Project1;
{$APPTYPE CONSOLE}
{$R *.res}
uses
  Windows,
  SysUtils;
var
  MBI: TMemoryBasicInformation;
  dwLength: NativeUInt;
  Address: PByte;
begin
  Address := nil;
  dwLength := SizeOf(TMemoryBasicInformation);
  while VirtualQuery(Address, MBI, dwLength) <> 0 do
  begin
    Writeln(
      'AllocationBase: ', IntToHex(NativeUInt(MBI.AllocationBase), 8),
      ', BaseAddress: ', IntToHex(NativeUInt(MBI.BaseAddress), 8),
      ', RegionSize: ', MBI.RegionSize);
    Inc(Address, MBI.RegionSize);
  end;
  Readln;
end.
For example, we initially passed the address nil as the first parameter. After calling the function, the MBI variable will take the following values:
- BaseAddress = nil
- AllocationBase = nil
- AllocationProtect = 0
- RegionSize = $ 10000
- State = $ 10,000
- Protect = 1
- Type_9 = 0
The size of the region is $ 10,000 (64 kb), this corresponds to 16 pages in a row, starting from address zero, whose state (State) is MEM_FREE ($ 10,000) and the security attribute PAGE_NO_ACCESS (1) is set in the Protect parameter.
If you rewrite the code like this:
function ExtractAccessString(const Value: DWORD): string;
const
  PAGE_WRITECOMBINE = $400;
begin
  Result := 'Unknown access';
  if (Value and PAGE_EXECUTE) = PAGE_EXECUTE then Result := 'E';
  if (Value and PAGE_EXECUTE_READ) = PAGE_EXECUTE_READ then Result := 'RE';
  if (Value and PAGE_EXECUTE_READWRITE) = PAGE_EXECUTE_READWRITE then
     Result := 'RWE';
  if (Value and PAGE_EXECUTE_WRITECOPY) = PAGE_EXECUTE_WRITECOPY then
    Result := 'RE, Write copy';
  if (Value and PAGE_NOACCESS) = PAGE_NOACCESS then Result := 'No access';
  if (Value and PAGE_READONLY) = PAGE_READONLY then Result := 'R';
  if (Value and PAGE_READWRITE) = PAGE_READWRITE then Result := 'RW';
  if (Value and PAGE_WRITECOPY) = PAGE_WRITECOPY then Result := 'Write copy';
  if (Value and PAGE_GUARD) = PAGE_GUARD then
    Result := Result + ', Guarded';
  if (Value and PAGE_NOCACHE) = PAGE_NOCACHE then
    Result := Result + ', No cache';
  if (Value and PAGE_WRITECOMBINE) = PAGE_WRITECOMBINE then
    Result := Result + ', Write Combine';
end;
function ExtractRegionTypeString(Value: TMemoryBasicInformation): string;
begin
  Result := '';
  case Value.State of
    MEM_FREE: Result := 'Free';
    MEM_RESERVE: Result := 'Reserved';
    MEM_COMMIT:
    case Value.Type_9 of
      MEM_IMAGE: Result := 'Image';
      MEM_MAPPED: Result := 'Mapped';
      MEM_PRIVATE: Result := 'Private';
    end;
  end;
  Result := Result + ', ' + ExtractAccessString(Value.Protect);
end;
var
  MBI: TMemoryBasicInformation;
  dwLength: NativeUInt;
  Address: PByte;
begin
  Address := nil;
  dwLength := SizeOf(TMemoryBasicInformation);
  while VirtualQuery(Address, MBI, dwLength) <> 0 do
  begin
    Writeln(
      'AllocationBase: ', IntToHex(NativeUInt(MBI.AllocationBase), 8),
      ', BaseAddress: ', IntToHex(NativeUInt(MBI.BaseAddress), 8),
      ' - ', ExtractRegionTypeString(MBI));
    Inc(Address, MBI.RegionSize);
  end;
... then you can clearly see the principle of regionalization with the VirtualAlloc function:
For example, the second and third regions have the same access attributes (read record), but different AllocationBase. AllocationBase is assigned to pages when allocating memory through VirtualAlloc, thus combining them in a separate region.
2. We collect data on flows
The time has come to start filling out the regions we received with information about what they store, and we will start with the flows (threads — whatever you like).
The code to get the list of threads is simple - through CreateToolhelp32Snapshot.
const
  THREAD_GET_CONTEXT = 8;
  THREAD_SUSPEND_RESUME = 2;
  THREAD_QUERY_INFORMATION = $40;
  ThreadBasicInformation = 0;
  ThreadQuerySetWin32StartAddress = 9;
  STATUS_SUCCESS = 0;
var
  hSnap, hThread: THandle;
  ThreadEntry: TThreadEntry32;
  TBI: TThreadBasicInformation;
  TIB: NT_TIB;
  lpNumberOfBytesRead: NativeUInt;
  ThreadStartAddress: Pointer;
begin
  // Делаем снимок нитей в системе
  hSnap := CreateToolhelp32Snapshot(TH32CS_SNAPTHREAD, GetCurrentProcessId);
  if hSnap <> INVALID_HANDLE_VALUE then
  try
    ThreadEntry.dwSize := SizeOf(TThreadEntry32);
    if Thread32First(hSnap, ThreadEntry) then
    repeat
      if ThreadEntry.th32OwnerProcessID <> GetCurrentProcessId then Continue;
      Writeln('ThreadID: ', ThreadEntry.th32ThreadID);
      // Открываем нить
      hThread := OpenThread(THREAD_GET_CONTEXT or
        THREAD_SUSPEND_RESUME or THREAD_QUERY_INFORMATION,
        False, ThreadEntry.th32ThreadID);
      if hThread <> 0 then
      try
        // Получаем адрес ThreadProc()
        if NtQueryInformationThread(hThread, ThreadQuerySetWin32StartAddress,
          @ThreadStartAddress, SizeOf(ThreadStartAddress), nil) = STATUS_SUCCESS then
          Writeln('ThreadProcAddr: ', IntToHex(NativeUInt(ThreadStartAddress), 1));
        // Получаем информацию по нити
        if NtQueryInformationThread(hThread, ThreadBasicInformation, @TBI,
          SizeOf(TThreadBasicInformation), nil) = STATUS_SUCCESS then
        begin
          Writeln('Thread Environment Block (TEB) Addr: ',
            IntToHex(NativeUInt(TBI.TebBaseAddress), 1));
          // Читаем из удаленного адресного пространства
          // TIB (Thread Information Block) открытой нити
          if ReadProcessMemory(GetCurrentProcess,
            TBI.TebBaseAddress, @TIB, SizeOf(NT_TIB),
            lpNumberOfBytesRead) then
          begin
            Writeln('Thread StackBase Addr: ',
              IntToHex(NativeUInt(TIB.StackBase), 1));
            Writeln('Thread StackLimit Addr: ',
              IntToHex(NativeUInt(TIB.StackLimit), 1));
          end;
        end;
      finally
        CloseHandle(hThread);
      end;
    until not Thread32Next(hSnap, ThreadEntry);
  finally
     CloseHandle(hSnap);
  end;
  Readln;
end.
The steps:
- Using CreateToolhelp32Snapshot / Thread32First / Thread32Next we get a list of active threads from our application.
- To get more detailed information, you need a handle to the thread, which is obtained by calling OpenThread.
- Using NtQueryInformationThread we get the address of the thread procedure with which he started working, and basic information about the thread in the form of the TThreadBasicInformation structure.
- Of this structure, we are only interested in one field - TebBaseAddress, which contains the address of the stream environment block, the so-called TEB (Thread Environment Block).
- By calling ReadProcessMemory (although this is redundant for your application), we read the data at the TEB address, namely its very first parameter, which is an NT_TIB structure.
The NT_TIB declaration looks like this:
  PNT_TIB = ^_NT_TIB;
  _NT_TIB = record
    ExceptionList: Pointer;
    StackBase,
    StackLimit,
    SubSystemTib: Pointer;
    case Integer of
      0: (
        FiberData: Pointer
        );
      1: (
        Version: ULONG;
        ArbitraryUserPointer: Pointer;
        Self: PNT_TIB;
        )
  end;
  NT_TIB = _NT_TIB;
  PPNT_TIB = ^PNT_TIB;
Well, or like this, if you describe a little more:
- ExceptionList - in a 32-bit process, a pointer to the address of the current SEH frame (EXCEPTION_REGISTRATION structure). Based on this information, we will unwind the entire chain of SEH frames.
- If the TEB belongs to a 64-bit stream running in a 32-bit application, then this field will point to the ExceptionList field of its 32-bit analogue.
- In a 64-bit process, this field is always nullified, because for 64 bits, a slightly different mechanism works instead of the SEH mechanism.
- StackBase - the base of the stack. The address from which the stack begins to grow in the direction of StackLimit.
- StackLimit is the current top of the stack.
- ArbitraryUserPointer is something like a free TLS slot. Roughly speaking, a variable belonging to a stream whose value can be arbitrarily changed by the programmer for his own needs.
- Self - parameter containing the TEB address (i.e. itself)
The remaining fields are not needed.
Well, however, how aren't needed?
We need, of course, but so far they are redundant for us.
By the way, here is a link where you can see a slightly outdated description of this structure: Thread Environment Block .
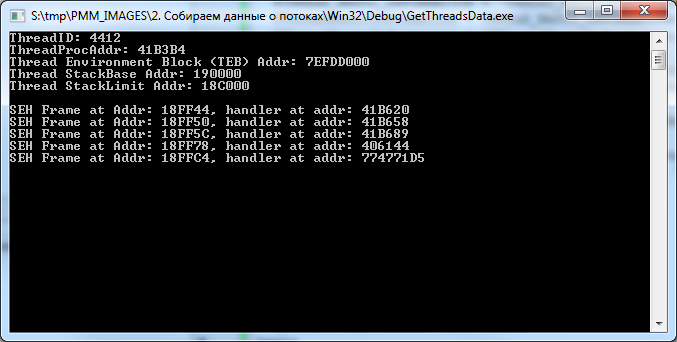
This code will display us the following picture:
And so it will be seen in VMMap.
The picture shows that VMMap did not display information about TEB.
By the way, some functions and structures from the above code are not declared in the standard Delphi sources, you can see their declaration in the demo examples that are part of this article. But this does not mean that they are not documented in MSDN :)
If we want to work with the TEB of our stream, the code will be greatly simplified due to the fact that we do not need to use the ToolHelp32.dll functions, but rather use the segment register FS (or GS for x64).
For example, very often there is such a function to get the TEB address:
function GetCurrentTEB: NativeUInt;
asm
{$IFDEF WIN64}
  // mov RAX, qword ptr GS:[30h]
  // реализованно через машкоды, ввиду неверной генерации кода инструкции 64-битным компилятором
  DB $65, $48, $8B, $04, $25, $30, 0, 0, 0
  // ну либо вот так, чуть менее оптимально
  mov RAX, qword ptr GS:[abs $30]
{$ELSE}
  mov EAX, FS:[18h]
{$ENDIF}
end;
In this case, the parameter NtTIB.Self of the TEB structure is accessed, which is located at offset 0x18 (or 0x30 in the case of 64-bit TEB) from its beginning.
However, we continue ...
Some of the data received, but this is not all the information available to us.
On the stack of each thread are SEH frames, which are generated automatically when you enter the try..finally / except block, as well as a stack of procedure calls. It would be nice to have these data on hand and display them in a more visual form - with reference to the region.
We will deal with the promotion of SEH frames with such a simple procedure:
procedure GetThreadSEHFrames(InitialAddr: Pointer);
type
  EXCEPTION_REGISTRATION = record
    prev, handler: Pointer;
  end;
var
  ER: EXCEPTION_REGISTRATION;
  lpNumberOfBytesRead: NativeUInt;
begin
  while ReadProcessMemory(GetCurrentProcess, InitialAddr, @ER,
    SizeOf(EXCEPTION_REGISTRATION), lpNumberOfBytesRead) do
  begin
    Writeln('SEH Frame at Addr: ',
      IntToHex(NativeUInt(InitialAddr), 1), ', handler at addr: ',
      IntToHex(NativeUInt(ER.handler), 1));
    InitialAddr := ER.prev;
    if DWORD(InitialAddr) <= 0 then Break;
  end;
end;
Having received the TEB.TIB.ExceptionList value, which points to the first EXCEPTION_REGISTRATION structure, as a parameter, it runs along the chain of these structures, focusing on the prev value of this structure, which contains the address of the previous EXCEPTION_REGISTRATION structure. And the handler parameter contains the address of the exception handler if it suddenly happens.
Everything looks like this:
Well, CallStack will receive the following procedure:
procedure GetThreadCallStack(hThread: THandle);
var
  StackFrame: TStackFrame;
  ThreadContext: PContext;
  MachineType: DWORD;
begin
  // ThreadContext должен быть выровнен, поэтому используем VirtualAlloc
  // которая автоматически выделит память выровненную по началу страницы
  // в противном случае получим ERROR_NOACCESS (998)
  ThreadContext := VirtualAlloc(nil, SizeOf(TContext), MEM_COMMIT, PAGE_READWRITE);
  try
    ThreadContext^.ContextFlags := CONTEXT_FULL;
    if not GetThreadContext(hThread, ThreadContext^) then
      Exit;
    ZeroMemory(@StackFrame, SizeOf(TStackFrame));
    StackFrame.AddrPC.Mode := AddrModeFlat;
    StackFrame.AddrStack.Mode := AddrModeFlat;
    StackFrame.AddrFrame.Mode := AddrModeFlat;
    StackFrame.AddrPC.Offset := ThreadContext.Eip;
    StackFrame.AddrStack.Offset := ThreadContext.Esp;
    StackFrame.AddrFrame.Offset := ThreadContext.Ebp;
    MachineType := IMAGE_FILE_MACHINE_I386;
    while True do
    begin
      if not StackWalk(MachineType, GetCurrentProcess, hThread, @StackFrame,
        ThreadContext, nil, nil, nil, nil) then
        Break;
      if StackFrame.AddrPC.Offset <= 0 then Break;
      Writeln('CallStack Frame Addr: ',
        IntToHex(NativeUInt(StackFrame.AddrFrame.Offset), 1));
      Writeln('CallStack Handler: ',
        IntToHex(NativeUInt(StackFrame.AddrPC.Offset), 1));
      Writeln('CallStack Stack: ',
        IntToHex(NativeUInt(StackFrame.AddrStack.Offset), 1));
      Writeln('CallStack Return: ',
        IntToHex(NativeUInt(StackFrame.AddrReturn.Offset), 1));
    end;
  finally
    VirtualFree(ThreadContext, SizeOf(TContext), MEM_FREE);
  end;
end;
True, unlike the Delphi debugger, it will output data about the procedures for which the stack frame is generated; it will skip the rest.
The StackWalk (or StackWalk64) function is responsible for listing information about stack frames.
Now the caveat: if we apply this code to ourselves, then it will be able to trace only one stack frame, after which there will be an exit (you can check on the demo application ).
This will happen for the following reason: for the StackWalk function to be properly traced, it is necessary to specify the parameters of the current stack frame (EBP and ESP / RBP and RSP for x64) and, in fact, the current code address (EIP or RIP register for x64). If we take this data from ourselves, then this will happen the moment we call the GetThreadContext function, and we will begin to spin the stack after we exit this function, where all three parameters become, to put it mildly, not valid. For this reason, it will not work to trace itself by calling this function.
It’s advisable to consider this moment ...
I’ll stop a bit later on getting information about the threads of a 32-bit process under a 64-bit OS, including 32 and 64-bit versions, but now ...
3. We collect data about heaps
The Delphi application itself, as a rule, does not use heaps, this is more the prerogative of C ++ applications, but still heaps are present here. Usually they are created and used by various third-party libraries for their needs.
The nuance in receiving heap data is that the HeapEntry elements that make up each heap can be several thousand, and the second nuance is that the Heap32Next function rebuilds the entire list with each call, creating a fairly sensitive delay (up to tens of seconds). I already wrote
about this unpleasant feature . True, in that article, the code was quite approximate, just to demonstrate the principle itself, and it will not work for us, but its more combed version will quite suit:
const
  RTL_HEAP_BUSY = 1;
  RTL_HEAP_SEGMENT = 2;
  RTL_HEAP_SETTABLE_VALUE = $10;
  RTL_HEAP_SETTABLE_FLAG1 = $20;
  RTL_HEAP_SETTABLE_FLAG2 = $40;
  RTL_HEAP_SETTABLE_FLAG3 = $80;
  RTL_HEAP_SETTABLE_FLAGS = $E0;
  RTL_HEAP_UNCOMMITTED_RANGE = $100;
  RTL_HEAP_PROTECTED_ENTRY = $200;
  RTL_HEAP_FIXED = (RTL_HEAP_BUSY or RTL_HEAP_SETTABLE_VALUE or
    RTL_HEAP_SETTABLE_FLAG2 or RTL_HEAP_SETTABLE_FLAG3 or
    RTL_HEAP_SETTABLE_FLAGS or RTL_HEAP_PROTECTED_ENTRY);
  STATUS_SUCCESS = 0;
  function CheckSmallBuff(Value: DWORD): Boolean;
  const
    STATUS_NO_MEMORY = $C0000017;
    STATUS_BUFFER_TOO_SMALL = $C0000023;
  begin
    Result := (Value = STATUS_NO_MEMORY) or (Value = STATUS_BUFFER_TOO_SMALL);
  end;
  function FlagToStr(Value: DWORD): string;
  begin
    case Value of
      LF32_FIXED: Result := 'LF32_FIXED';
      LF32_FREE: Result := 'LF32_FREE';
      LF32_MOVEABLE: Result := 'LF32_MOVEABLE';
    else
      Result := '';
    end;
  end;
var
  I, A: Integer;
  pDbgBuffer: PRtlDebugInformation;
  pHeapInformation: PRtlHeapInformation;
  pHeapEntry: PRtrHeapEntry;
  dwAddr, dwLastSize: ULONG_PTR;
  hit_seg_count: Integer;
  BuffSize: NativeUInt;
begin
  // Т.к. связка Heap32ListFirst, Heap32ListNext, Heap32First, Heap32Next
  // работает достаточно медленно, из-за постоянного вызова
  // RtlQueryProcessDebugInformation на каждой итерации, мы заменим ее вызов
  // аналогичным кодом без ненужного дубляжа
  // Создаем отладочный буфер
  BuffSize := $400000;
  pDbgBuffer := RtlCreateQueryDebugBuffer(BuffSize, False);
  // Запрашиваем информацию по списку куч процесса
  while CheckSmallBuff(RtlQueryProcessDebugInformation(GetCurrentProcessId,
    RTL_QUERY_PROCESS_HEAP_SUMMARY or RTL_QUERY_PROCESS_HEAP_ENTRIES,
    pDbgBuffer)) do
  begin
    // если размера буфера не хватает, увеличиваем...
    RtlDestroyQueryDebugBuffer(pDbgBuffer);
    BuffSize := BuffSize shl 1;
    pDbgBuffer := RtlCreateQueryDebugBuffer(BuffSize, False);
  end;
  if pDbgBuffer <> nil then
  try
    // Запрашиваем информацию по списку куч процесса
    if RtlQueryProcessDebugInformation(GetCurrentProcessId,
      RTL_QUERY_PROCESS_HEAP_SUMMARY or RTL_QUERY_PROCESS_HEAP_ENTRIES,
      pDbgBuffer) = STATUS_SUCCESS then
    begin
      // Получаем указатель на кучу по умолчанию
      pHeapInformation := @pDbgBuffer^.Heaps^.Heaps[0];
      // перечисляем все ее блоки...
      for I := 0 to pDbgBuffer^.Heaps^.NumberOfHeaps - 1 do
      begin
        // начиная с самого первого
        pHeapEntry := pHeapInformation^.Entries;
        dwAddr := DWORD(pHeapEntry^.u.s2.FirstBlock) +
          pHeapInformation^.EntryOverhead;
        dwLastSize := 0;
        A := 0;
        while A < Integer(pHeapInformation^.NumberOfEntries) do
        try
          hit_seg_count := 0;
          while (pHeapEntry^.Flags and RTL_HEAP_SEGMENT) = RTL_HEAP_SEGMENT do
          begin
            // Если блок отмечен флагом RTL_HEAP_SEGMENT,
            // то рассчитываем новый адрес на основе EntryOverhead
            dwAddr := DWORD(pHeapEntry^.u.s2.FirstBlock) +
              pHeapInformation^.EntryOverhead;
            Inc(pHeapEntry);
            Inc(A);
            Inc(hit_seg_count);
            // проверка выхода за границы блоков
            if A + hit_seg_count >=
              Integer(pHeapInformation^.NumberOfEntries - 1) then
              Continue;
          end;
          // Если блок не самый первый в сегменте, то текущий адрес блока равен,
          // адресу предыдущего блока + размер предыдущего блока
          if hit_seg_count = 0 then
            Inc(dwAddr, dwLastSize);
          // Выставляем флаги
          if pHeapEntry^.Flags and RTL_HEAP_FIXED <> 0 then
            pHeapEntry^.Flags := LF32_FIXED
          else
            if pHeapEntry^.Flags and RTL_HEAP_SETTABLE_FLAG1 <> 0 then
              pHeapEntry^.Flags := LF32_MOVEABLE
            else
              if pHeapEntry^.Flags and RTL_HEAP_UNCOMMITTED_RANGE <> 0 then
                pHeapEntry^.Flags := LF32_FREE;
          if pHeapEntry^.Flags = 0 then
            pHeapEntry^.Flags := LF32_FIXED;
          // Выводим данные
          Writeln('HeapID: ', I, ', entry addr: ', IntToHex(dwAddr, 8),
            ', size: ', IntToHex(pHeapEntry^.Size, 8), ' ', FlagToStr(pHeapEntry^.Flags));
         // Запоминаем адрес последнего блока
         dwLastSize := pHeapEntry^.Size;
         // Переходим к следующему блоку
         Inc(pHeapEntry);
        finally
          Inc(A);
        end;
        // Переходим к следующей куче
        Inc(pHeapInformation);
      end;
    end;
  finally
    RtlDestroyQueryDebugBuffer(pDbgBuffer);
  end;
  Readln;
end.
In short, by calling the RtlQueryProcessDebugInformation, RtlCreateQueryDebugBuffer, and RtlQueryProcessDebugInformation functions, a buffer is created that contains information about the current process heaps. Then, knowing the structure of the data stored in it, we obtain this data in a loop.
pDbgBuffer ^ .Heaps - stores heap lists (analogue of THeapList32), and the records themselves are stored in pDbgBuffer ^ .Heaps ^ .Heaps [N] .Entries (analogue of THeapEntry32).
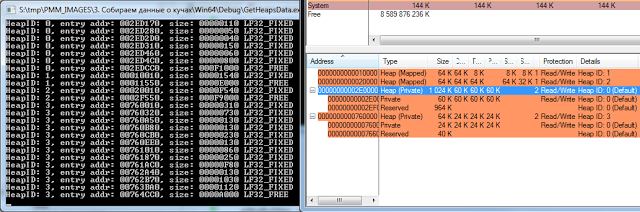
This code will output the following information:
In principle, I use heaps quite rarely when debugging, but sometimes this information can come in handy.
4. We collect data on downloaded PE files
Now it's time to get information about executable files and libraries loaded into the address space of the process. There are several ways to do this (for example, by analyzing PEB.LoaderData), but let's do it easier.
As a rule, a separate region is allocated for the PE file (well, at least I haven’t encountered such that the PE image was loaded without alignment with the top of the region), therefore, taking the code from the first chapter and checking the data of the first page of the region as a basis for compliance with the PE file, we get a list of all loaded libraries and executable files.
The following code detects the presence of a valid PE file at the specified address:
function CheckPEImage(hProcess: THandle;
  ImageBase: Pointer; var IsPEImage64: Boolean): Boolean;
var
  ReturnLength: NativeUInt;
  IDH: TImageDosHeader;
  NT: TImageNtHeaders;
begin
  Result := False;
  IsPEImage64 := False;
  if not ReadProcessMemory(hProcess, ImageBase,
    @IDH, SizeOf(TImageDosHeader), ReturnLength) then Exit;
  if IDH.e_magic <> IMAGE_DOS_SIGNATURE then Exit;
  ImageBase := Pointer(NativeInt(ImageBase) + IDH._lfanew);
  if not ReadProcessMemory(hProcess, ImageBase,
    @NT, SizeOf(TImageNtHeaders), ReturnLength) then Exit;
  Result := NT.Signature = IMAGE_NT_SIGNATURE;
  IsPEImage64 :=
    (NT.FileHeader.Machine = IMAGE_FILE_MACHINE_IA64) or
    (NT.FileHeader.Machine = IMAGE_FILE_MACHINE_ALPHA64) or
    (NT.FileHeader.Machine = IMAGE_FILE_MACHINE_AMD64);
end;
Well, more precisely, he just checks for the presence of ImageDosHeader and ImageNTHeader, focusing on their signatures. In principle, for 99% of cases this is enough.
The third parameter is just informative; it shows whether the PE file is 64-bit.
You can get the path to the downloaded file by calling the GetMappedFileName function:
function GetFileAtAddr(hProcess: THandle; ImageBase: Pointer): string;
begin
  SetLength(Result, MAX_PATH);
  SetLength(Result,
    GetMappedFileName(hProcess, ImageBase, @Result[1], MAX_PATH));
end;
And now let's try to see what we are loading into a regular console application:
var
  MBI: TMemoryBasicInformation;
  dwLength: NativeUInt;
  Address: PByte;
  IsPEImage64: Boolean;
begin
  Address := nil;
  dwLength := SizeOf(TMemoryBasicInformation);
  while VirtualQuery(Address, MBI, dwLength) <> 0 do
  begin
    if CheckPEImage(GetCurrentProcess, MBI.BaseAddress, IsPEImage64) then
    begin
      Write(IntToHex(NativeUInt(MBI.BaseAddress), 8), ': ',
        GetFileAtAddr(GetCurrentProcess, MBI.BaseAddress));
      if IsPEImage64 then
        Writeln(' (x64)')
      else
        Writeln(' (x32)');
    end;
    Inc(Address, MBI.RegionSize);
  end;
  Readln;
end.
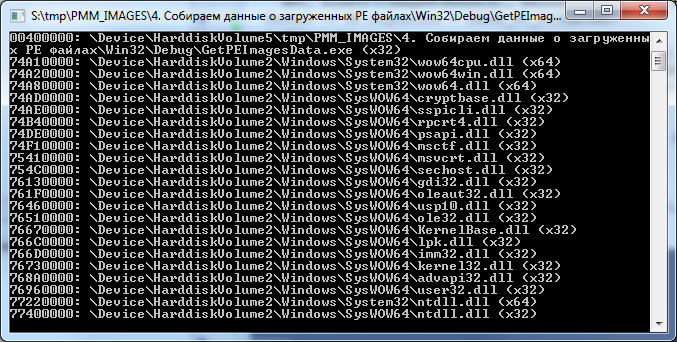
You get the following picture:
64-bit library in a 32-bit application? Yes, it's easy :)
I have a 32-bit application, the operating system Windows 7 x64. Judging by what is shown in the picture, four 64-bit libraries live and work quietly in our 32-bit process, however, there is nothing unusual here - this is the so-called Wow64 ( Win32 emulation in 64-bit Windows ).
But it immediately becomes clear where 64-bit analogues of 32-bit streams and heaps come from.
Now, in a good way, you need to get the addresses of the sections of each PE file so that you can show them more clearly. All sections are aligned at the beginning of the page and do not intersect with each other.
Let's do it like this:
procedure GetInfoFromImage(const FileName: string; ImageBase: Pointer);
var
  ImageInfo: TLoadedImage;
  ImageSectionHeader: PImageSectionHeader;
  I: Integer;
begin
  if MapAndLoad(PAnsiChar(AnsiString(FileName)), nil, @ImageInfo, True, True) then
  try
    ImageSectionHeader := ImageInfo.Sections;
    for I := 0 to Integer(ImageInfo.NumberOfSections) - 1 do
    begin
      Write(
        IntToHex((NativeUInt(ImageBase) + ImageSectionHeader^.VirtualAddress), 8), ': ',
        string(PAnsiChar(@ImageSectionHeader^.Name[0])));
      if IsExecute(ImageSectionHeader^.Characteristics) then
        Write(' Execute');
      if IsWrite(ImageSectionHeader^.Characteristics) then
        Write(' Writable');
      Writeln;
      Inc(ImageSectionHeader);
    end;
  finally
    UnMapAndLoad(@ImageInfo);
  end;
  Writeln;
end;
Here we use a call to the MapAndLoad function, which, in addition to loading the file and checking its headers, also performs section alignment by calling NtMapViewOfSection.
For its own process, of course, calling this function is redundant, because the required PE file is already loaded into the address space of the process, but since If we need a more universal code for working with other processes, we will use this approach.
MapAndLoad is also good because it allows 64-bit processes to load 32-bit PE files (though this does not work for 32-bit processes), and this feature will come in handy later on.
The essence of the code is this: after executing MapAndLoad, we will have a filled TLoadedImage structure on hand, the Sections parameter of which points to an array of TImageSectionHeader structures. Each of these structures has a VirtualAddress field, which is the offset from the library load address. Adding the value of this field to the hInstance library, we get the address of the section.
The IsExecute and IsWrite functions check the characteristics of the section and return True if the section contains executable code (IsExecute) or data available for modification (IsWrite). They look as follows:
function IsExecute(const Value: DWORD): Boolean;
begin
  Result := False;
  if (Value and IMAGE_SCN_CNT_CODE) =
    IMAGE_SCN_CNT_CODE then Result := True;
  if (Value and IMAGE_SCN_MEM_EXECUTE) =
    IMAGE_SCN_MEM_EXECUTE then Result := True;
end;
function IsWrite(const Value: DWORD): Boolean;
begin
  Result := False;
  if (Value and IMAGE_SCN_CNT_UNINITIALIZED_DATA) =
    IMAGE_SCN_CNT_UNINITIALIZED_DATA then Result := True;
  if (Value and IMAGE_SCN_MEM_WRITE) = IMAGE_SCN_MEM_WRITE then
    Result := True;
end;
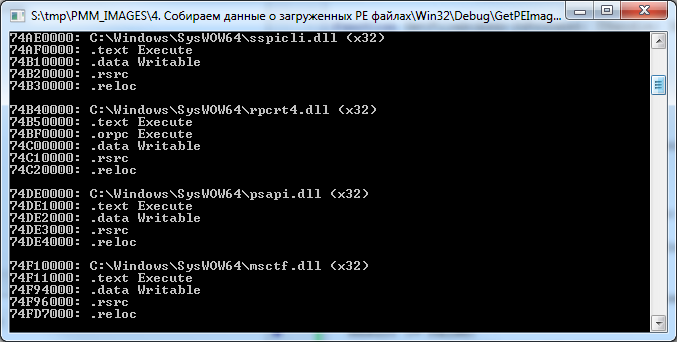
As a result of this code, we will see the following:
True, with this code there is another small nuance.
As seen in the previous picture, the GetMappedFileName function returns the path to the downloaded file in the following form: "\ Device \ HarddiskVolume2 \ Windows \ System32 \ wow64cpu.dll", and the MapAndLoad function requires a normalized path of the form "C: \ Windows \ System32 \ wow64cpu. dll. "
The following code is responsible for bringing the path to the familiar look:
function NormalizePath(const Value: string): string;
const
  OBJ_CASE_INSENSITIVE         = $00000040;
  STATUS_SUCCESS               = 0;
  FILE_SYNCHRONOUS_IO_NONALERT = $00000020;
  FILE_READ_DATA = 1;
  ObjectNameInformation = 1;
  DriveNameSize = 4;
  VolumeCount = 26;
  DriveTotalSize = DriveNameSize * VolumeCount;
var
  US: UNICODE_STRING;
  OA: OBJECT_ATTRIBUTES;
  IO: IO_STATUS_BLOCK;
  hFile: THandle;
  NTSTAT, dwReturn: DWORD;
  ObjectNameInfo: TOBJECT_NAME_INFORMATION;
  Buff, Volume: string;
  I, Count, dwQueryLength: Integer;
  lpQuery: array [0..MAX_PATH - 1] of Char;
  AnsiResult: AnsiString;
begin
  Result := Value;
  // Подготавливаем параметры для вызова ZwOpenFile
  RtlInitUnicodeString(@US, StringToOleStr(Value));
  // Аналог макроса InitializeObjectAttributes
  FillChar(OA, SizeOf(OBJECT_ATTRIBUTES), #0);
  OA.Length := SizeOf(OBJECT_ATTRIBUTES);
  OA.ObjectName := @US;
  OA.Attributes := OBJ_CASE_INSENSITIVE;
  // Функция ZwOpenFile спокойно открывает файлы, путь к которым представлен
  // с использованием символьных ссылок, например:
  // \SystemRoot\System32\ntdll.dll
  // \??\C:\Windows\System32\ntdll.dll
  // \Device\HarddiskVolume1\WINDOWS\system32\ntdll.dll
  // Поэтому будем использовать ее для получения хендла
  NTSTAT := ZwOpenFile(@hFile, FILE_READ_DATA or SYNCHRONIZE, @OA, @IO,
    FILE_SHARE_READ or FILE_SHARE_WRITE or FILE_SHARE_DELETE,
    FILE_SYNCHRONOUS_IO_NONALERT);
  if NTSTAT = STATUS_SUCCESS then
  try
    // Файл открыт, теперь смотрим его формализованный путь
    NTSTAT := NtQueryObject(hFile, ObjectNameInformation,
      @ObjectNameInfo, MAX_PATH * 2, @dwReturn);
    if NTSTAT = STATUS_SUCCESS then
    begin
      SetLength(AnsiResult, MAX_PATH);
      WideCharToMultiByte(CP_ACP, 0,
        @ObjectNameInfo.Name.Buffer[ObjectNameInfo.Name.MaximumLength -
        ObjectNameInfo.Name.Length {$IFDEF WIN64} + 4{$ENDIF}],
        ObjectNameInfo.Name.Length, @AnsiResult[1],
        MAX_PATH, nil, nil);
      Result := string(PAnsiChar(AnsiResult));
      // Путь на открытый через ZwOpenFile файл
      // возвращается в виде \Device\HarddiskVolumeХ\бла-бла
      // Осталось только его сопоставить с реальным диском
      SetLength(Buff, DriveTotalSize);
      Count := GetLogicalDriveStrings(DriveTotalSize, @Buff[1]) div DriveNameSize;
      for I := 0 to Count - 1 do
      begin
        Volume := PChar(@Buff[(I * DriveNameSize) + 1]);
        Volume[3] := #0;
        // Преобразуем имя каждого диска в символьную ссылку и
        // сравниваем с формализированным путем
        QueryDosDevice(PChar(Volume), @lpQuery[0], MAX_PATH);
        dwQueryLength := Length(string(lpQuery));
        if Copy(Result, 1, dwQueryLength) = string(lpQuery) then
        begin
          Volume[3] := '\';
          if lpQuery[dwQueryLength - 1] <> '\' then
            Inc(dwQueryLength);
          Delete(Result, 1, dwQueryLength);
          Result := Volume + Result;
          Break;
        end;
      end;
    end;
  finally
    ZwClose(hFile);
  end;
end;
This is already quite old code, which I constantly use to bring to the normal path. Its essence is that of the following types of paths:
- \ SystemRoot \ System32 \ ntdll.dll
- \ ?? \ C: \ Windows \ System32 \ ntdll.dll
- \ Device \ HarddiskVolume1 \ WINDOWS \ system32 \ ntdll.dll
... get the fixed "\ Device \ HarddiskVolume1 \ WINDOWS \ system32 \ ntdll.dll".
This is done by calling ZwOpenFile + NtQueryObject, after which all disks in the system are simply sorted and for each QueryDosDevice is called, which returns the path in the same format. After that, the paths are compared and (if they coincide), the corresponding drive label is substituted for the transferred path.
But this is lyrics.
To be completely satisfied with yourself, it is advisable to display the directories of the PE file as well, so that it is immediately clear where to look, for example, the import table, where UNWIND sits, etc.
This is done with fairly simple code:
procedure EnumDirectoryes(ImageBase: Pointer; ImageInfo: TLoadedImage;
  AddrStart, AddrEnd: NativeUInt);
const
  DirectoryStr: array [0..14] of string =
    ('export', 'import', 'resource', 'exception',
    'security', 'basereloc', 'debug', 'copyright',
    'globalptr', 'tls', 'load_config', 'bound_import',
    'iat', 'delay_import', 'com');
var
  I: Integer;
  dwDirSize: DWORD;
  DirAddr: Pointer;
  ReadlDirAddr: NativeUInt;
begin
  for I := 0 to 14 do
  begin
    DirAddr := ImageDirectoryEntryToData(ImageInfo.MappedAddress,
      True, I, dwDirSize);
    if DirAddr = nil then Continue;
    ReadlDirAddr := NativeUint(ImageBase) +
        NativeUint(DirAddr) - NativeUint(ImageInfo.MappedAddress);
    if (ReadlDirAddr >= AddrStart) and (ReadlDirAddr < AddrEnd) then
      Writeln(
        IntToHex(ReadlDirAddr, 8), ': directory "', DirectoryStr[I], '"');
  end;
end;
Having the TLoadedImage structure on hand, we can simply call the ImageDirectoryEntryToData function to get its address, however, it will be bound to the address at which the PE file is displayed. To translate it into a real one, you need to subtract from the current address the address at which the image is displayed, thus obtaining the offset from the beginning of the file, and already add it to the ImageBase library.
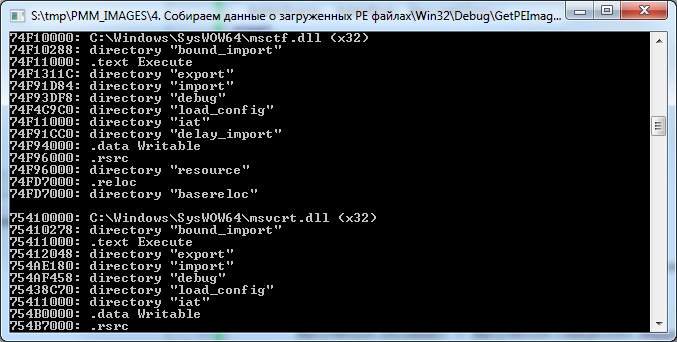
The result is this picture:
It is immediately clear that, for example, in the ".text" section of msctf.dll library there are import / export / pending import directories, etc.
The resource directory sits in the ".rsrc" section, and the relocs are also where they should be, however, the "bound_import" directory drops out of the scheme.
Yes, indeed, this directory is not located directly in any of the sections of the library, such is its peculiarity. It usually goes immediately after the PE heading (although it can sometimes be found in between sections). This directory serves to provide a mechanism for “tied import”, which is found mainly in programs and libraries that are part of the OS.
Its essence is that all addresses of imported functions are sewn into the executable file at the compilation stage, so you do not need to perform unnecessary gestures by running through the regular import table in search of the address of the function.
But the overhead is also appropriate, because as soon as any of the libraries declared in the linked import section changes, the application must be recompiled.
5. Process Environment Unit (PEB) + KUSER_SHARED_DATA
Having data on streams, heaps and executable files on hand, right now you can make a small utility that displays information in a readable form, but what else can be added?
At a minimum, it is highly desirable to receive and output information from the process environment block.
Access to it can be obtained by calling the NtQueryInformationProcess function with the flag ProcessBasicInformation (constant equal to zero). In this case, the hands will have a PROCESS_BASIC_INFORMATION structure, in which the PebBaseAddress field will contain the PEB address.
But this will be relevant only if the bits of the processes (of the requesting and of which we are requesting information) match. If we call this function from a 64-bit application as applied to a 32-bit one, we will get the address of the 64-bit PEB, and not the native 32-bit one.
In order to access Wow64PEB from a 64-bit application (let's call it that), you must call the NtQueryInformationProcess function with the ProcessWow64Information parameter (constant equal to 26) and the buffer size equal to SizeOf (ULONG_PTR). In this case, instead of the PROCESS_BASIC_INFORMATION structure, the function will return a pointer to a 32-bit PEB, from which we will read out the information we need using ReadProcessMemory.
What is PEB?
Roughly speaking, this is not a well-documented structure, most of which is designed to store data used directly by the system. But this does not mean that it is not interesting to the developer of a regular application. In particular, this structure contains a number of interesting fields, such as: BeingDebugged flag indicating whether the debugger is connected to the process; Pointer to PEB_LDR_DATA, which contains information about the modules loaded into the process; and a lot of the rest is quite useful information for the programmer, especially for someone who knows how to use it for their own purposes :)
This structure looks something like this (declaration for Windows7 x86 / 64):
  PPEB = ^TPEB;
  TPEB = record
    InheritedAddressSpace: BOOLEAN;
    ReadImageFileExecOptions: BOOLEAN;
    BeingDebugged: BOOLEAN;
    BitField: BOOLEAN;
        {
            BOOLEAN ImageUsesLargePages : 1;
            BOOLEAN IsProtectedProcess : 1;
            BOOLEAN IsLegacyProcess : 1;
            BOOLEAN IsImageDynamicallyRelocated : 1;
            BOOLEAN SkipPatchingUser32Forwarders : 1;
            BOOLEAN IsPackagedProcess : 1;
            BOOLEAN IsAppContainer : 1;
            BOOLEAN SpareBits : 1;
        }
    Mutant: HANDLE;
    ImageBaseAddress: PVOID;
    LoaderData: PVOID;
    ProcessParameters: PRTL_USER_PROCESS_PARAMETERS;
    SubSystemData: PVOID;
    ProcessHeap: PVOID;
    FastPebLock: PRTLCriticalSection;
    AtlThunkSListPtr: PVOID;
    IFEOKey: PVOID;
    EnvironmentUpdateCount: ULONG;
    UserSharedInfoPtr: PVOID;
    SystemReserved: ULONG;
    AtlThunkSListPtr32: ULONG;
    ApiSetMap: PVOID;
    TlsExpansionCounter: ULONG;
    TlsBitmap: PVOID;
    TlsBitmapBits: array[0..1] of ULONG;
    ReadOnlySharedMemoryBase: PVOID;
    HotpatchInformation: PVOID;
    ReadOnlyStaticServerData: PPVOID;
    AnsiCodePageData: PVOID;
    OemCodePageData: PVOID;
    UnicodeCaseTableData: PVOID;
    KeNumberOfProcessors: ULONG;
    NtGlobalFlag: ULONG;
    CriticalSectionTimeout: LARGE_INTEGER;
    HeapSegmentReserve: SIZE_T;
    HeapSegmentCommit: SIZE_T;
    HeapDeCommitTotalFreeThreshold: SIZE_T;
    HeapDeCommitFreeBlockThreshold: SIZE_T;
    NumberOfHeaps: ULONG;
    MaximumNumberOfHeaps: ULONG;
    ProcessHeaps: PPVOID;
    GdiSharedHandleTable: PVOID;
    ProcessStarterHelper: PVOID;
    GdiDCAttributeList: ULONG;
    LoaderLock: PRTLCriticalSection;
    NtMajorVersion: ULONG;
    NtMinorVersion: ULONG;
    NtBuildNumber: USHORT;
    NtCSDVersion: USHORT;
    PlatformId: ULONG;
    Subsystem: ULONG;
    MajorSubsystemVersion: ULONG;
    MinorSubsystemVersion: ULONG;
    AffinityMask: ULONG_PTR;
    {$IFDEF WIN32}
    GdiHandleBuffer: array [0..33] of ULONG;
    {$ELSE}
    GdiHandleBuffer: array [0..59] of ULONG;
    {$ENDIF}
    PostProcessInitRoutine: PVOID;
    TlsExpansionBitmap: PVOID;
    TlsExpansionBitmapBits: array [0..31] of ULONG;
    SessionId: ULONG;
    AppCompatFlags: ULARGE_INTEGER;
    AppCompatFlagsUser: ULARGE_INTEGER;
    pShimData: PVOID;
    AppCompatInfo: PVOID;
    CSDVersion: UNICODE_STRING;
    ActivationContextData: PVOID;
    ProcessAssemblyStorageMap: PVOID;
    SystemDefaultActivationContextData: PVOID;
    SystemAssemblyStorageMap: PVOID;
    MinimumStackCommit: SIZE_T;
    FlsCallback: PPVOID;
    FlsListHead: LIST_ENTRY;
    FlsBitmap: PVOID;
    FlsBitmapBits: array [1..FLS_MAXIMUM_AVAILABLE div SizeOf(ULONG) * 8] of ULONG;
    FlsHighIndex: ULONG;
    WerRegistrationData: PVOID;
    WerShipAssertPtr: PVOID;
    pContextData: PVOID;
    pImageHeaderHash: PVOID;
    TracingFlags: ULONG;
        {
            ULONG HeapTracingEnabled : 1;
            ULONG CritSecTracingEnabled : 1;
            ULONG LibLoaderTracingEnabled : 1;
            ULONG SpareTracingBits : 29;
        }
    CsrServerReadOnlySharedMemoryBase: ULONGLONG;
  end;
By the way, compare this structure with that which is officially available in MSDN .
For Window 2000 / XP / 2003 there will be small changes, but not very critical.
I will not paint each field, those who work with PEB already know? what exactly they need, but in some fields I will draw your attention.
So:
- BeingDebugged field - in the third part of the article about the debugger, I showed one of the options for bypassing the detection of this using the application memory patch. The essence of the approach was precisely in determining the PEB address and changing the value of the BeingDebugged parameter to zero, after which the IsDebuggerPresent function, guided by this field, began to return False, saying? that she did not find a debugger.
- Поле ImageBaseAddress — указывает на hInstance приложения (оно может не совпадать с полем ImageBase в PE заголовке).
- LoaderData — указатель на данные о загруженных модулях, в нем хранится достаточно полезная информация для тех, кто строит защиту приложения самостоятельно, но, к сожалению, пока что это выходит за рамки данной статьи. На этом поле я остановлюсь чуть подробнее, когда увидит свет статья о детектировании инжекта в ваше приложение :)
- ProcessParameters — откуда берут информацию ParamStr/GetCurrentDir и т.п. функции? Именно отсюда. Здесь же сидит адрес переменных окружения.
- А еще мы можем узнать сервиспак системы, не дергая реестр, в этом нам поможет поле CSDVersion. Да, впрочем, поля NtMajorVersion/NtMinorVersion/NtBuildNumber говорят сами за себя.
Well and so on - you can continue for a long time.
Most of these fields occupy their pages in the process address space. For example, ProcessParameters usually sits in one of the heaps created by the loader, environment variables are also located somewhere in that area.
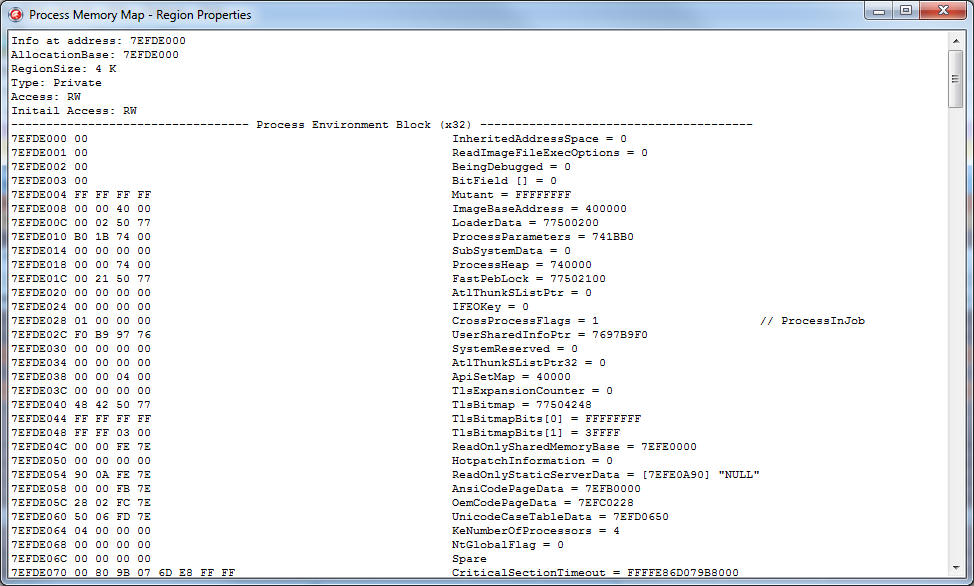
If we want to visualize all this (and I’m leading to this), we must have this data on hand so that there is something to display in the final application.
Agree, it’s much nicer to have something in the form of this instead of a certain block of binary data:
But there is also KUSER_SHARED_DATA.
This is also the structure used by the system, and you constantly meet with it, calling the same GetTickCount or IsProcessorFeaturePresent.
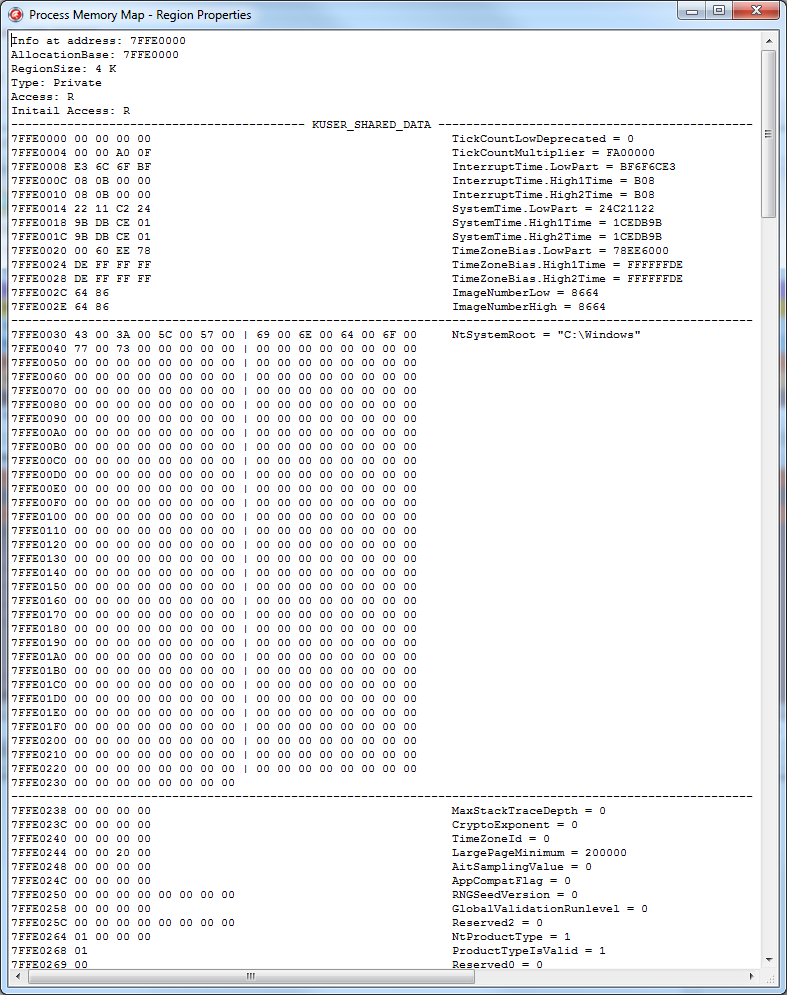
For example, NtSystemRoot sits in it, and, again, why list everything, it's easier to see:
- If you want to know what process is active without calling GetForegroundWindow, read ConsoleSessionForegroundProcessId.
- Are you trying to slip the left version of Win so that part of the protection system that is not designed for previous OS is disconnected? Read the current values from the NtMajorVersion / NtMinorVersion fields ...
However, perhaps, we will stop here for now ...
6. TRegionData
On this the theoretical part ended and it was time to put it all into practice.
First of all, you need to decide how to store information about the regions. Preparing for the article, I wrote a set of classes allocated to the common namespace “MemoryMap”, you can find them as part of the demo examples .
IMPORTANT!!!
This set of classes was developed taking into account the innovations present in Delphi XE4; under older versions of Delphi its performance was not tested and is not guaranteed.
Information for each region will be stored by the TRegionData class, implemented in the "MemoryMap.RegionData.pas" module.
It looks approximately as follows (in the process of developing a project, the class declaration may change).
  TRegionData = class
  private
    FParent: TRegionData;
    FRegionType: TRegionType;
    FMBI: TMemoryBasicInformation;
    FDetails: string;
    FRegionVisible: Boolean;
    FHiddenRegionCount: Integer;
    FTotalRegionSize: NativeUInt;
    FHeap: THeapData;
    FThread: TThreadData;
    FPEBData: TSystemData;
    FSection: TSection;
    FContains: TList;
    FDirectories: TList;
    FShared: Boolean;
    FSharedCount: Integer;
    FFiltered: Boolean;
  protected
...
  public
    constructor Create;
    destructor Destroy; override;
    property RegionType: TRegionType read FRegionType;
    property MBI: TMemoryBasicInformation read FMBI;
    property Details: string read FDetails;
    property RegionVisible: Boolean read FRegionVisible;
    property HiddenRegionCount: Integer read FHiddenRegionCount;
    property Parent: TRegionData read FParent;
    property TotalRegionSize: NativeUInt read FTotalRegionSize;
    property Heap: THeapData read FHeap;
    property Thread: TThreadData read FThread;
    property SystemData: TSystemData read FPEBData;
    property Section: TSection read FSection;
    property Directory: TList read FDirectories;
    property Contains: TList read FContains;
  end;
In order:
Each region, as a rule, stores in itself data of one type.
Those. for heaps, stacks of streams, PE files, its own region of pages is allocated.
The RegionType property is responsible for storing the region type. This is an enumerated type declared as follows:
  // Тип региона
  TRegionType = (
    rtDefault,
    rtHeap,                // регион содержит элементы кучи
    rtThread,              // регион содержит стек потока или TEB
    rtSystem,              // регион содержит системные данные (PEB/KUSER_SHARED_DATA и т.п.)
    rtExecutableImage      // регион содержит образ исполняемого PE файла
    );
Region settings obtained by calling VirtualQueryEx are stored in the MBI field.
A brief description of the region is stored in Details. You can store anything in it, for example, the path to the displayed PE file, if any, a string description of the stream ID, etc. ...
The following three parameters are used to organize the tree structure.
One of the regions is the root node (root), the rest are child ones.
The RegionVisible flag indicates whether the region is the root node.
The HiddenRegionCount property contains the number of subregions (AllocationBase of which is equal to the BaseAddress root).
Well, the Parent parameter stores a link to the root.
It’s not done optimally, it would be possible to organize a classic tree, but at the moment there is no time to redo it, maybe sometime later :)
TotalRegionSize contains the total size of all subregions, including the root one.
If the region contains a heap, data about its first element is placed in the Heap parameter, which is the following structure:
  THeapEntry = record
    Address: ULONG_PTR;
    Size: SIZE_T;
    Flags: ULONG;
  end;
  THeapData = record
    ID: DWORD;
    Wow64: Boolean;
    Entry: THeapEntry;
  end;
The remaining heap elements located within the region are placed in the Contains field.
In general, the Contains field can contain many types of data.
  TContainItemType = (itHeapBlock, itThreadData,
    itStackFrame, itSEHFrame, itSystem);
  TContainItem = record
    ItemType: TContainItemType;
    function Hash: string;
    case Integer of
      0: (Heap: THeapData);
      1: (ThreadData: TThreadData);
      2: (StackFrame: TThreadStackEntry);
      3: (SEH: TSEHEntry);
      4: (System: TSystemData);
  end;
Next is the Thread field, it stores information about the thread that the region uses to store its own data.
type
  TThreadInfo = (tiNoData, tiExceptionList, tiStackBase,
    tiStackLimit, tiTEB, tiThreadProc);
type
  TThreadData = record
    Flag: TThreadInfo;
    ThreadID: Integer;
    Address: Pointer;
    Wow64: Boolean;
  end;
If there is a lot of data about a stream within a region (for example, a list of SEH frames or a CallStack stream), they are also placed in the Contains field.
Data from system structures (fields of PEB / TEB structures, etc.) are placed in the SystemData field, which is a record from the data address and its description.
Also, this data can be placed in the Contains field.
If the region belongs to one of the sections of the PE file, the section data is placed in the Section parameter. Well, the list of file directories is located in the Directory field.
Something like this in a nutshell. Now, to present data on the process memory card, we need to get a list of regions, create an instance of the TRegionData class for each of them, and initialize the fields of the created object with the required information.
The TMemoryMap class is responsible for this ...
7. TMemoryMap
This class is implemented in the module "MemoryMap.Core.pas".
Its task is literally reduced to three main stages:
- Get a list of all the selected regions in the memory of the specified application, data on threads / heaps / loaded images, etc.
- Creating a TRegionData list and filling in its fields with the information received.
- Saving / loading data, filtering data.
In practice, everything looks a little more complicated.
The basic procedure for collecting information is as follows:
function TMemoryMap.InitFromProcess(PID: Cardinal;
  const ProcessName: string): Boolean;
var
  ProcessLock: TProcessLockHandleList;
begin
  Result := False;
  FRegions.Clear;
  FModules.Clear;
  FFilter := fiNone;
  ProcessLock := nil;
  // Открываем процесс на чтение
  FProcess := OpenProcess(
    PROCESS_QUERY_INFORMATION or PROCESS_VM_READ,
    False, PID);
  if FProcess = 0 then
    RaiseLastOSError;
  try
    FPID := PID;
    FProcessName := ProcessName;
    // определяем битность процесса
    FProcess64 := False;
    {$IFDEF WIN64}
      if not IsWow64(FProcess) then
        FProcess64 := True;
    {$ELSE}
      // если наше приложение 32 битное, а исследуемый процесс 64-битный
      // кидаем исключение
      if Is64OS and not IsWow64(FProcess) then
        raise Exception.Create('Can''t scan process.');
    {$ENDIF}
    // проверяем необходимость суспенда процесса
    if SuspendProcessBeforeScan then
      ProcessLock := SuspendProcess(PID);
    try
      FSymbols := TSymbols.Create(FProcess);
      try
        FPEImage := TPEImage.Create;
        try
          FWorkset := TWorkset.Create(FProcess);;
          try
            // получаем данные по регионам и отмапленым файлам
            GetAllRegions;
          finally
            FWorkset.Free;
          end;
          {$IFDEF WIN64}
          // если есть возможность получаем данные о 32 битных кучах
          AddWow64HeapsData;
          {$ENDIF}
          // добавляем данные о потоках
          AddThreadsData;
          // добавляем данные о кучах
          AddHeapsData;
          // добавляем данные о Process Environment Block
          AddPEBData;
          // добавляем данные о загруженых PE файлах
          AddImagesData;
        finally
          FPEImage.Free;
        end;
      finally
        FSymbols.Free;
      end;
    finally
      if SuspendProcessBeforeScan then
        ResumeProcess(ProcessLock);
    end;
    // сортируем
    SortAllContainsBlocks;
    // считаем общую информацию о регионах
    CalcTotal;
    // применяем текущий фильтр
    UpdateRegionFilters;
  finally
    CloseHandle(FProcess);
  end;
end;
I gave the sample code of the GetAllRegions / AddThreadsData / AddHeapsData and AddImagesData procedures in the first four chapters and I will not focus on it, but I would like to deal with the rest.
The very first step after opening a process is to determine the bitness of the process.
This is necessary for the reason that if the bit sizes of the processes (current and for which we receive information) do not match, then some additional steps need to be taken.
The general scheme is as follows:
- A 32-bit process can receive data on 32-bit under a 32-bit OS in full.
- A 64-bit process can receive data on a 64-bit process in full.
- A 32-bit process CANNOT receive data on a 64-bit process .
- 32-битный процесс может получить данные по 32-битному под 64-битной ОС, но частично.
- 64-битный процесс может получить данные по 32-битному, но частично.
If everything is clear with the first two points, then the other three will be considered in more detail.
The reason that a 32-bit process cannot get data on a 64-bit one is simple: the size of the pointer will not allow it, plus ReadProcessMemory will periodically throw an error ERROR_PARTIAL_COPY.
But getting data from a 32-bit process in a 64-bit OS is much trickier.
As I said earlier, in a 32-bit application, four 64-bit libraries are loaded that create their heaps / threads.
If we get a list of heaps and streams from a 32-bit application, we will see data only related to 32 bits; data on 64-bit analogs cannot be obtained.
The same will be the case when requesting data about a 32-bit process from a 64-bit one, only data relating to 64 bits will be returned. Although in this case there is an option to get them partially.
In particular, access to a 32-bit PEB is made by calling this function:
const
  ProcessWow64Information = 26;
...
  NtQueryInformationProcess(FProcess, ProcessWow64Information,
    @FPebWow64BaseAddress, SizeOf(ULONG_PTR), @ReturnLength)
Access to the 32-bit TEB can be obtained by reading the address from the 64-bit TEB, which is stored in the NtTIB.ExceptionList parameter.
        // в 64 битном TEB поле TIB.ExceptionList указывает на начало Wow64TEB
        if not ReadProcessMemory(hProcess,
          TIB.ExceptionList, @WOW64_NT_TIB, SizeOf(TWOW64_NT_TIB),
          lpNumberOfBytesRead) then Exit;
You can get the context of the 32-bit stream for the CallStack promotion using this code:
const
  ThreadWow64Context = 29;
...
    ThreadContext^.ContextFlags := CONTEXT_FULL;
    if NtQueryInformationThread(hThread, ThreadWow64Context, ThreadContext,
      SizeOf(TWow64Context), nil) <> STATUS_SUCCESS then Exit;
Or by calling the Wow64GetThreadContext function.
But I don’t know how to get data about 32-bit heaps from a 64-bit process in a legal way. The only option that I am applying now is sending a command to a 32-bit process, which collects data about 32-bit heaps and sends it back to 64-bit (this is what the handler in the AddWow64HeapsData function does).
Now that we’ve figured out the definition of the process bit and what it is for, let's go further, namely, to call the SuspendProcess function.
In a good way, this is only necessary so that the data in the remote process does not change to become irrelevant at the time of reading. However, usually I use this set of classes in two cases, for my own application or for an application under the debugger. In both cases, it is not necessary to freeze the threads, but if some third-party application is being analyzed, then why not?
After freezing a remote process, three helper classes are created.
- TSymbols - I will talk about him in the next chapter.
- TPEImage - this class contains methods that allow you to get information about the PE file, described in the fourth chapter. Made for convenience only.
- TWorkset is another helper class whose task is to obtain information about shared memory.
In essence, TWorkset stores a list of structures of the form:
  TShareInfo = record
    Shared: Boolean;
    SharedCount: Byte;
  end;
These structures are stored in a dictionary and each is associated with a specific page address.
The parameters are simple:
- Shared - whether the page is public
- SharedCount - how many links are on the page
This data is obtained in the following way, in which it all boils down to calling the QueryWorkingSet function:
procedure TWorkset.InitWorksetData(hProcess: THandle);
const
  {$IFDEF WIN64}
  AddrMask = $FFFFFFFFFFFFF000;
  {$ELSE}
  AddrMask = $FFFFF000;
  {$ENDIF}
  SharedBitMask = $100;
  SharedCountMask = $E0;
  function GetSharedCount(Value: ULONG_PTR): Byte; inline;
  begin
    Result := (Value and SharedCountMask) shr 5;
  end;
var
  WorksetBuff: array of ULONG_PTR;
  I: Integer;
  ShareInfo: TShareInfo;
begin
  SetLength(WorksetBuff, $400000);
  while not QueryWorkingSet(hProcess, @WorksetBuff[0],
    Length(WorksetBuff) * SizeOf(ULONG_PTR)) do
    SetLength(WorksetBuff, WorksetBuff[0] * 2);
  for I := 0 to WorksetBuff[0] - 1 do
  begin
    ShareInfo.Shared := WorksetBuff[I]  and SharedBitMask <> 0;
    ShareInfo.SharedCount := GetSharedCount(WorksetBuff[I]);
    try
      FData.Add(Pointer(WorksetBuff[I] and AddrMask), ShareInfo);
    except
      on E: EListError do ;
    else
      raise;
    end;
  end;
end;
This function returns an ULONG_PTR array, each element of which stores data as follows: the first five bits store page security attributes; the next three bits are the number of processes to which this page is available; one more bit indicates the accessibility of the page; Well and then comes the address of the page itself.
More details can be found here: PSAPI_WORKING_SET_BLOCK .
In fact, this is just an information class, no more, no less.
However, back to our code.
The next steps are:
- GetAllRegions is an analogue of the code from the first chapter.
- AddThreadsData is an analog of the code from the second chapter.
- AddHeapsData is an analog of the code from the third chapter.
- AddPEBData - output of structure data from the fifth chapter.
- AddImagesData is an analogue of the code from the fourth chapter.
As you can see, I already told you everything interesting (almost) :)
The remaining steps are not interesting, except for calling UpdateRegionFilters.
It performs a utilitarian function, namely, it excludes regions that are currently unnecessary from the list (well, for example, removes regions with unallocated memory, etc.).
This procedure will be called constantly when the filter is changed through the Filter property.
However, you can see all this from the code of the class itself if you wish.
Working with him is quite simple:
var
  AMemoryMap: TMemoryMap;
  M: TMemoryStream;
  I: Integer;
begin
  try
    M := TMemoryStream.Create;
    try
      // Создаем класс
      AMemoryMap := TMemoryMap.Create;
      try
        // получаем текущую карту памяти
        AMemoryMap.InitFromProcess(GetCurrentProcessId, '');
        // сохраняем ее,
        AMemoryMap.SaveToStream(M);
        // тут можно прикрутить дампы регионов и все что душе угодно
      finally
        AMemoryMap.Free;
      end;
      // тут якобы передали данные куда-то, теперь загружаем их и работаем
      M.Position := 0;
      // Создаем класс
      AMemoryMap := TMemoryMap.Create;
      try
        // загружаем данные
        AMemoryMap.LoadFromStream(M);
        // убираем вообще все фильтры
        AMemoryMap.Filter := fiNone; // не обязательно
        // говорим отображать регионы с невыделенной памятью
        AMemoryMap.ShowEmpty := True;
        // выводим список регионов
        for I := 0 to AMemoryMap.Count - 1 do
          Writeln(NativeUInt(AMemoryMap[I].MBI.BaseAddress));
      finally
        AMemoryMap.Free;
      end;
    finally
      M.Free;
    end;
  except
    on E: Exception do
      Writeln(E.ClassName, ': ', E.Message);
  end;
  Readln;
end.
As they say, I wrote for myself, therefore, working with this class is as easy as shelling pears :)
8. TSymbols - work with symbols
The essence of this class is to obtain more detailed information about the address in the process. Well, for example, in the second chapter, we received a CallStack stream (or SEH frame handlers) and these were just some addresses. But it’s much more interesting to see something like this picture instead of dry numbers:
This is done very simply - just calling the SymGetSymFromAddr function is enough, but there are several nuances.
Let's look at the code first:
function TSymbols.GetDescriptionAtAddr(Address, BaseAddress: ULONG_PTR;
  const ModuleName: string): string;
const
  BuffSize = $7FF;
{$IFDEF WIN64}
  SizeOfStruct = SizeOf(TImagehlpSymbol64);
  MaxNameLength = BuffSize - SizeOfStruct;
var
  Symbol: PImagehlpSymbol64;
  Displacement: DWORD64;
{$ELSE}
  SizeOfStruct = SizeOf(TImagehlpSymbol);
  MaxNameLength = BuffSize - SizeOfStruct;
var
  Symbol: PImagehlpSymbol;
  Displacement: DWORD;
{$ENDIF}
begin
  Result := '';
  if not FInited then Exit;
  GetMem(Symbol, BuffSize);
  try
    Symbol^.SizeOfStruct := SizeOfStruct;
    Symbol^.MaxNameLength := MaxNameLength;
    Symbol^.Size := 0;
    SymLoadModule(FProcess, 0, PAnsiChar(AnsiString(ModuleName)),
      nil, BaseAddress, 0);
    try
      if SymGetSymFromAddr(FProcess, Address, @Displacement, Symbol) then
        Result := string(PAnsiChar(@(Symbol^).Name[0])) + ' + 0x' + IntToHex(Displacement, 4)
      else
      begin
        // с первой попытки может и не получиться
        SymLoadModule(FProcess, 0, PAnsiChar(AnsiString(ModuleName)), nil, BaseAddress, 0);
        if SymGetSymFromAddr(FProcess, Address, @Displacement, Symbol) then
          Result := string(PAnsiChar(@(Symbol^).Name[0])) + ' + 0x' + IntToHex(Displacement, 4);
      end;
    finally
      SymUnloadModule(FProcess, BaseAddress);
    end;
  finally
    FreeMem(Symbol);
  end;
  if Result = '' then
    Result := ExtractFileName(ModuleName) + ' + 0x' + IntToHex(Address - BaseAddress, 1);
end;
To correctly obtain a description of the name of the function to which the address belongs, you need to know the path to the library to which the function belongs, or the address to which this library is loaded (both parameters are used in the code). These parameters are required for the SymLoadModule function.
The second caveat is that the call to the SymGetSymFromAddr function can sometimes fail. The reason is not clear to me, but the Internet periodically describes this situation and how to solve it is to call the SymLoadModule function again without calling SymUnloadModule. I did not understand such strange behavior - but it really helps.
The last nuance is that this function will return a valid description of the address only when this information is present (characters from an external file are loaded or they are part of the desired module).
This information is not very important for debugging, but it simplifies it a bit.
Here, for example, looks like the standard Chrome browser thread stack (CallStack + SEH frames):
More useful information that symbols can provide is a list of exported library functions and their current addresses.
In the TSymbols class, this information is obtained by calling the GetExportFuncList procedure and looks like this:
function SymEnumsymbolsCallback(SymbolName: LPSTR; SymbolAddress: ULONG_PTR;
  SymbolSize: ULONG; UserContext: Pointer): Bool; stdcall;
var
  List: TStringList;
begin
  List := UserContext;
  List.AddObject(string(SymbolName), Pointer(SymbolAddress));
  Result := True;
end;
procedure TSymbols.GetExportFuncList(const ModuleName: string;
  BaseAddress: ULONG_PTR; Value: TStringList);
begin
  SymLoadModule(FProcess, 0, PAnsiChar(AnsiString(ModuleName)),
    nil, BaseAddress, 0);
  try
    if not SymEnumerateSymbols(FProcess, BaseAddress,
      @SymEnumsymbolsCallback, Value) then
    begin
      SymLoadModule(FProcess, 0, PAnsiChar(AnsiString(ModuleName)),
        nil, BaseAddress, 0);
      SymEnumerateSymbols(FProcess, BaseAddress,
        @SymEnumsymbolsCallback, Value)
    end;
  finally
    SymUnloadModule(FProcess, BaseAddress);
  end;
end;
It all comes down to calling SymEnumerateSymbols, which passes the address of the callback function.
When it is called, the SymbolName parameter will contain the name of the exported function, and SymbolAddress its address.
This is enough to display the following sign to the user:
You can see the implementation of this class in more detail, including the omitted calls to SymSetOptions and SymInitialize in the module "MemoryMap.Symbols.pas".
9. ProcessMemoryMap
Well, here we come to the final part of the article.
As I said earlier, I use the MemoryMap set of classes in two ways:
1. Integrating it into the EurekaLog output by overlapping its OnAttachedFilesRequest handler, where I add the current process map that was current at the time the exception occurred, and dumps of all Private regions (pages not associated with defined data that has the MEM_PRIVATE flag) and stream stacks, plus some of the information from the PEB. Usually this is enough to analyze the causes of the error.
2. I use it as an alternative tool for analyzing a debugged application.
For the second option, a separate utility was implemented that works directly with the MemoryMap classes, plus it adds some additional functionality.
I will not describe its source code, I will walk only a little on the functionality.
From the front end, it is almost one-on-one reminiscent of VMMap. However, this was originally planned, because such an interface is most convenient for analysis.
In the upper part there is a list with general information on the regions grouped by their types, it is also a filter.
At the moment, it represents the following functionality:
1. View the contents of memory at the specified address (Ctrl + Q).
This functionality, in principle, is present in the Delphi debugger in the CPU View window, but this mode has much more possibilities. For example, if you look at the PEB field, the data will be displayed in a different form:
This is what the process parameter block will look like:
Well and so on. In total, at the moment, the utility can display demapsed data for the following structures:
- PEB - Process Environment Block (32/64)
- TEB - Thread Environment Block (32/64)
- KUSER_SHARED_DATA
- PE Header (IMAGE_DOS_HEADER / IMAGE_NT_HEADER / IMAGE_FILE_HEADER / IMAGE_OPTIONAL_HEADER (32/64) / IMAGE_DATA_DIRECTORY / IMAGE_SECTION_HEADERS)
- Process Parameters (32/64)
This list is not final, periodically new structures will be added to it.
2. Search for data in the process memory (Ctrl + F):
Unfortunately, this functionality is missing in the Delphi debugger.
You can search by Ansi, or by Unicode string, or simply by abstract HEX buffer. When searching, you can specify the address of the start of the search, as well as a flag indicating the need to search the pages, access to which is possible only for reading.
The result is displayed as a window with a memory dump, shown above.
3. Comparator of two memory cards. It is included in the settings.
Allows you to find the differences between the two memory cards and displays them as text.
Only the cards themselves are compared, not the data. Those. if 4 bytes have changed at some address, this change will not be displayed. But in the event that the size of the region has changed, a bunch has gone, the file has been uploaded / downloaded, etc. - All this will be displayed in the comparison results.
You can compare both the current picture of the map with that previously saved, or when updating the picture using the F5 hotkey.
4. A memory dump.
Also missing functionality in the Delphi debugger. Allows you to save to disk the contents of the memory of the specified region or data from the specified address.
5. The output of all available exported functions from all libraries loaded into the analyzed process (Ctrl + E).
As well as a quick search for a function by its name or address.
So far, the current functionality is enough for me personally, and I have not added new, but in the future this utility will develop.
ProcessMemoryMap is an OpenSource project.
Its latest stable release is always available at the link: http://rouse.drkb.ru/winapi.php#pmm2
GitHub repository with the latest code changes can be found here: https://github.com/AlexanderBagel/ProcessMemoryMap
Direct link to the source code : https://github.com/AlexanderBagel/ProcessMemoryMap/archive/master.zip
Direct link to the latest build: http://rouse.drkb.ru/files/processmm_bin.zip
Self-assembly requires an installed package of components of Virtual TreeView version 5 and higher: http://www.soft-gems.net/ .
The assembly is carried out using Delphi XE4 and higher in the "Win32 / Release" mode, and the 64-bit version of this utility will be automatically assembled and connected (as a resource).
Under older versions of Delphi, ProcessMemoryMap was not tested.
10. In conclusion
Well, I hope this material will be useful to you. Of course, I went only to the very tops, because if you disclose all the material in more detail, the volume of the article will increase enormously.
Therefore, here are a few links where you can find out a little more information.
Information about the TEB / PEB system structures, etc. can be found here:
http://processhacker.sourceforge.net/
http://redplait.blogspot.ru/
http://www.reactos.org/en
Information about PE files:
http://msdn.microsoft.com/ en-us / magazine / ms809762.aspx
SEH information:
http://msdn.microsoft.com/en-us/library/ms680657(v=VS.85).aspx
http://www.microsoft.com/msj /0197/exception/exception.aspx
http://qxov.narod.ru/articles/seh/seh.html
The source code of all demo examples can be taken from this link .
Many THANKS to the Delphi Masters forum for their repeated assistance in preparing this article.
Personal thanks for the proofreading to Dmitry aka “Ptiburdukov’s brother”, Andrey Vasiliev aka “Inovet”, and also to Sergey aka “Cartman”.
Good luck.