R: ellipse confidence visualization package
Hello.
In the last post from the R-hub “Visualization of a two-dimensional Gaussian on a plane” , an algorithm for constructing a confidence ellipse from a covariance matrix was described. The algorithm was accompanied by an example and an R-script.
Perhaps the author of the post on Visualization of the Gaussian mephistopheies and readers of the R-hub will find the following information useful. The R repository has an ellipse package . This package contains various procedures for constructing ellipses of confidence areas.
Consider an example.
To generate a sample from the two-dimensional normal distribution, we use the mvtnorm package .
We construct a data sample of 1000 elements with a vector of average values of mu and a covariance matrix sigma :
For the sigma covariance matrix, we find the coordinates of 100 points of the ellipse of the 95% confidence region:
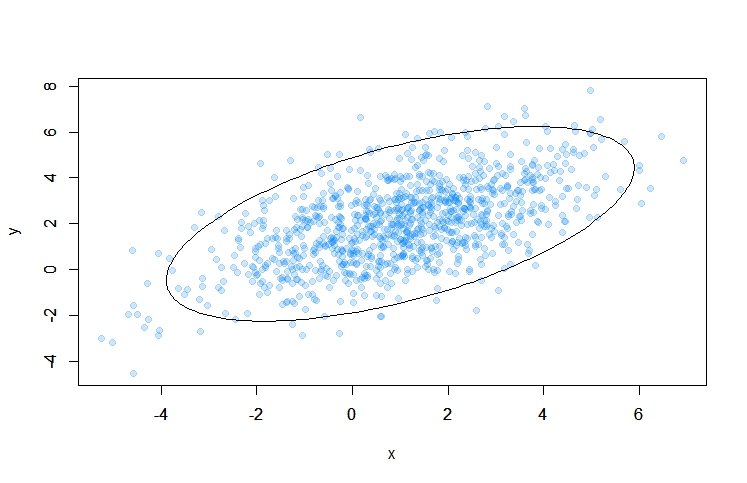
Plot the data points and the confidence.ellipse ellipse on the plane
Result:
In the last post from the R-hub “Visualization of a two-dimensional Gaussian on a plane” , an algorithm for constructing a confidence ellipse from a covariance matrix was described. The algorithm was accompanied by an example and an R-script.
Perhaps the author of the post on Visualization of the Gaussian mephistopheies and readers of the R-hub will find the following information useful. The R repository has an ellipse package . This package contains various procedures for constructing ellipses of confidence areas.
Consider an example.
Sample from a two-dimensional normal distribution
To generate a sample from the two-dimensional normal distribution, we use the mvtnorm package .
We construct a data sample of 1000 elements with a vector of average values of mu and a covariance matrix sigma :
require(mvtnorm)
mu <- c(1,2)
sigma <- matrix(c(4,2,2,3), ncol=2)
set.seed(100)
data <- rmvnorm(n=1000, mean=mu, sigma=sigma) # генерируем выборку с заданными параметрами
Ellipse 95% Confidence Area
For the sigma covariance matrix, we find the coordinates of 100 points of the ellipse of the 95% confidence region:
require(ellipse)
confidence.ellipse <- ellipse(sigma,centre=mu,level=0.95,npoints=100)
Visualization
Plot the data points and the confidence.ellipse ellipse on the plane
plot(data,pch=19,col=rgb(0, 0.5, 1, 0.2),  xlab="x", ylab="y",
         xlim=range(data[,1]), ylim=range(data[,2]))
par(new=TRUE)
plot(confidence.ellipse,type="l", xlab="",ylab="",
       xlim=range(data[,1]),ylim=range(data[,2]))
Result: