Monitor the CPU core in Zabbix and create arbitrary counters in Low-level discovery
Not so long ago there was an article about LLD. I found it boring because describes about the same as in the documentation. I decided to go further and use LLD to monitor those parameters that previously could not be automatically monitored, or it was quite difficult. Let us examine the work of LLD using the example of logical processors in Windows:
Initially, I was interested in advanced mounting besides the CPU core and the load on physical disks. Before the discovery was introduced, these tasks were partially solved by manual addition. I added conditional disks to the zabbix_agent configuration file, and generally distorted it differently. As a result, it was very inconvenient, a lot of unpleasant handmade work was added, and in general it was somehow wrong in general :)
The result is a circuit that automatically detects the kernels in the system, as well as the physical disks installed in the system and adds the necessary data collection elements. In order to find out how to implement this at home, welcome to cat. I will try to more or less detail the work on the example of the CPU and how to do the same, but for physical disks.
To begin with, it is worth referring to the documentation, which signs what LLD is and what it is eaten with. In addition to standard templates, we will be interested in the 4th section with a description of the JSON detection format. That is, we will create our own detection method. In fact, it all comes down to calling a script that generates the necessary data in the right format.
Create a script.
For the script, I chose powershell. I know him a little better than other scripting languages, and given that everything will revolve in the WMI circle , it could be done on VBS.
So, the script.
The task of the script is to determine the number of logical processors using WMI and output this data to the console in JSON format. We will pass a variable with the name {#PROCNUM} , as well as its values. The output format will be something like this, depending on the number of logical processors:
The script itself looks like this:
Now we get that when the script starts, it finds out how many cores and forms a package for sending.
What do we do next? You need to create a Discovery rule .
To do this, go to the desired template, which is added to the hosts we are interested in, in the Discovery section and click the Create discovery rule button .

Here we see the incomprehensible value of the key: PSScript [proc.ps1] field . This is a UserParameter . This item was created for convenience, now in each new object we can simply enter a parameter in the form of the name of a PS script and it will look for it in a predetermined place. The parameter itself is written in the client configuration file (usually called zabbix_agentd.conf) and looks like this:
We have created a new discovery rule with custom data collection. The request to change the information is set to 1 hour. Perhaps, for static data such as the number of processors, this is too often :), but everyone is free to put their own value. For initial data collection and debugging, it is better to reduce this value to very small values, so as not to wait for hours to execute the script.
Good. We started collecting data on the number of processors. But as a result, we need not this data, but a new item in monitoring. It is item that can collect data, not our script, our script only serves to detect the elements themselves to collect data.
And in order to create a new data collection element obtained on the basis of LLD, in the same Discovery section we create a new prototype. To do this, go to item prototypes and click create item prototype . I created the following collection element:

A standard performance counter is used to collect data. Zabbix has the perf_counter key to collect this data. Instead of the logical core number, we insert the resulting value in the form of a variable from the Discovery section .
Now everything is ready. Or almost everything ...
From now on, when the discovery script detects logical processors, data collection elements created exactly for this number of processors will be created for this host.
And now if we go into items for the host, the low-level discovery for which has already worked, then we will see that new elements have appeared:
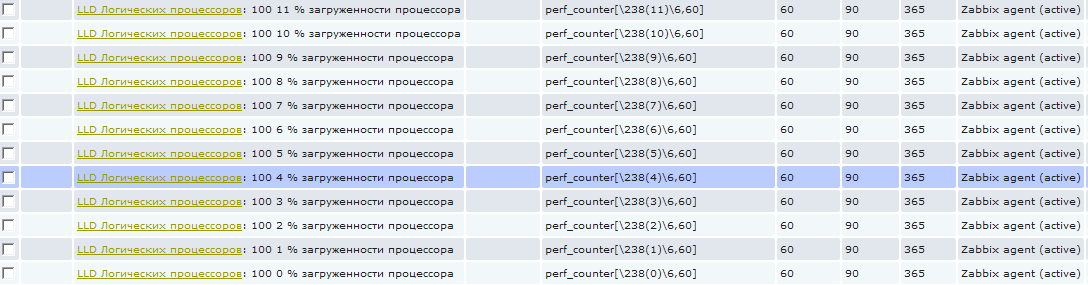
These items cannot be removed in the standard way, as they are created automatically; they are highlighted with a special prefix with the name of the low-level discovery rule. In the screenshot it seems that some garbage is written in the name :), in fact, everything is simple, I use the three-digit code in each name to sort it. That is, 100 is just a sorting number. The next digit from 0 to 11 is the logical processor number. And then "% CPU utilization". And then at first it might seem that this is 0% processor load and I'm trying to collect this value :)
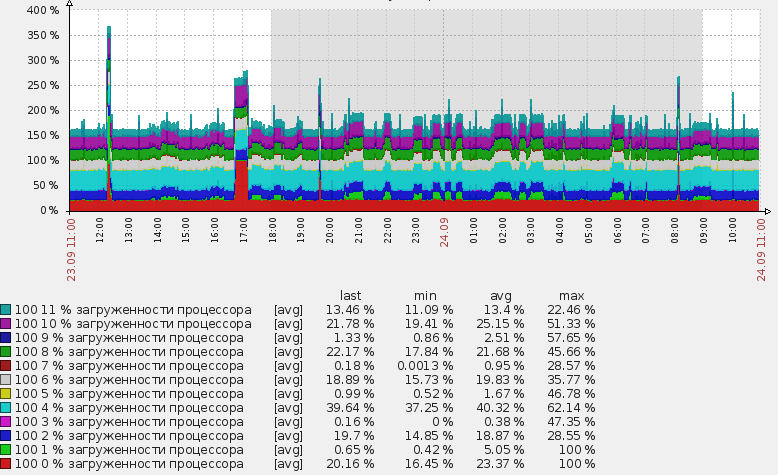
The only drawback of this whole method is that a graph, such as in the title of this post, cannot be created using the low-level detection mechanism. That is, we can, of course, create not only item , but also graphan object for each logical processor, but it will not work to create one summary graph automatically with all detected logical processors. At least I did not see how this could be done, on the zabbix forum they also could not tell me. This, of course, is not a particularly serious drawback, but if you have 200 hosts, this can be a problem :). After all, the schedule for each host will need to be created manually.
It is better to understand the above method, and then this opens up quite wide opportunities for monitoring objects in the system, the number of which either differs from host to host or their number changes during operation.
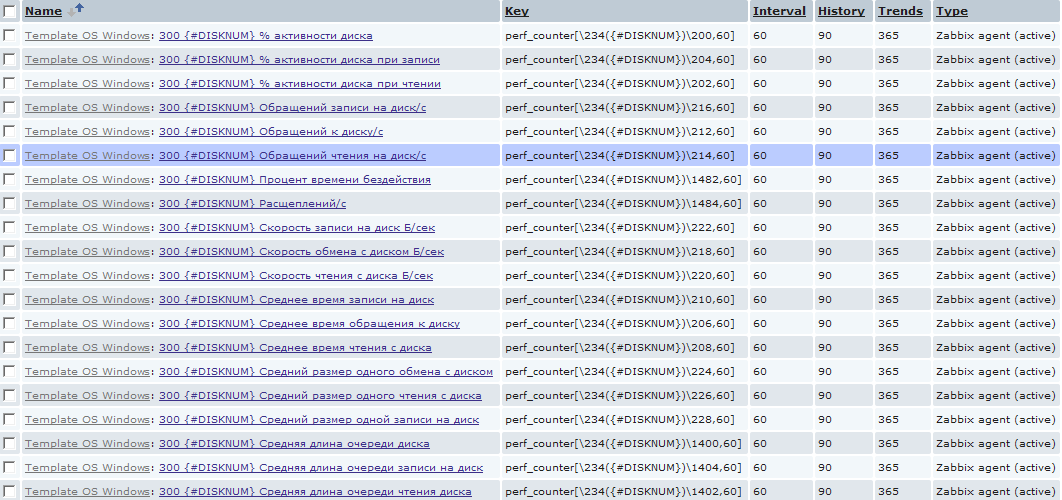
For example, it often happens that you need to determine if there was a lack of resources on a physical disk installed in the server. Most often, these data are difficult to capture in real time and I want to have them collected ex post. To do this, I introduced a similar detection for physical disks to collect extensive statistics on them. And, unlike processors, data collection elements, I created them in abundance.
Here, of course, you need to be careful and if you have mysql on some old clogged computer, then such a quantity will quickly take your database to heaven. Because in the above example, for each host, 20 new elements are created for each physical disk, which will create one new value per minute. On the scale of a couple of dozens of servers with heaps of different disks, this translates into a more or less significant amount of data. But here everyone is free to choose their own samurai path :)
The script for LLD physical disks looks like this:
Add a new discovery rule similar to the CPU. In the same way we create the necessary elements in discovery .
In general, of course, this mechanism provides rather great opportunities for identifying various elements for monitoring. In the same way, for example, you can add monitoring of network interfaces, processes in the system, services and any other elements whose name and quantity are not known in advance.
I hope this article helps someone deal with LLD. I will be happy to answer your questions.
Initially, I was interested in advanced mounting besides the CPU core and the load on physical disks. Before the discovery was introduced, these tasks were partially solved by manual addition. I added conditional disks to the zabbix_agent configuration file, and generally distorted it differently. As a result, it was very inconvenient, a lot of unpleasant handmade work was added, and in general it was somehow wrong in general :)
The result is a circuit that automatically detects the kernels in the system, as well as the physical disks installed in the system and adds the necessary data collection elements. In order to find out how to implement this at home, welcome to cat. I will try to more or less detail the work on the example of the CPU and how to do the same, but for physical disks.
Type of data sent
To begin with, it is worth referring to the documentation, which signs what LLD is and what it is eaten with. In addition to standard templates, we will be interested in the 4th section with a description of the JSON detection format. That is, we will create our own detection method. In fact, it all comes down to calling a script that generates the necessary data in the right format.
Create a script.
For the script, I chose powershell. I know him a little better than other scripting languages, and given that everything will revolve in the WMI circle , it could be done on VBS.
So, the script.
The task of the script is to determine the number of logical processors using WMI and output this data to the console in JSON format. We will pass a variable with the name {#PROCNUM} , as well as its values. The output format will be something like this, depending on the number of logical processors:
{
 "data":[
 { "{#PROCNUM}":"0"},
 { "{#PROCNUM}":"1"},
 { "{#PROCNUM}":"2"},
 { "{#PROCNUM}":"3"},
 { "{#PROCNUM}":"4"},
 { "{#PROCNUM}":"5"},
 { "{#PROCNUM}":"6"},
 { "{#PROCNUM}":"7"},
 { "{#PROCNUM}":"8"},
 { "{#PROCNUM}":"9"},
 { "{#PROCNUM}":"10"},
 { "{#PROCNUM}":"11"}
 ]
}
Data Generation Script
The script itself looks like this:
$items = Get-WmiObject Win32_PerfFormattedData_PerfOS_Processor | select name  |where-object {$_.name -ne '_Total'}
write-host "{"
write-host " `"data`":["
write-host
foreach ($objItem in $Items) {
 $line =  " { `"{#PROCNUM}`":`"" + $objItem.Name + "`"},"
 write-host $line
}
write-host
write-host " ]"
write-host "}"
write-host
Now we get that when the script starts, it finds out how many cores and forms a package for sending.
What do we do next? You need to create a Discovery rule .
Add low-level detection in zabbix server settings
To do this, go to the desired template, which is added to the hosts we are interested in, in the Discovery section and click the Create discovery rule button .
Here we see the incomprehensible value of the key: PSScript [proc.ps1] field . This is a UserParameter . This item was created for convenience, now in each new object we can simply enter a parameter in the form of the name of a PS script and it will look for it in a predetermined place. The parameter itself is written in the client configuration file (usually called zabbix_agentd.conf) and looks like this:
UserParameter=PSScript[*],powershell -File "C:\Program Files\zabbix agent\script\$1"
We have created a new discovery rule with custom data collection. The request to change the information is set to 1 hour. Perhaps, for static data such as the number of processors, this is too often :), but everyone is free to put their own value. For initial data collection and debugging, it is better to reduce this value to very small values, so as not to wait for hours to execute the script.
Setting up data prototypes
Good. We started collecting data on the number of processors. But as a result, we need not this data, but a new item in monitoring. It is item that can collect data, not our script, our script only serves to detect the elements themselves to collect data.
And in order to create a new data collection element obtained on the basis of LLD, in the same Discovery section we create a new prototype. To do this, go to item prototypes and click create item prototype . I created the following collection element:
A standard performance counter is used to collect data. Zabbix has the perf_counter key to collect this data. Instead of the logical core number, we insert the resulting value in the form of a variable from the Discovery section .
Now everything is ready. Or almost everything ...
From now on, when the discovery script detects logical processors, data collection elements created exactly for this number of processors will be created for this host.
And now if we go into items for the host, the low-level discovery for which has already worked, then we will see that new elements have appeared:
These items cannot be removed in the standard way, as they are created automatically; they are highlighted with a special prefix with the name of the low-level discovery rule. In the screenshot it seems that some garbage is written in the name :), in fact, everything is simple, I use the three-digit code in each name to sort it. That is, 100 is just a sorting number. The next digit from 0 to 11 is the logical processor number. And then "% CPU utilization". And then at first it might seem that this is 0% processor load and I'm trying to collect this value :)
The only drawback of this whole method is that a graph, such as in the title of this post, cannot be created using the low-level detection mechanism. That is, we can, of course, create not only item , but also graphan object for each logical processor, but it will not work to create one summary graph automatically with all detected logical processors. At least I did not see how this could be done, on the zabbix forum they also could not tell me. This, of course, is not a particularly serious drawback, but if you have 200 hosts, this can be a problem :). After all, the schedule for each host will need to be created manually.
Monitor the performance of each physical disk in the system
It is better to understand the above method, and then this opens up quite wide opportunities for monitoring objects in the system, the number of which either differs from host to host or their number changes during operation.
For example, it often happens that you need to determine if there was a lack of resources on a physical disk installed in the server. Most often, these data are difficult to capture in real time and I want to have them collected ex post. To do this, I introduced a similar detection for physical disks to collect extensive statistics on them. And, unlike processors, data collection elements, I created them in abundance.
Here, of course, you need to be careful and if you have mysql on some old clogged computer, then such a quantity will quickly take your database to heaven. Because in the above example, for each host, 20 new elements are created for each physical disk, which will create one new value per minute. On the scale of a couple of dozens of servers with heaps of different disks, this translates into a more or less significant amount of data. But here everyone is free to choose their own samurai path :)
The script for LLD physical disks looks like this:
$items = Get-WmiObject Win32_PerfRawData_PerfDisk_PhysicalDisk | select name  |where-object {$_.name -ne '_Total'}
write-host "{"
write-host " `"data`":["
write-host
foreach ($objItem in $Items) {
 $line =  " { `"{#DISKNUM}`":`"" + $objItem.Name + "`"},"
 write-host $line
}
write-host
write-host " ]"
write-host "}"
write-host
Add a new discovery rule similar to the CPU. In the same way we create the necessary elements in discovery .
In general, of course, this mechanism provides rather great opportunities for identifying various elements for monitoring. In the same way, for example, you can add monitoring of network interfaces, processes in the system, services and any other elements whose name and quantity are not known in advance.
I hope this article helps someone deal with LLD. I will be happy to answer your questions.